—

VanEck Semiconductor ETF (SMH) — chart, structure and Closelooknet read

Pick a ticker to load its detail page.

The desk on SMH

What this diary said about VanEck Semiconductor ETF, what it holds and what would change its view — in its own words, dated. Investment diary, not advice.

What we said

What we hold

BookPositionSinceResult
AI Buildout 20 shares · average entry $556.58 — +9.0%

Model books as of 25 Sept 2026; wikifolio positions from the official wikifolio data, entries in euros. Results are unrealised, before any exit. A record of what the diary does, not a recommendation to do the same.

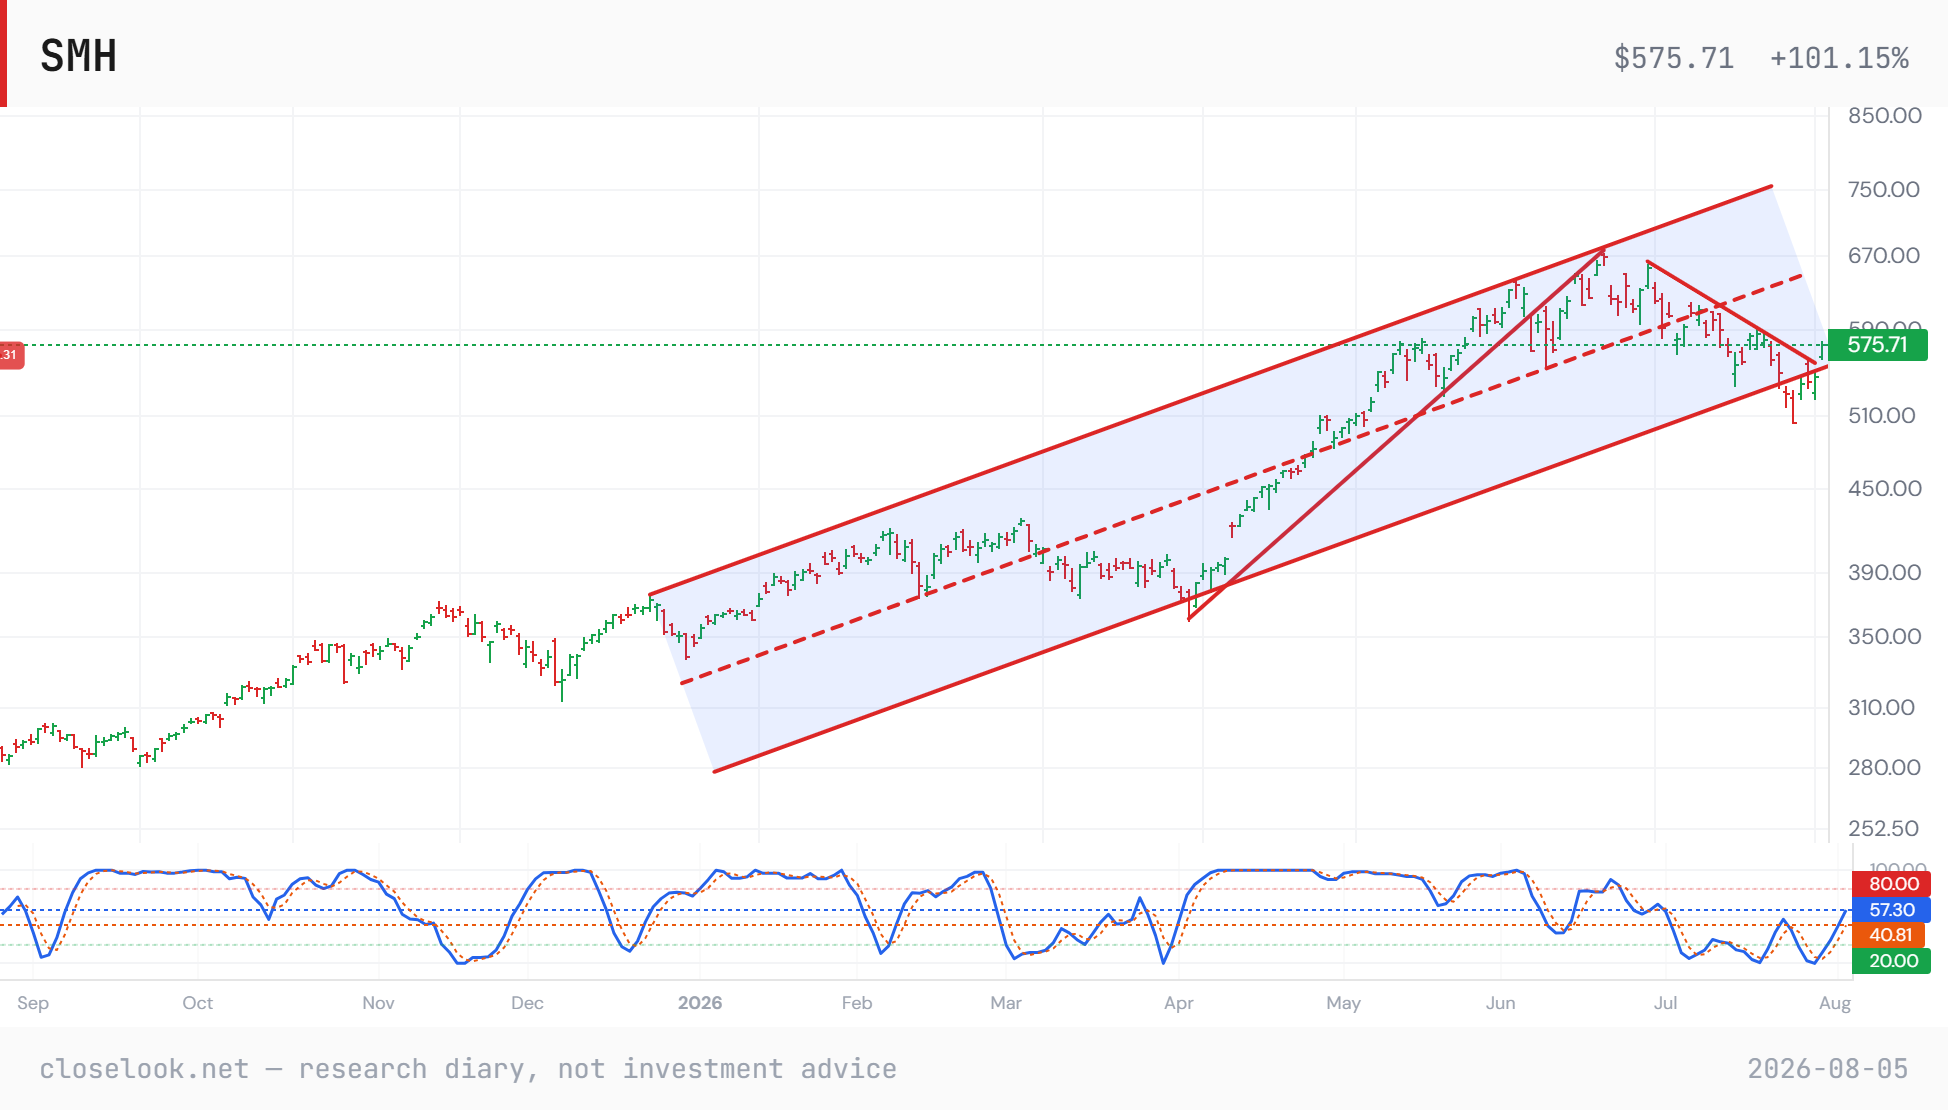
Charts from the desk on SMH

The charts this diary drew or picked on VanEck Semiconductor ETF, as published — each dated and linked to the piece that explains it.

Signals for this name

Every Closelooknet reading that exists for SMH, from the same nightly bakes the boards use. Research diary readings, not advice.

Buying from Europe — UCITS versions of SMH

EU / EEA investors · UCITS funds

Investors in the EU and the EEA usually cannot buy VanEck Semiconductor ETF itself: US-listed funds publish no key information document, which EU rules require. These European-domiciled funds follow the MVIS US Listed Semiconductor 25 index family instead.

FundIndexDividendsDomicileXetra (EUR)Londonvs SMH, since
VanEck Semiconductor UCITS ETFIE00BMC38736 Same index family Accumulating Ireland VVSM SMH · USD −0.88 pp (6 y)

Physically replicating Irish-domiciled funds pay 15% withholding tax on US dividends under the US–Ireland tax treaty; funds domiciled in Luxembourg usually pay 30% — a structural difference that shows up in the tracking difference of funds holding US shares. "Same index family" means the European fund may cap its largest holdings harder than the US fund, as EU fund rules require, so the two can diverge when one heavyweight runs. “vs SMH, since” = the UCITS fund’s dollar line in London against SMH, total return, percentage points a year since the common start — positive means the European version returned more. Listings verified against the vendor's symbol list by ticker and ISIN. All UCITS versions · descriptive, not advice.

Closelooknet ETF read

Our dispersion engine · constituent internals

confirming up · Broad advance - breadth is rising with price. — last 21 sessions: price +9.1%, advance/decline +3.56 per name

WindowFundMedian holdingBeat / lag the fundUp / downDispersion
Day +1.0% +1.3% 16 / 9 23 / 2 1.9pp
Week +5.9% +7.2% 16 / 9 24 / 1 5.1pp
Month +9.1% +6.3% 8 / 17 22 / 3 11.8pp
Year to date +68.4% +55.2% 10 / 15 24 / 1 78.5pp

Drove the month INTC +39.4% · AMD +31.1% · MU +15.3% · NVDA +7.3% · QCOM +24.0%

Dragged the month CDNS −2.5% · AVGO −0.8% · ASML −0.1%

Computed by the Closelooknet dispersion engine from the full constituent roster (25 names, 100% of weight) · as of 2026-09-25 · full dispersion read → · methodology · descriptive, not advice.

Mentioned on Closelooknet 97 pieces · newest: Midday 10, “AI Credit — Oracle invokes force majeure on a New Mexico data center; the 30-year hits 5.45%” (2026-09-24)

Mentioned on Closelooknet

Where SMH appears in the diary — 97 pieces, newest first. Every link is our own writing.

Long reads

101 and glossary

Dailies

Weather around the name 4 macro readings: Money Temperature, Factor regime, Sector × region …

The weather around this name

Macro readings that apply by membership — the regime, the factor tape, the sector cell, the funding backdrop.

  • Money Temperature Composite 62/100 · S&P 500 fund at 67, bullish alignedEight instruments scored on position, momentum, volume, volatility and fragility — the regime every name trades inside. Temperature lab → 2026-09-25
  • Factor regime Momentum leading — risk appetite buildingMomentum against low volatility (SPMO / SPLV): above its 50-day trend, 99th percentile of the window, +8.4% over 20 sessions. Factor regime → 2026-09-25
  • Sector × region Technology in US: +3.6% week · +7.5% month · +8.5% quarter · +40.3% yearThe Sector Engine cell this name lives in, from XLK.US; the 11 × 4 matrix shows where its sector is being bought and where it is being sold. Sector Engine → 2026-09-27
  • Sovereign pressure Index 0.61 · up 0.29 over 21 sessionsG7 long-end yields, 10s30s and the slope — the funding weather for every balance sheet on this site. Sovereign pressure → 2026-09-25
How it trades on rate days beta 0.69 to TLT · on the worst bond days it fell more than the market

How it trades on rate days

How SMH has moved when long-dated Treasury yields rise — measured against TLT, the 20+ year Treasury fund.

  • Beta to long bonds, 1 year 0.69 — moves strongly with bonds for every 1% move in TLT (20+ year Treasuries), VanEck Semiconductor ETF moved 0.69% on average · correlation 0.16 · higher than 70% of US names
  • Beta, last 3 months 0.93 more rate-sensitive lately than over the year
  • On the 10 worst bond days −1.23% on average against −0.74% for the S&P 500 the 10 sessions of the past year in which TLT fell most, i.e. long yields rose most
  • Latest of those days −0.15% TLT −1.29% that day 2026-09-24

Daily total returns from the adjusted price series; a TLT down day is a day long yields rose. Beta = the average move of the name for a 1% move in TLT. Past sensitivity, not a forecast. An investment diary, not a recommendation.

Who it is priced against Semiconductor funds · 3 names with week and year-to-date

Peer group

Semiconductor funds

Curated competitor set — who the market prices this name against, not just who shares its sector.

Compared against SMH on the nightly bakes; the Peers tab ranks the cohort on the Closelooknet scores where it exists.

Dividends and capital return trailing yield 0.18%, annual · last 1.11 USD on 2025-12-22

Dividends and capital return

What SMH pays out and buys back — distributions read from the price series, money terms from the filings.

  • Trailing 12 months 1.11 USD per share · a 0.18% yield on the 2026-09-25 close 1 distribution, paid once a year 2026-09-25
  • Change on the year +3.2% against the prior twelve months prior twelve months 1.07 USD per share
  • Last distribution 1.11 USD per share as the price series records it, within days of the ex-date 2025-12-22
  • By calendar year 2023: 1.04 USD (partial) · 2024: 1.07 USD · 2025: 1.11 USD first distribution recorded in the three-year window: 2023-12-18

Per-share amounts are derived from the adjusted price series in the listing currency, so dates sit within days of the ex-date; filing figures come from the fundamentals feed for the last reported fiscal year. An investment diary, not a recommendation.

About VanEck Semiconductor ETF

VanEck Semiconductor ETF (SMH) is an exchange-traded fund that trades on US exchanges. Closelooknet tracks it as a benchmark: the dailies and the sector dispersion board quote it as a market reference, and the holdings card above matches its largest positions against the names with a Closelooknet page. It is a constituent of Closelooknet benchmark ETF set.

closelook.net is an investment research diary — market structure, index membership and scores are our own readings, not investment advice. Related: index compare · sector dispersion · scanner.

FAQ · from the current data · as of 2026-09-26

Quick answers

What is VanEck Semiconductor ETF (SMH)?

VanEck Semiconductor ETF is an exchange-traded fund trading as SMH on the US exchange (US) and is one of the benchmark ETFs Closelooknet tracks as a market reference, as of the registry build of 2026-09-26.

How does Closelooknet use SMH?

As a benchmark: the daily editions, the sector dispersion board and the index dashboards quote VanEck Semiconductor ETF as a market reference, and this page matches the fund's largest holdings against the names Closelooknet covers so a reader can move from the fund to the companies inside it.

Where does SMH trade against its moving averages?

Uptrend stack intact: Trades +7.2% vs the 50-day and +23% vs the 200-day average, 9.7% below the 52-week high and +94% off the 52-week low. Computed from daily closes. As of 2026-09-25 — a technical state from the nightly Closelooknet bake, not advice. The Technical tab carries the full row.

What does the Closelooknet dispersion engine say about SMH?

Broad advance - breadth is rising with price. (confirming up, last 21 sessions). Over 21 sessions the fund moved +9.1% while the median holding moved +6.3%; 8 of 25 holdings beat the fund and 22 rose. Against the S&P 500 fund it is +8.4pp over the same window. The top ten holdings carry 71.0% of the weight (effective N 14.9). As of 2026-09-25, computed from the full constituent roster — the full dispersion read carries the series; a descriptive reading from Closelooknet's research diary, not advice.

How does VanEck Semiconductor ETF trade when bond yields rise?

Over the past year VanEck Semiconductor ETF had a beta of 0.69 to TLT, the long-dated Treasury fund — it moves strongly with bonds, higher than 70% of US names. On the 10 sessions in which long bonds fell most it moved −1.23% on average, against −0.74% for the S&P 500. The "How it trades on rate days" block on this page carries the lines.

Where has Closelooknet written about VanEck Semiconductor ETF?

VanEck Semiconductor ETF appears in 97 Closelooknet pieces, most recently Midday 10: AI Credit — Oracle invokes force majeure on a New Mexico data center; the 30-year hits 5.45% (2026-09-24); Midday 10: Yields — the 10-year is back above 5% on a hot PMI and a hawkish Fed; chips fall, software is bought (2026-09-23); Morning 10: Nasdaq - a record close in the worst month of a midterm year, right after the bulls gave up (2026-09-22). What Closelooknet said most recently: Chips lower again: SOXX 555.97 (-1.72%), SMH (-1.59%); Broadcom $347.74 (-2.04%), SanDisk $1,763.34 (-2.93%), Nvidia $222.05 (-1.53%), Micron $1,055.45 (-1.53%), AMD $611.70 (-0.47%, just under $1 trillion) (Midday 10, 2026-09-24). The "Mentioned on Closelooknet" block on this page lists the long reads, the reference entries and the dailies that name it.

Does Closelooknet hold VanEck Semiconductor ETF?

Yes — AI Buildout: 20 shares · average entry $556.58, +9.0% unrealised. A record of what the diary does, not a recommendation to do the same.

Does VanEck Semiconductor ETF pay a dividend?

VanEck Semiconductor ETF has paid 1.11 USD per share over the last twelve months, paid once a year, a trailing yield of 0.18% on the 2026-09-25 close; the last distribution recorded in the price series was 1.11 USD on 2025-12-22. The "Dividends and capital return" block on this page carries the lines.

What does this page show?

A live price chart with SMA overlays and drawing tools for SMH, fund basics and the top holdings by weight with the Closelooknet names among them marked, the technical state where the data exists, and the research diary mentions — an investment research diary view, not investment advice.