Weekly Chart Pick · 2026-09-04
Two and a half months of lower highs, then a second low that held above the first — and on Friday the oscillator turned.
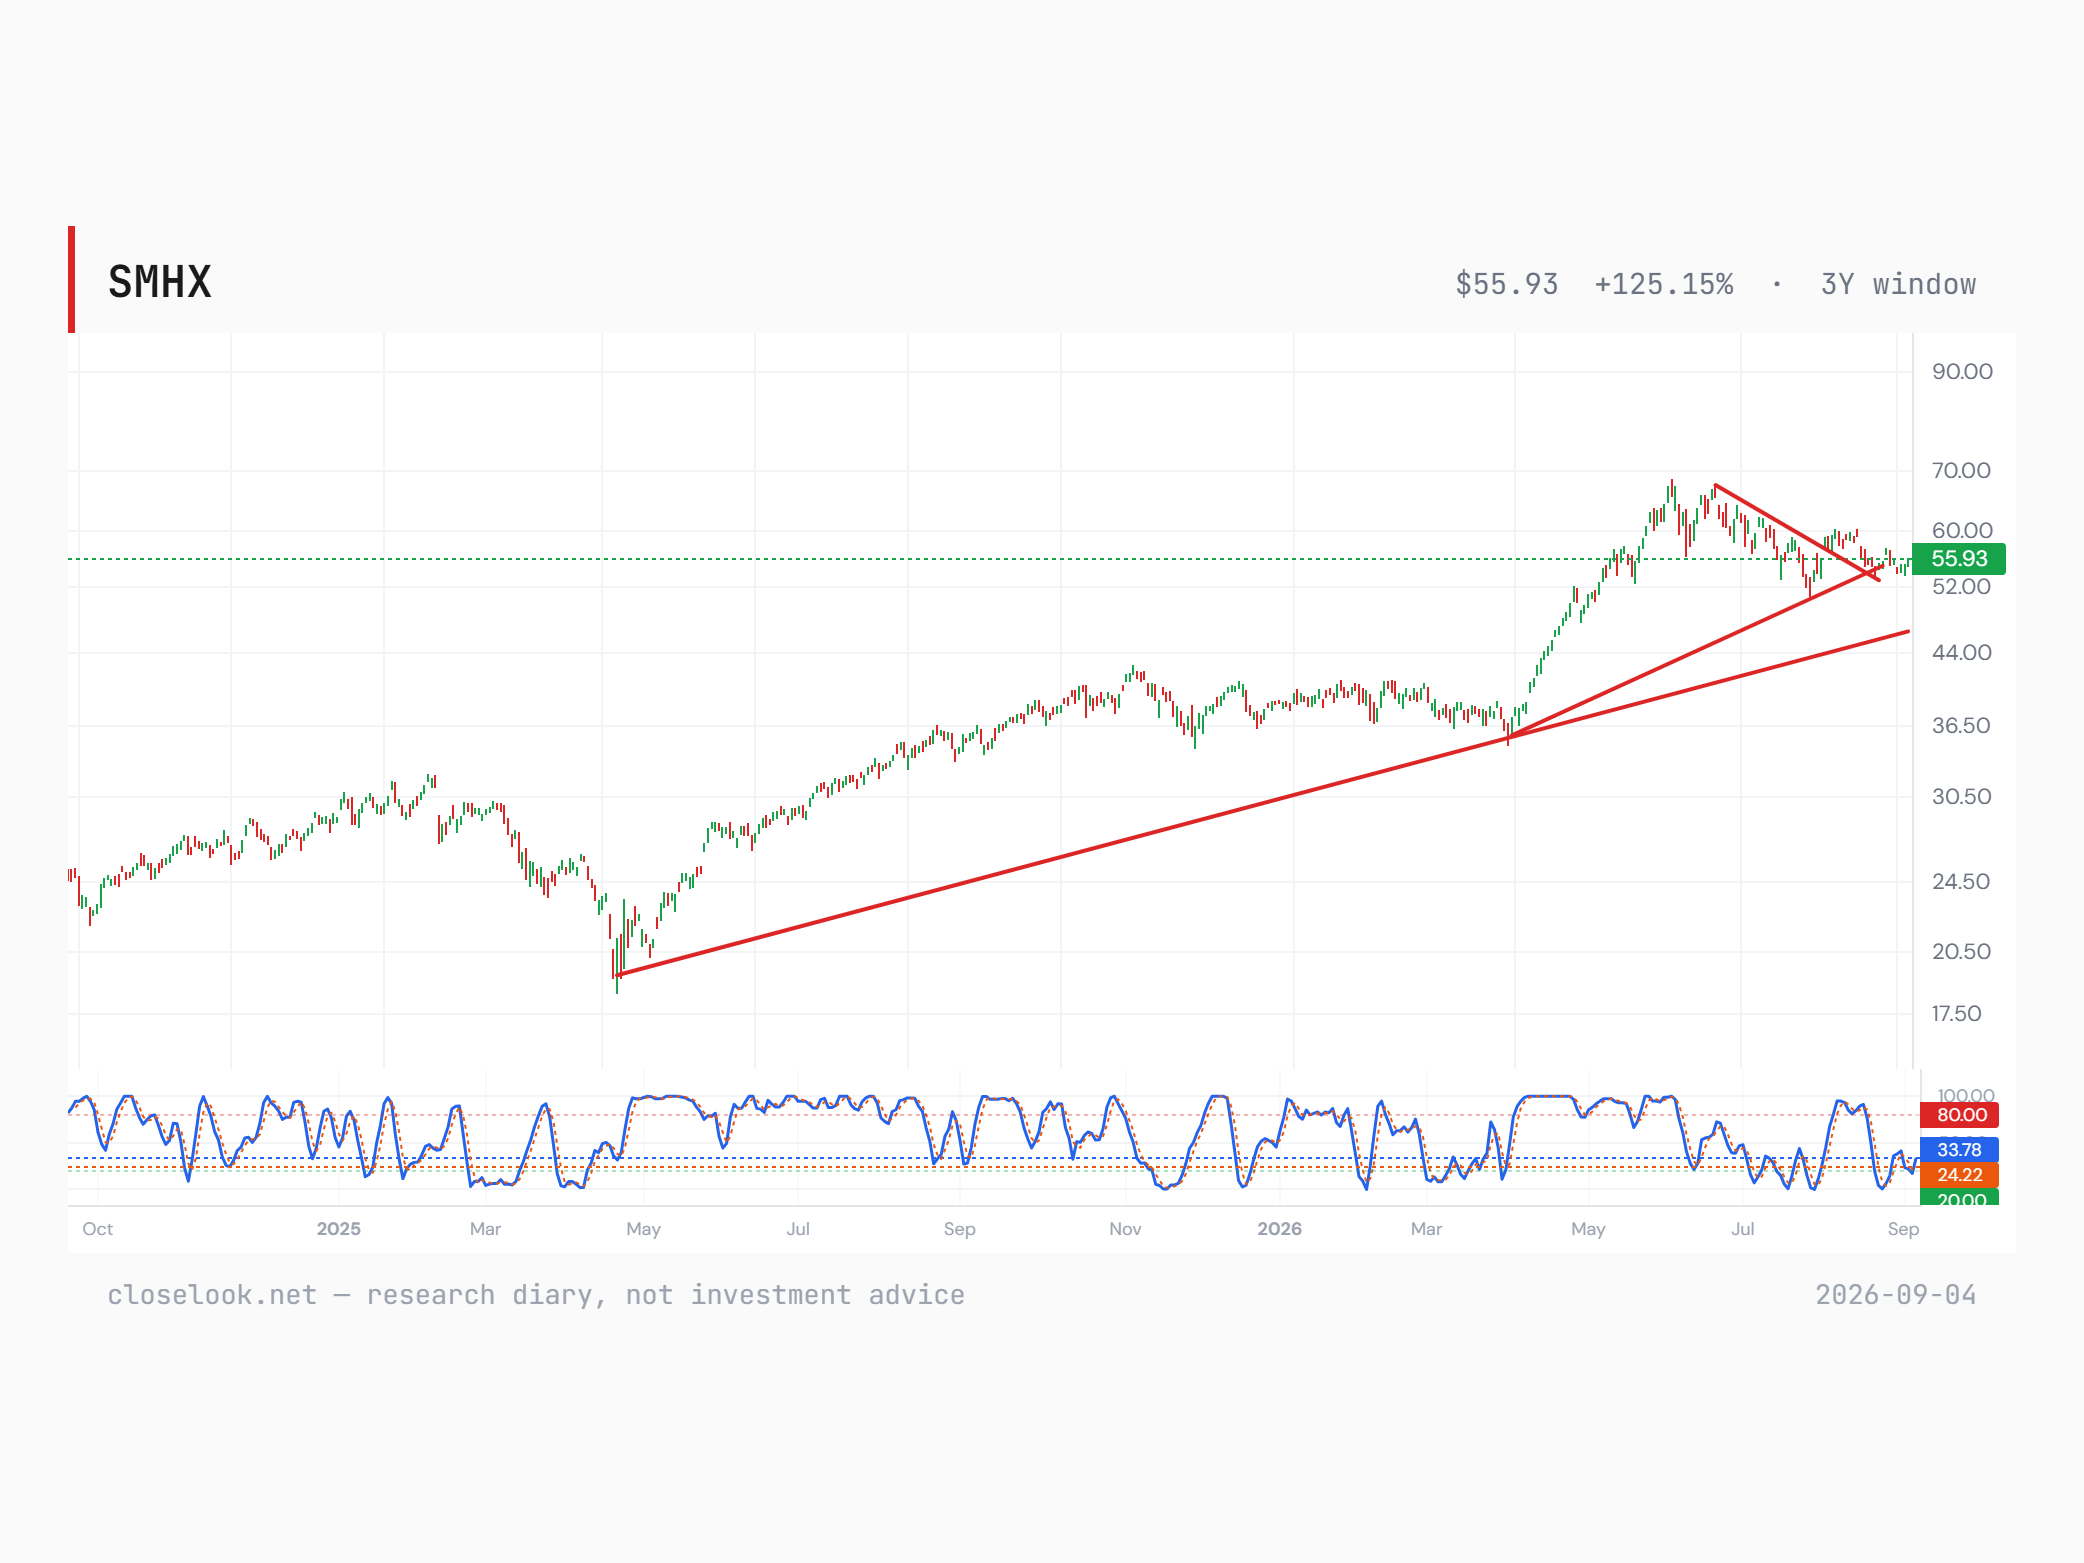
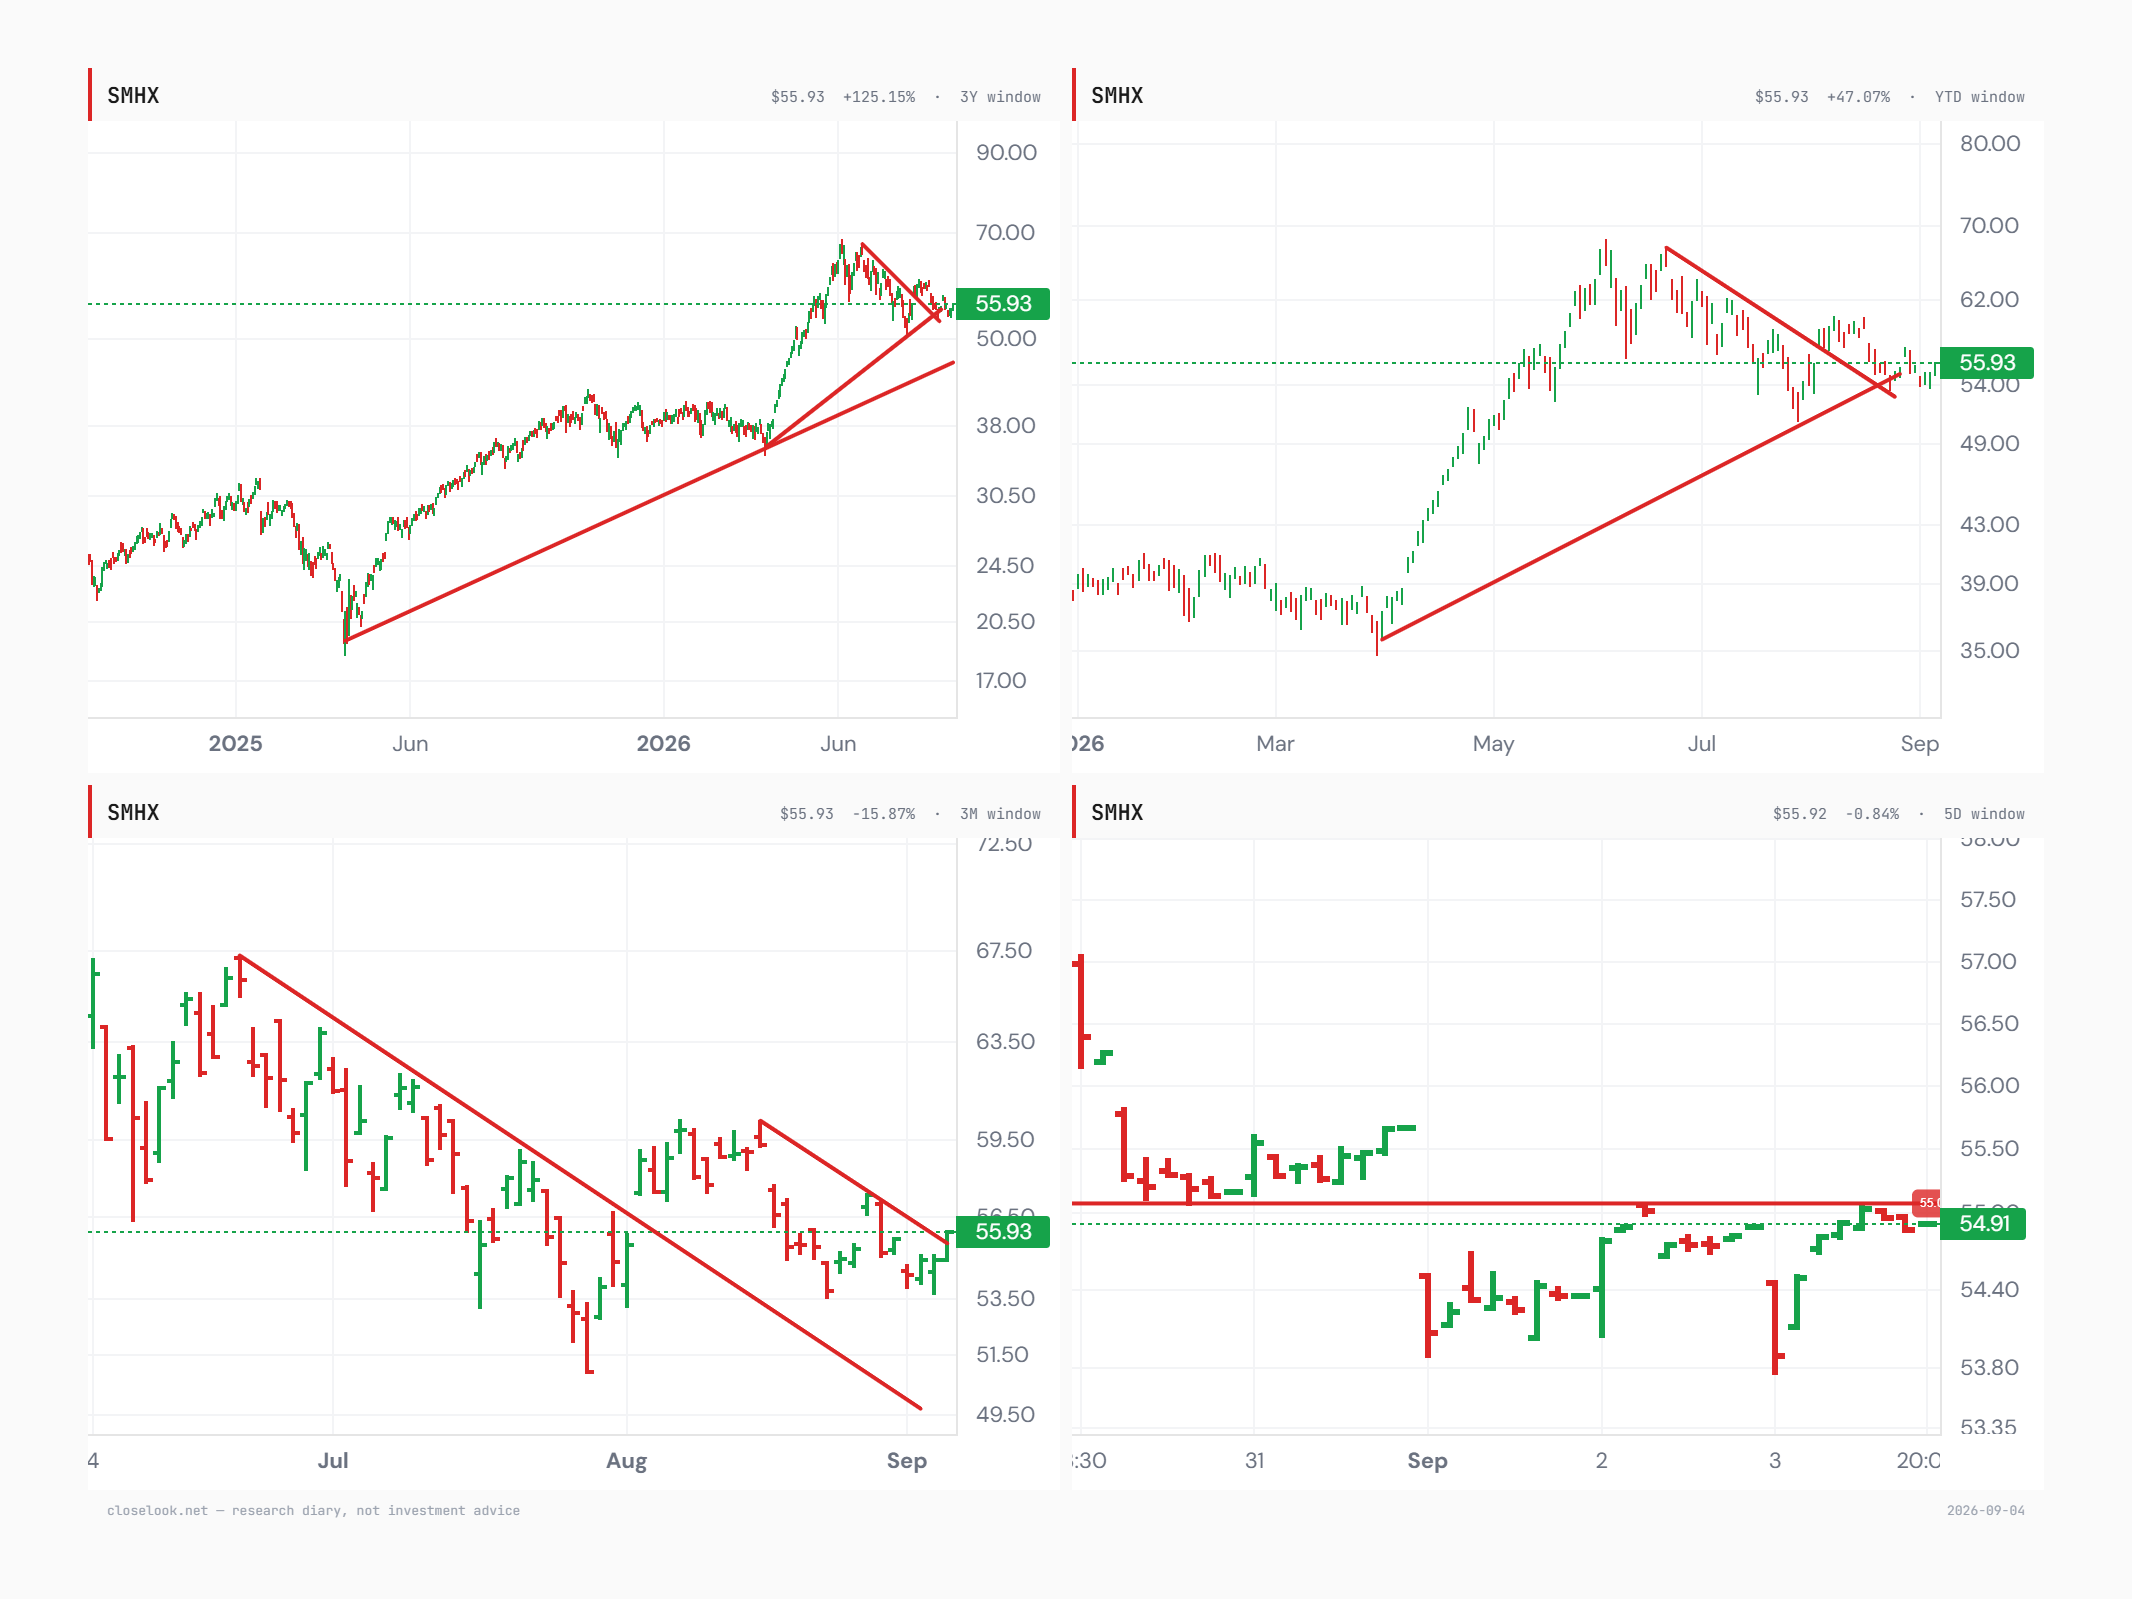
Since the top of 22 June this group has made lower highs and lower lows. That is a downtrend, not a sideways pause, and it has run for two and a half months. Two things changed on the chart this week. Price put in a second low in early September near 53.5, above the late-July low near 51.5 — a potential double bottom rather than the next leg down. And the slow stochastic, pinned at the bottom of its range through Thursday, crossed up on Friday: the configuration technicians read as a buy signal. The catalyst was the jobs report. Payrolls at nearly three times expectations say the economy is stronger than the market had assumed — and semiconductors are a cyclical business whose end demand tracks exactly that. The whole chip complex is higher on the day. Our horizon on this page is twelve months, not this session — and on that horizon we think this fund trades higher than it does today.
- The frame is a downtrend, not a pause. From the 22 June top near 68 this group has made lower highs and lower lows for two and a half months — the mid-August rally to about 60.5 failed under the line and rolled straight back over. Calling that a consolidation understates it, and it is why the lows matter.
- The potential double bottom is the first half of the turn. The correction put in one low in late July near 51.5 and a second in early September near 53.5. The second is the higher of the two. A base with a rising floor is a different object from a stair-step down, and until this week there was no second point to draw it from.
- The oscillator is the second half, and it moved on Friday. Thursday closed with the slow stochastic at 20.6 against 21.5 — K under D, both pinned at the bottom, no turn. Friday reads 33.78 against 24.22: K has crossed above D and lifted thirteen points in a single session, out of the 20 band. That crossover, from that level, is what technicians read as a buy signal on this indicator.
- The catalyst was the jobs report, and the mechanism is not complicated. Payrolls came in at 162,000 against a consensus near 53,000, with 55,000 of upward revisions on top. That says the economy is stronger than the market had assumed, and semiconductors are a cyclical business — chip demand follows industrial and consumer activity, so a stronger economy is a better order book. The whole complex is higher on the day: SOXX about 3%, SMH and XSD about 2.5%, this fund about 2%. What the same number took away from long-duration assets — gold, bitcoin, the megacap software complex — it handed to the cyclical earnings story.
- The concentration leans one way, and the breadth argument sits under it. Nvidia is 23.5% of this fund and is breaking out to new all-time highs — the heaviest weight is also the strongest chart, which is what makes a fund-level turn credible rather than cosmetic. Underneath, AMD, Astera Labs and Monolithic Power have all had long consolidations of their own, and so has Broadcom at 16.2%, even though it is the current laggard after a faultless quarter was sold for guiding to merely excellent. Those five are 53.5% of the fund and none of them is early in a correction. What is still missing is our own risk engine: fragility reads 64 out of 100, upside participation deteriorating and downside beta expanding. The 50-day near 57.44 confirms; the 200-day near 47.88 voids.
SMHX VanEck Fabless Semiconductor ETF
The Setup
The claim: a two-and-a-half-month downtrend in the chip designers has produced the three things a downtrend needs to produce before it ends — a higher low, an oscillator turn and a broken line — and all three are now on the chart.
Start by being precise about what this is, because the loose word does real damage here. This is not a consolidation in the sense of a sideways pause. From the 22 June top near 68 the group has made lower highs and lower lows: the mid-August advance to about 60.5 died under the descending line and gave the whole move back. That is a downtrend, and it has run for two and a half months. Every index page in our tracker shows the drawdown; the drawdown is not the information. The information is what has to change for a downtrend to stop being one, and this week two of those things changed at once.
Start with what the consolidation actually is. Over three months this fund is down 17.4%. Over twelve it is up 58.0%, and over six up 45.1%. It sits 19.1% under a 52-week high of 67.86 and 56.9% above a 52-week low of 35.01. It is below its 20-day average near 56.55 and its 50-day near 57.44, and 14.7% above its 200-day near 47.88. That is a specific shape: a group that doubled, then spent a quarter giving back a fifth of it without ever threatening the trend that produced the gain. Our own technical engine labels it without prompting as a pullback inside an uptrend stack.
Now the timing evidence. The slow stochastic reads 20.6 against 21.5 — the bottom of its range. That is not a prediction; it is a statement that the selling has already done most of what selling does. Consolidations end from there, or they deepen from there, and the difference is usually visible in how the group behaves on a day it should not like.
And the chart turned today rather than merely tightened. The downtrend line drawn from the 22 June top near 68 has been broken: the fund trades at 55.93 as we write, up about 1.9% on the day, above a line it spent the whole of August beneath. It broke out of a base rather than off a single low — the correction put in one low in late July near 51.5 and a second in early September near 53.5 that held above it, a double bottom with a rising floor. The oscillator moved with it: Thursday’s slow stochastic of 20.6 against 21.5, pinned at the bottom with no crossover, reads 33.78 against 24.22 on Friday, K above D and thirteen points higher in a session. Triangles resolve in the direction of the trend that built them more often than they do not, and the trend that built this one carried the fund 90% in three months.
None of that is a guarantee and a broken trendline can be given straight back. What it does mean is that the wait is over: this setup gets answered within weeks, not months, which is the only reason to write about it today rather than in October.
The catalyst was Friday’s jobs report, and it is worth being exact about why it helps rather than hurts here. The August employment report landed at 162,000 jobs against a consensus near 53,000, with July revised from a loss of 23,000 to a gain of 21,000 and June revised up as well — 55,000 of upward revisions on top of a number three times expectations. Unemployment held at 4.1% while participation rose, so the labour force grew and the hiring was absorbed. The rate market read it the obvious way: odds of a September rise jumped from about 50% back above 58%, the two-year yield spiked to 4.425%, the dollar turned higher, gold fell 1.4% towards $4,400, gold miners 1.9%, bitcoin was sold and five of the seven largest technology stocks fell.
That is the discount-rate effect, and it hits anything whose value sits in the distant future. But a jobs report is also a statement about demand, and semiconductors are a cyclical business before they are a growth story — chips go into machines, cars, phones, factories and servers, and the order book follows industrial and consumer activity. A labour market running at triple expectations says the economy is stronger than the market had assumed, and that is straightforwardly good for the people who sell chips into it.
The tape sorted itself accordingly. The Philadelphia Semiconductor Index rose more than 3%; Nvidia is breaking out to new all-time highs; Applied Materials rose 5%, Marvell, Micron, ASML and Arm about 4%, AMD and Intel 3%, Astera Labs 11%. Across the funds, SOXX is up about 3%, SMH and the equal-weight XSD about 2.5%, this fund about 2%. The Dow was roughly flat and the software ETFs were down about 2%.
That split is the observation worth paying for. The same number that raised the discount rate on long-duration assets raised the near-term earnings expectation for cyclical ones, and the market put semiconductors on the cyclical side of the line. A downtrend that has run for two and a half months does not usually end without a reason; this one now has one, and it arrived on the same session as the higher low and the oscillator turn.
Why the fabless cut rather than the whole sector. Because this week graded the layer from the inside, and the grades were not even. Nvidia spent $12.93 billion on Hugging Face, was bought for it, and is breaking out to new all-time highs — at 23.5% of the fund, the heaviest weight is also the strongest chart in it. Broadcom delivered a faultless quarter and was sold 2.7% for guiding to merely excellent; at 16.2%, it is the weak spot rather than the second engine. That asymmetry is the honest version of the bull case and its main vulnerability in one sentence: the fund is turning because its largest holding is making new highs, not because the basket has broadened. What it does not do, either way, is send money to the foundries or the equipment makers — which is precisely what this fund excludes.
There is a second-order reason, and it is the argument this page made in today’s Daily Pulse. If the model market splits into a few enormous closed frontier systems and a long, fragmenting tail of small open ones, the tail runs on inference — billions of cheap calls rather than a handful of vast training runs. The companies that design inference silicon, connectivity and power delivery for that shape are the ones in this basket. That is a slower thesis than a jobs report, and it is the reason the twelve-month view is the one that matters here.
And the horizon on this page is twelve months, which is the frame everything above should be read in. A higher low, an oscillator crossing and a broken line are entry evidence, not the thesis; they tell you the two-and-a-half-month downtrend has produced the conditions under which it usually ends, and they can all be given back inside a fortnight. The twelve-month view rests on slower things: a trend that delivered a 58% gain over the past year and still sits 14.7% above its 200-day line, an order book that its largest holding describes as supply-constrained with $279 billion of forward supply commitments booked, and a demand mix that a stronger economy helps rather than hurts. On that horizon we think this fund trades higher than it does today. It is a diary view held at a two-and-a-half-times market beta, and the levels that would change our mind are in the section below.
In the Closelooknet readings
Said plainly: SMHX is an exchange-traded fund and is not a constituent of Rubin, HALO, Euro-AI, the Agentic Winners or any other Closelook index — our index family holds companies, not funds, so there is no in-house membership to cite here. What we can cite is the overlap, and it is close to total. All ten of the fund’s largest holdings are constituents of the Rubin Build-Out 100, our index of companies monetising the physical scarcity of AI compute: Nvidia, Broadcom, AMD and Qualcomm in our S2 accelerator cohort, Marvell and Astera Labs in S14 connectivity, Synopsys, Cadence and Arm in S1 design and intellectual property, and Monolithic Power in S11 power. Qualcomm also sits in the Agentic Winners, and Arm in Euro-AI. So the fund is, in effect, a concentrated cut of our own tracker — the design layer of it, with the foundries and the equipment makers removed. Last week’s Chart Pick, Synopsys, is holding number six here at 4.44%.
The latest print
A fund has no earnings of its own, so the honest version of this section is the earnings its holdings just delivered — and the past ten days handed this basket an unusually complete set.
Broadcom, 16.15% of the fund, reported on 2 September and beat on every line: $3.32 a share against $3.22, revenue of $29.59 billion against $29.24 billion, AI semiconductor revenue of $16.7 billion against its own $16 billion target, up 221% from a year earlier. The stock fell 6.8% at Thursday’s low and closed down 2.7% at $357.16, because the guide for the current quarter came in at about $34.8 billion — above one consensus and below another. Only when the call put AI revenue at $115 billion for fiscal 2027 and $230 billion for 2028 did the selling stop.
Synopsys, 4.44%, reported on 26 August above the high end of its own guidance and was met with an after-hours shrug, then repriced up 13.4% in daylight — the flip we wrote about in last week’s edition.
Nvidia, 23.56%, is between prints: its most recent quarter, reported 26 August, put revenue at $96 billion, more than double a year earlier, with data-centre revenue of $89 billion and a 75% gross margin, and guided the current quarter to about $108 billion. It also disclosed supply and capacity commitments of $279 billion, up from $119 billion three months before. On Thursday it agreed to buy Hugging Face for $12.93 billion; on Friday it traded near an all-time high.
The pattern across the basket is the one that defined the whole week: the market is not paying for beats. It is paying for growth that accelerates, and it is punishing anything that merely met a price already paid.
The fundamentals
What the mandate actually does. The fund tracks the MarketVector US Listed Fabless Semiconductor Index and holds roughly 22 names for a 0.35% annual fee. Fabless means the company designs and sells chips and owns no factory. The consequence is not cosmetic: the design layer keeps the intellectual property and the margin, while the capital burden of a fabrication plant — tens of billions per node, depreciating on a fixed schedule whether or not demand shows up — sits on someone else’s balance sheet.
The exclusions define it as much as the holdings. Intel is not in this fund and cannot be, because it owns fabs — a mandate that cost the fund Intel’s run this year and is the clearest illustration that this is a rule, not a view. Taiwan Semiconductor is absent as a foundry, ASML and Applied Materials as equipment makers. What is left is the layer that draws the chip and captures the price.
The concentration, and which way it leans. Nvidia at 23.56% and Broadcom at 16.15% are 39.71% of the fund between them, and the top ten come to 74.98% — AMD 5.53%, Qualcomm 4.77%, Marvell 4.53%, Synopsys 4.44%, Astera Labs 4.14%, Monolithic Power 4.10%, Cadence 4.00%, Arm 3.76%. Anyone buying this is buying two decisions with a diversified wrapper, and should say so out loud before buying it.
The two are not in the same condition, and the difference is instructive. Nvidia, the largest weight by a distance, is breaking out to new all-time highs — the heaviest position in the basket is also its strongest chart, which is why a fund-level turn is not merely an average of weak things. Broadcom is the current laggard: it reported a faultless quarter on 2 September, beat on every line, and was sold 2.7% because a $34.8 billion guide only met the price the market had already paid, closing Thursday at $357.16, a dollar above the level that would grade its earnings window as a loss.
But laggard is not the same as broken, and the breadth underneath is the part that decides whether this is one stock or a group. AMD, Astera Labs and Monolithic Power have each spent months in consolidations of their own, and so has Broadcom — none of the large weights is early in a correction, and several are further through one than the fund average suggests. Nvidia, Broadcom, AMD, Astera Labs and Monolithic Power together are 53.5% of the basket. A turn that rests on one of them is fragile; a turn where the other four have already done their time underneath is a different proposition, and that is the one on offer here.
Scale and age. The fund launched on 27 August 2024 and reported net assets of about $152 million at the end of March 2026, growing past $200 million by late April, with portfolio turnover of 5% — it holds what it holds. That size makes it a thematic expression rather than a liquidity venue, next to $58 billion in the broad VanEck semiconductor fund and $29 billion in the iShares one.
The dependency nobody escapes. Owning no factories means every name in here has its silicon made somewhere, and overwhelmingly that somewhere is Taiwan. The fabless model exports the capital risk and concentrates the geographic one.
The chart, read by hand
Trend: Three lines, a broken one and a base. The first is a rising trendline off the May 2025 low near 19 — the secular line, far below price, never revisited, intact and not in play. The second is steeper, drawn from the spring 2026 low near 36, and arrives at roughly 54 now. The third descends from the top of 22 June near 68. That descending line is the one that matters today, because price has gone through it: after spending August underneath, the fund trades at 55.93 above the line rather than against it. What it broke out of is a base, not a single low. The correction put in one low in late July near 51.5 and a second in early September near 53.5, and the second is the higher of the two — a double bottom with a rising floor rather than a retest of the same level. The moving-average stack has not caught up yet and says so honestly: still below the 20-day near 56.55 and the 50-day near 57.44, but 14.7% above the 200-day near 47.88. The trendline break is the first event; the 50-day at 57.44 is the confirmation; the 200-day near 47.88, some 14% lower, is where the whole reading would be void.
Oscillators: This is the number that changed today. Thursday closed with the slow stochastic at 20.6 against 21.5 — K under D, both pinned at the bottom of the range, no turn. Friday has it at 33.78 against 24.22: K has crossed above D and lifted more than thirteen points in a single session, out of the 20 band. A crossover from that level is the oscillator signature of a correction ending, and it arrived on the same day price came up to the trendline. That is the whole case in one panel. The counterweight comes from the other machine and it has not moved: our convexity engine still reads fragility at 64 out of 100 in the red, instability 52, upside participation deteriorating sharply and downside beta expanding sharply, against a still-positive asymmetry of +0.34 (up-beta 2.51, down-beta 2.16, participation 1.16). Price and momentum have turned; the risk internals have not yet followed. Both readings are on the table, and the second is the one that has to catch up.
Elliott Wave count: The usable frame, and we will not dress it up as a formal count on a fund with two years of price history. An impulsive advance ran from the spring 2026 low near 36 to the 22 June top near 68 — roughly 90% in about three months. What followed is corrective rather than impulsive, and it has the shape of a completed correction rather than an open one: a first low in late July near 51.5, a second in early September near 53.5 that held above it, and a downtrend line off the June top that price has now broken. A higher second low plus a broken downtrend is the ordinary way a correction inside an uptrend ends. That is a probability statement, not a count, and the levels do the work the label cannot: the reading needs the 50-day at 57.44 to confirm and is void on a loss of the 200-day near 47.88.
Key levels: 67.86 — the 52-week high, the level the whole correction is measured from · 57.44 — the 50-day average; a close above turns the medium-term read constructive · 56.55 — the 20-day average, the nearest overhead line · 55.93 — Friday’s price, back above the downtrend line drawn from the 22 June top · 54.91 — Thursday’s close, the reference the machine block is built on · 47.88 — the 200-day average, some 14% lower; the line between a correction and a break · 35.01 — the 52-week low, 60% below current price
The risks, equal billing
The internals do not confirm the price, and we are not going to pretend otherwise. Our convexity engine reads this fund as of Thursday with a fragility score of 64 out of 100 — in the red band — and an instability score of 52. Its state line is blunt: upside participation deteriorating, sharply, and downside beta expanding, sharply. The asymmetry is still positive at +0.34, with an up-beta of 2.51 against a down-beta of 2.16 and participation of 1.16, so the fund has historically captured more of the market’s advances than of its declines. But the recent direction of those two numbers is the wrong one, and it is exactly what you would expect from a group in a drawdown. A consolidation that is ending should show that trend reversing. It has not yet.
This is a 2.5-times-market instrument. Aggregate beta against the S&P 500 reads 2.57 over 126 days, rising from 2.06 on a 21-day window to 2.45 on a 252-day one. Whatever the market does, this does roughly two and a half times as much of it, in both directions. That is a position size question before it is a view question, and nobody should hold this the way they hold an index fund.
One session is not a trend. Friday is a single day and it is not yet closed as we write. A stochastic at 20 can go to 10. The 50-day at about 57.44 is the first thing a genuine turn has to reclaim, and until it does, this remains a correction that has merely paused.
The rate path just got harder, not easier. A jobs number at triple expectations with unemployment steady at 4.1% and participation rising puts a September rate rise back in play, and next Friday’s inflation report decides it. High-multiple growth is the part of the market that dislikes that most. The chip complex ignored it for one session; there is no rule that says it ignores it for a second.
Concentration cuts both ways, and today it cuts in our favour — which is its own risk. Forty percent of this fund is two stocks, and the bullish read above leans on the larger of them: Nvidia at 23.5% breaking out to new highs is doing a great deal of the work in the fund-level chart. If that breakout fails, the other names have to carry it, and while AMD, Astera Labs, Monolithic Power and Broadcom have all consolidated long enough to be capable of it, none of them has yet done it. Capable is not the same as underway. And Broadcom at sixteen percent is currently the laggard rather than the support — a stock the market has just declined to pay for on a quarter it could not fault.
And every name in here depends on Taiwan for manufacture. The fabless model exports capital risk and concentrates geographic risk, and that concentration is not diversifiable inside this wrapper.
Our forecasts
12 months from now: Higher, in our view. The trend that produced a 58% twelve-month gain is intact and 14.7% above its 200-day line; the correction has cost a fifth of the advance without threatening it; and the demand behind it is supply-constrained rather than demand-constrained, on the largest holding’s own disclosure of $279 billion in forward supply commitments. Add the structural argument from today’s Daily Pulse — that the model market is splitting into a few closed frontier systems and a long tail of small open ones, and that the tail runs on inference silicon, connectivity and power delivery — and the design layer is where that shows up. This is a diary view at a two-and-a-half-times market beta, not a recommendation, and it does not set an entry price.
The next few weeks: Undecided, and deliberately so. The price setup says late consolidation and Friday gave it its first real piece of supporting evidence; the convexity engine says the internals deteriorated on the way down and have not repaired. The 50-day near 57.44 is the level that would settle the argument in one direction, and next Friday’s inflation report is the event most likely to settle it in the other. We would rather hold both readings in view than resolve them early.
Diary views, not advice — held publicly alongside the scored record.
Why publish this name? Because our Directional Flow readings are what let us say it: stocks with this or a similar setup have often — historically — done well over the following twelve months. That is the engine's backtested observation about the past, not a forecast; past performance may not be an indication of future performance. Which is exactly why every pick is scored publicly against the tape from today, at one week, one month, three, six and twelve. Twelve months. A diary view, not advice, and not an entry price.
Closelooknet publishes an investment research diary, not investment advice. Every pick is scored publicly against the tape at 1w/1m/3m/6m/12m from publication — the record, not the single call, is the product.
Open the live SMHX terminal → All picks & the running record →
A note from the editor: the Weekly Chart Pick is free. Its price is one click — add Closelooknet as a preferred source on Google, and you support this work in Google Discover and Search every time you read.
Google opened in a new tab. Add Closelooknet there, then come back to this tab — the Chart Pick unlocks the moment you return.
The preferred-source setting lives in your Google account — if Google asks you to sign in first, you will land on the selection page right after. Google does not tell us whether you saved the selection. Clicking “Done” unlocks the Weekly Chart Pick on this device for 12 months.