What is SPDR® S&P Semiconductor ETF (XSD)?
SPDR® S&P Semiconductor ETF is an exchange-traded fund trading as XSD on the US exchange (US) and is one of the benchmark ETFs Closelooknet tracks as a market reference, as of the registry build of 2026-10-31.
How does Closelooknet use XSD?
As a benchmark: the daily editions, the sector dispersion board and the index dashboards quote SPDR® S&P Semiconductor ETF as a market reference, and this page matches the fund's largest holdings against the names Closelooknet covers so a reader can move from the fund to the companies inside it.
Where does XSD trade against its moving averages?
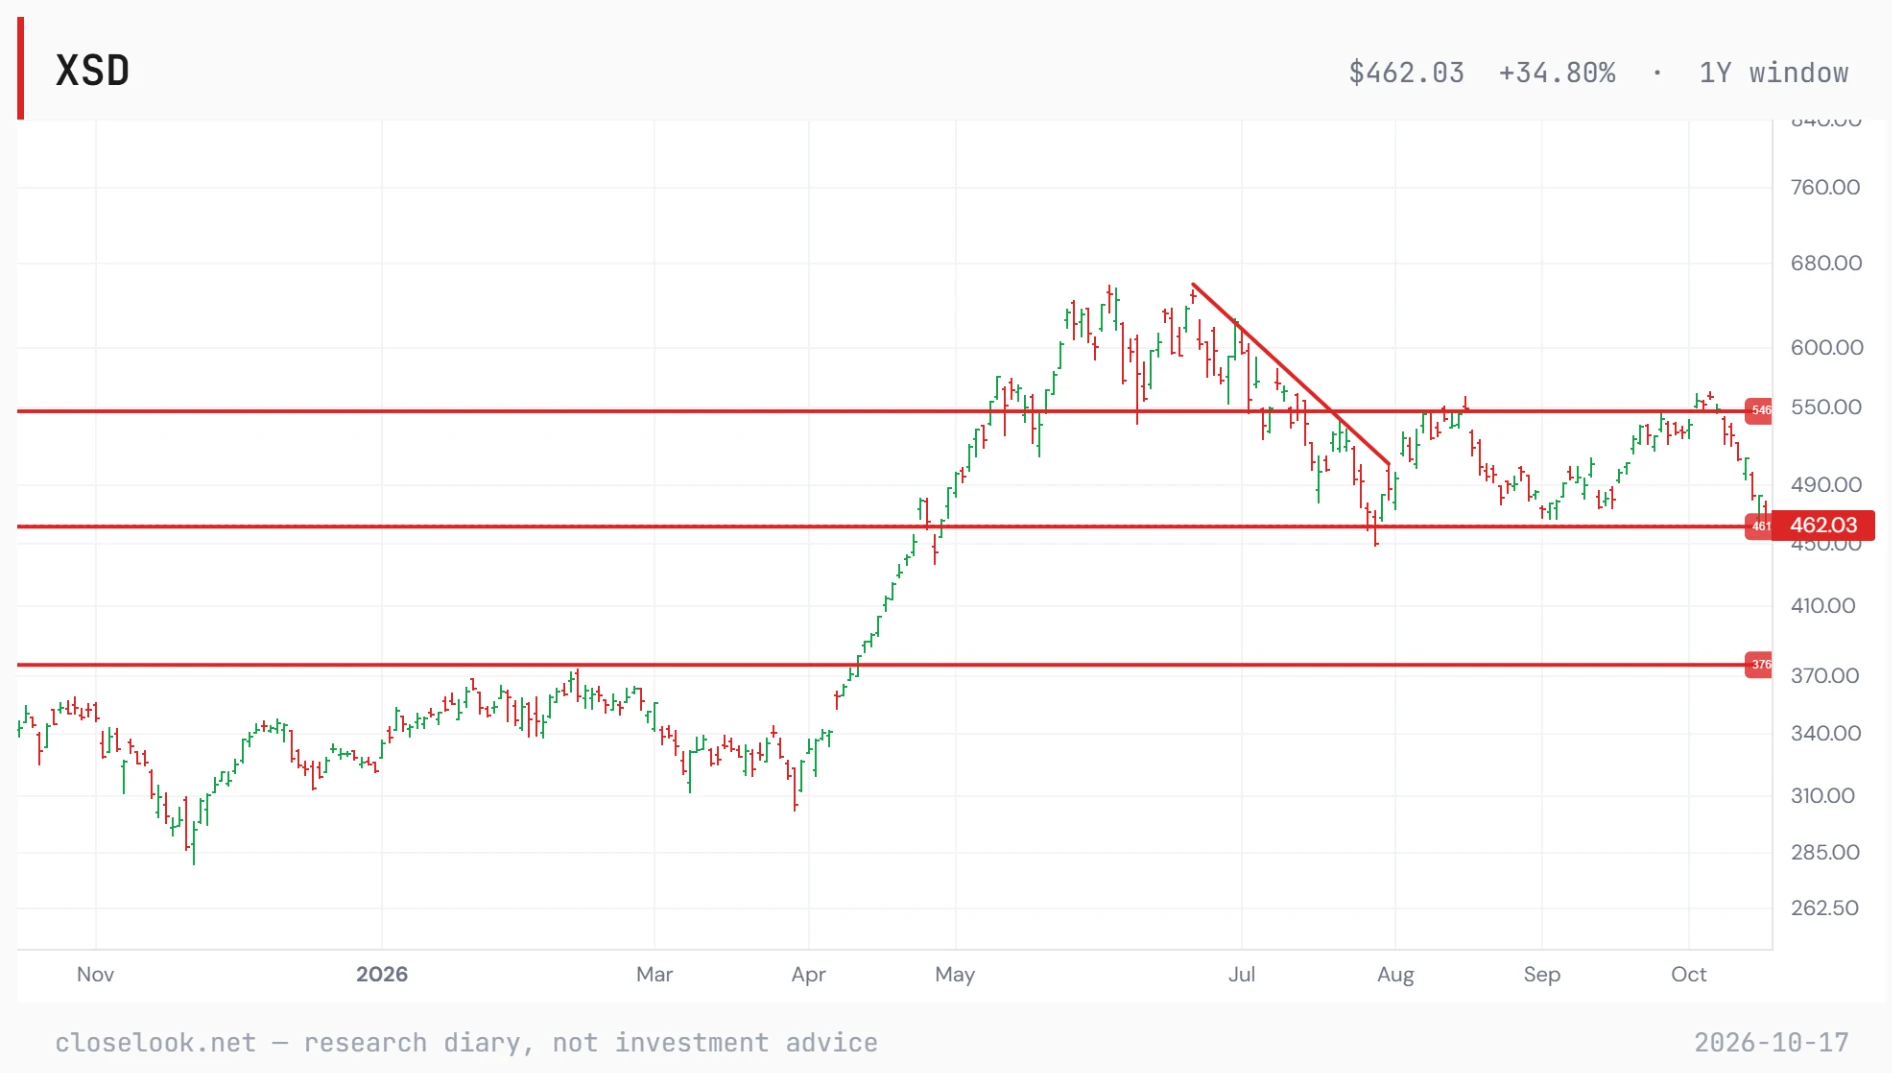
SPDR® S&P Semiconductor ETF trades 9.5% below its 50-day and 4.1% below its 200-day moving average (8.3% below its 20-day). As of 2026-10-30 — a technical state from the nightly Closelooknet bake, not advice. The Technical tab carries the full row.
What does the Closelooknet dispersion engine say about XSD?
Broad decline - breadth is falling with price. (confirming down, last 21 sessions). Over 21 sessions the fund moved −15.7% while the median holding moved −16.1%; 21 of 43 holdings beat the fund and 8 rose. Against the S&P 500 fund it is −14.6pp over the same window. The top ten holdings carry 39.1% of the weight (effective N 35.0). As of 2026-10-30, computed from the full constituent roster — the full dispersion read carries the series; a descriptive reading from Closelooknet's research diary, not advice.
How does SPDR® S&P Semiconductor ETF compare with its peers?
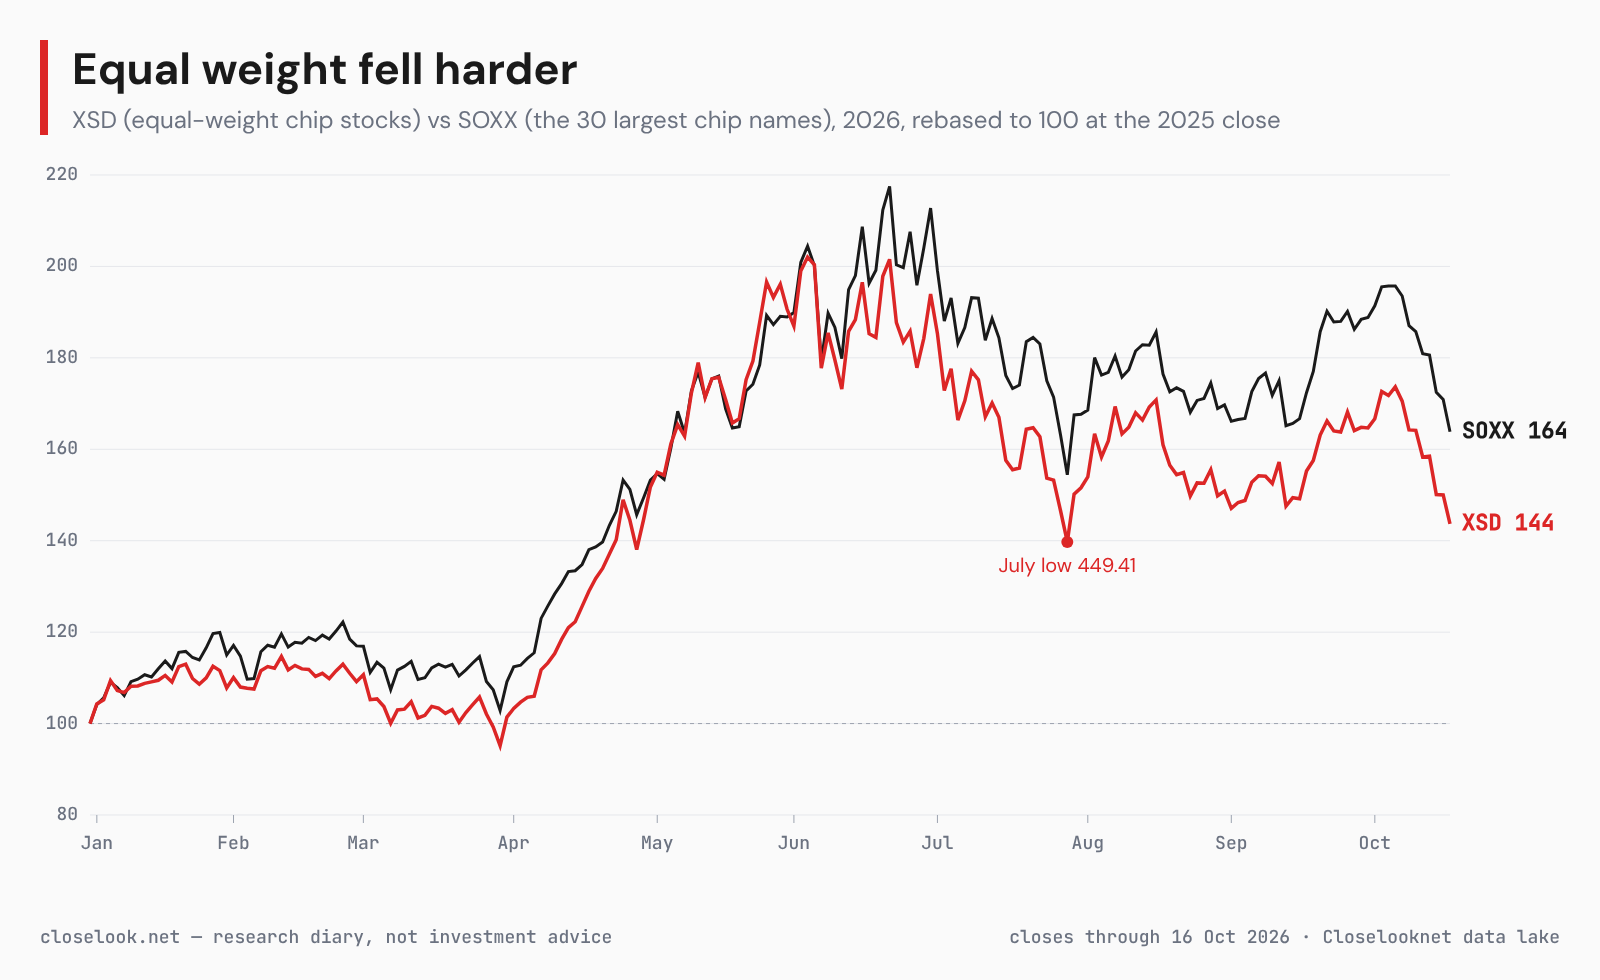
Against its peer group (Semiconductor funds), SPDR® S&P Semiconductor ETF (XSD) sits 31.3% below its 52-week high, 9.5% below its 50-day average; iShares Semiconductor ETF (SOXX) is 28.1% below, VanEck Semiconductor ETF (SMH) is 22.2% below, Invesco QQQ Trust (QQQ) is 9.5% below, as of 2026-10-30. Put any of them next to XSD in the chart grid (2×1 or 2×2) and the page lays the companies side by side: performance, trend, valuation, margins and our money-flow reading.
How does SPDR® S&P Semiconductor ETF trade when bond yields rise?
Over the past year SPDR® S&P Semiconductor ETF had a beta of 0.44 to TLT, the long-dated Treasury fund — it shows only a loose link to bond moves, higher than 37% of US names. On the 10 sessions in which long bonds fell most it moved −0.83% on average, against −0.74% for the S&P 500. As of 2026-10-30; The "How it trades on rate days" block on this page carries the lines.
Where has Closelooknet written about SPDR® S&P Semiconductor ETF?
SPDR® S&P Semiconductor ETF appears in 60 Closelooknet pieces as of 2026-10-31, most recently Weekly Signal: Calendar — The Funds’ New Year and the Midterms: a Fresh Start? (2026-11-01); Morning 10: Big Tech — Microsoft up 2.9%, Alphabet down 10%, ServiceNow down 18% after hours; Marvell eyes Lumentum (2026-10-29); Midday 10: Earnings Tape — Alphabet −13%, ServiceNow −27%, Microsoft's gain gone, Lilly +6% (2026-10-29). What Closelooknet said most recently: The chip ETFs led Wednesday: SOXX up 2.13%, SMH up 1.74%, XSD up 0.94%.
(Morning 10, 2026-10-29). The "Mentioned on Closelooknet" block on this page lists the long reads, the reference entries and the dailies that name it.
What does SPDR® S&P Semiconductor ETF do?
XSD tracks the S&P Semiconductor Select Industry Index, using a sampling method rather than holding every name in it. That index draws its list from the semiconductor slice of the broader S&P total-market index, and weights holdings roughly equally rather than by size. The fund gives exposure across chip designers, equipment makers and fabrication firms as a group, instead of concentrating in the largest names. Closelooknet's peer group here is other semiconductor funds — iShares Semiconductor ETF and VanEck Semiconductor ETF — the natural comparison since all three track the same sector by different construction rules. The diary also sets it against Invesco QQQ Trust when the question is broader tech exposure rather than semis alone. (Company snapshot of 2026-09-17.)
Where does SPDR® S&P Semiconductor ETF sit in the AI build-out?
XSD carries no seat in Rubin, Closelooknet's AI build-out index, because it is a fund rather than a single operating company. It sits in our semiconductor sector sleeve, offering broad, equal-weighted exposure across design, equipment and fabrication rather than to any one layer of the build-out. XSD holds no Closelooknet index seat and carries no Closelooknet score, since it is a fund rather than a company we score. The diary returns to it often in weekly signals and chart picks, using it as the equal-weight read against cap-weighted semiconductor funds when the sector moves. (Company snapshot of 2026-09-17.)
Does SPDR® S&P Semiconductor ETF pay a dividend?
No cash distribution shows in SPDR® S&P Semiconductor ETF’s price series over the last twelve months. As of 2026-10-30; the "Dividends and capital return" block on this page carries the lines.
What does this page show?
A live price chart with SMA overlays and drawing tools for XSD, fund basics and the top holdings by weight with the Closelooknet names among them marked, the technical state where the data exists, and the research diary mentions — an investment research diary view, not investment advice.