Weekly Signal · · 7 min read
The Tape Split in Two
Software week, semi wreck — the tape split in two, and the calendar behind it raises the stakes.
5 July 2026 · closes through Jul 2 — U.S. markets were closed Jul 3–4.
What the week actually did
The headline indices hid the real story. The S&P 500 added +2.2% and the equal-weight version matched it (RSP +2.2%) — participation was broad. The Dow gained +2.0%, the Nasdaq Composite +2.3%. But the Nasdaq-100 made only +0.9%, and small caps fell (IWM −0.7%). An up week for almost everything — except the two ends of the barbell where this site lives.
| Sector (SPDR) | Week |
|---|---|
| Financials (XLF) | +3.8% |
| Communications (XLC) | +3.2% |
| Discretionary (XLY) | +2.4% |
| Health Care (XLV) | +2.1% |
| Industrials (XLI) | +1.5% |
| Materials (XLB) | +0.8% |
| Staples (XLP) | +0.3% |
| Technology (XLK) | −0.3% |
| Utilities (XLU) | −1.0% |
| Energy (XLE) | −1.1% |
| Real Estate (XLRE) | −1.2% |
Ten weeks out of ten this ordering would read "risk-on rotation": banks and communications on top, bond proxies at the bottom — consistent with TLT −2.1% (yields up), which also explains utilities and real estate at the tail. The anomaly is technology printing red in a +2% market week.
The Nasdaq cuts we track sharpen it:
| Cut | Week |
|---|---|
| Top 20 US (TOPT) | +2.6% |
| N100 ex-Tech (QQXT) | +2.2% |
| N100 equal weight (QQQE) | +1.2% |
| N100 Top 30 (QTOP) | +1.0% |
| N100 Tech (QTEC) | −0.4% |
Read it bottom-up: inside the Nasdaq-100, everything that is not technology had a strong week; equal weight beat the top-30, so breadth improved within the index; and the mega-cap complex itself was fine — as long as it wasn't a semiconductor. The drag is not "big tech". It is specifically chips.
Elsewhere: Bitcoin +4.5% through the weekend, Europe strong (FEZ +2.8%), gold +1.2%, the dollar slightly soft (−0.4%), China and Japan quiet. And the one that matters for framing: volatility fell (VIXY −6.2%). A violent rotation with a falling VIX is repositioning, not de-risking — nobody paid up for protection while it happened.
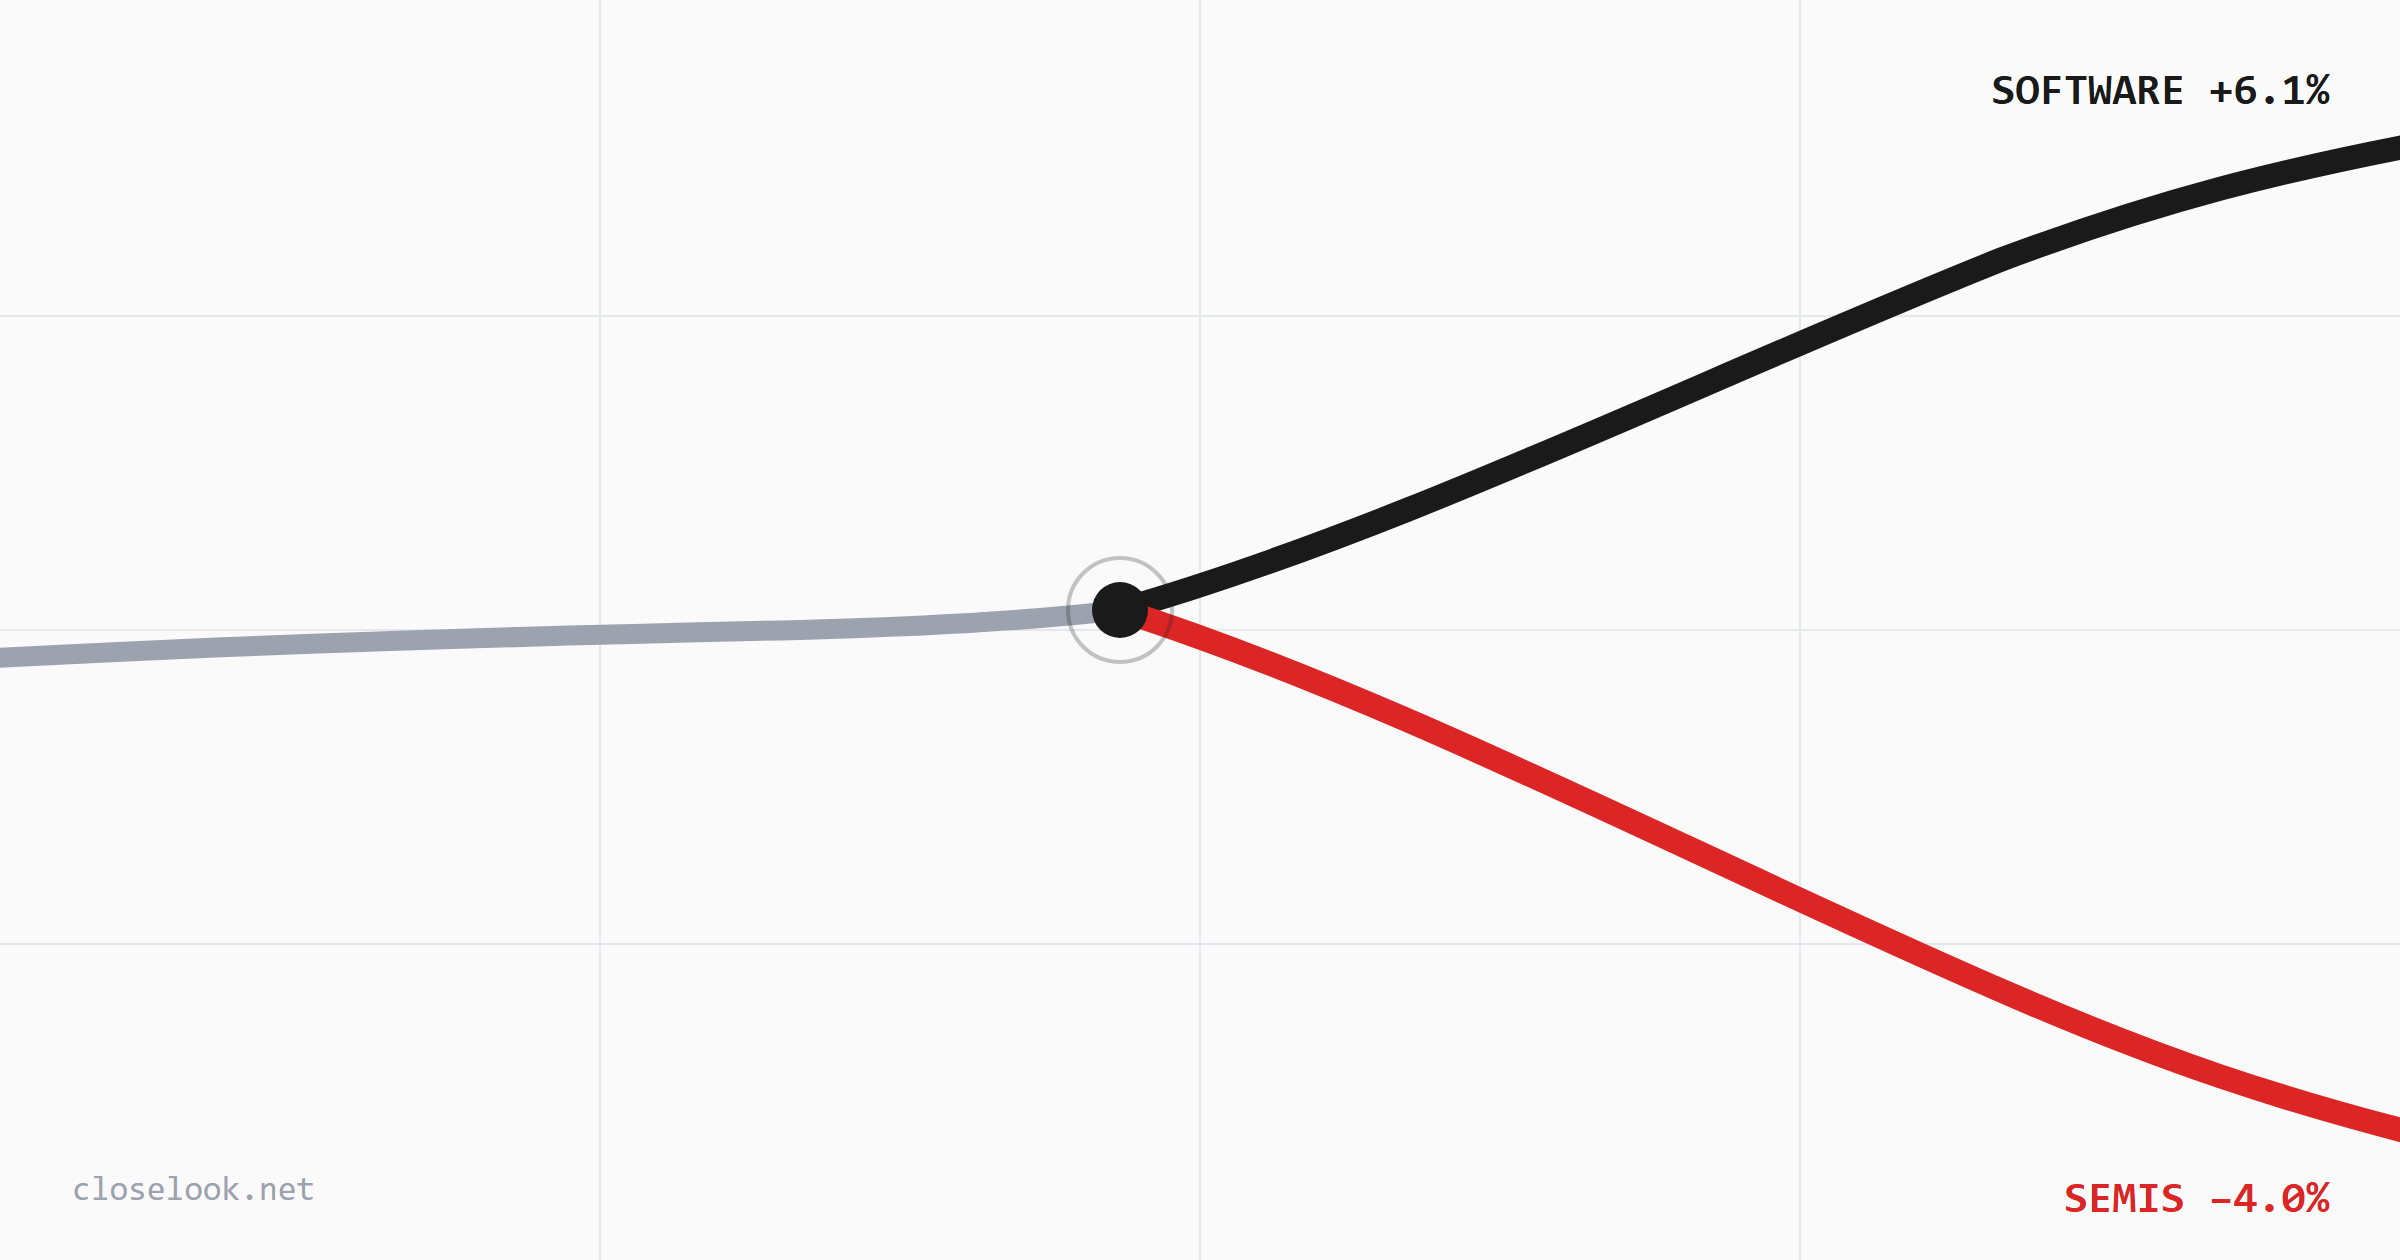
Inside tech: software week, semi wreck
The tech ETF shelf split down the middle:
| ETF | Week |
|---|---|
| Software (IGV) | +6.1% |
| Cloud (CLOU) | +4.9% |
| Fabless (SMHX) | −1.9% |
| Small-cap semis (XSD) | −2.8% |
| Semis (SMH) | −3.2% |
| Semis (SOXX) | −4.0% |
A ten-point weekly gap between software and semiconductors is the widest software-over-semis spread since early March. And the path matters as much as the close: SOXX was up +8.6% on the week at Tuesday's high — then gave back −11.6% in two sessions into the holiday close. Equipment and memory did the damage: Teradyne −13.6%, Lam −10.2%, Applied −7.4% on July 2 alone. The memory complex was the epicenter — our Rubin memory sub-index lost −9.6% on the week, storage −12.0%; Micron −5.5%, Seagate −10.4%, Western Digital −9.9% in the Thursday session.
Small-cap semis (XSD −2.8%) held up better than the equipment-heavy benchmarks — the selling concentrated where the AI-capex sensitivity is highest. Worth keeping in view for the outlook below.
The Closelook universe: the barbell opened wide
The four functional indices told the same story with more resolution (weekly, equal weight):
| Index | Week |
|---|---|
| AW40 — agentic winners | +7.7% |
| HALO — functional growth | +5.0% |
| Agentic Ecosystem | +4.0% |
| Rubin — AI build-out | −1.1% |
One thesis, four indices — and this week the deployment side and the build-out side went opposite directions by almost nine points.
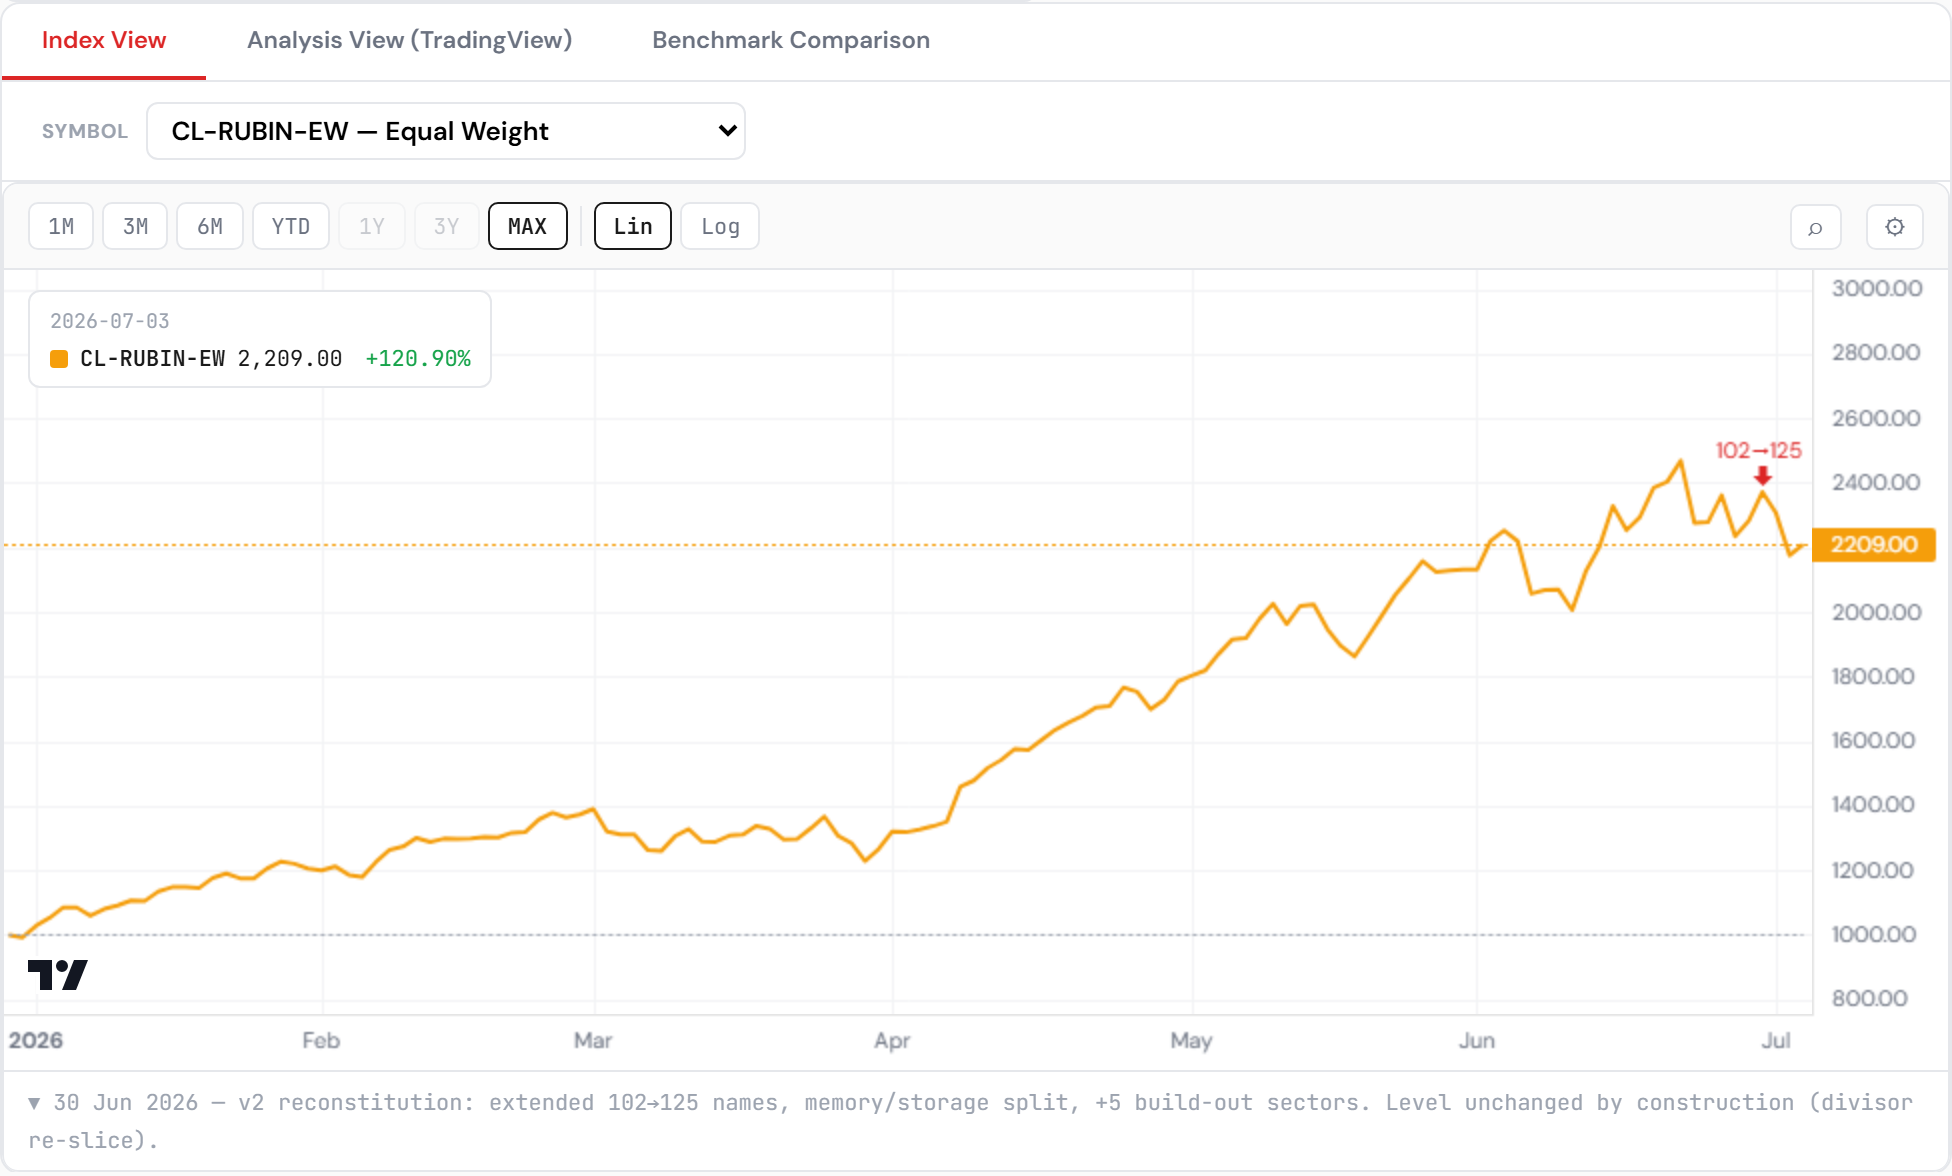
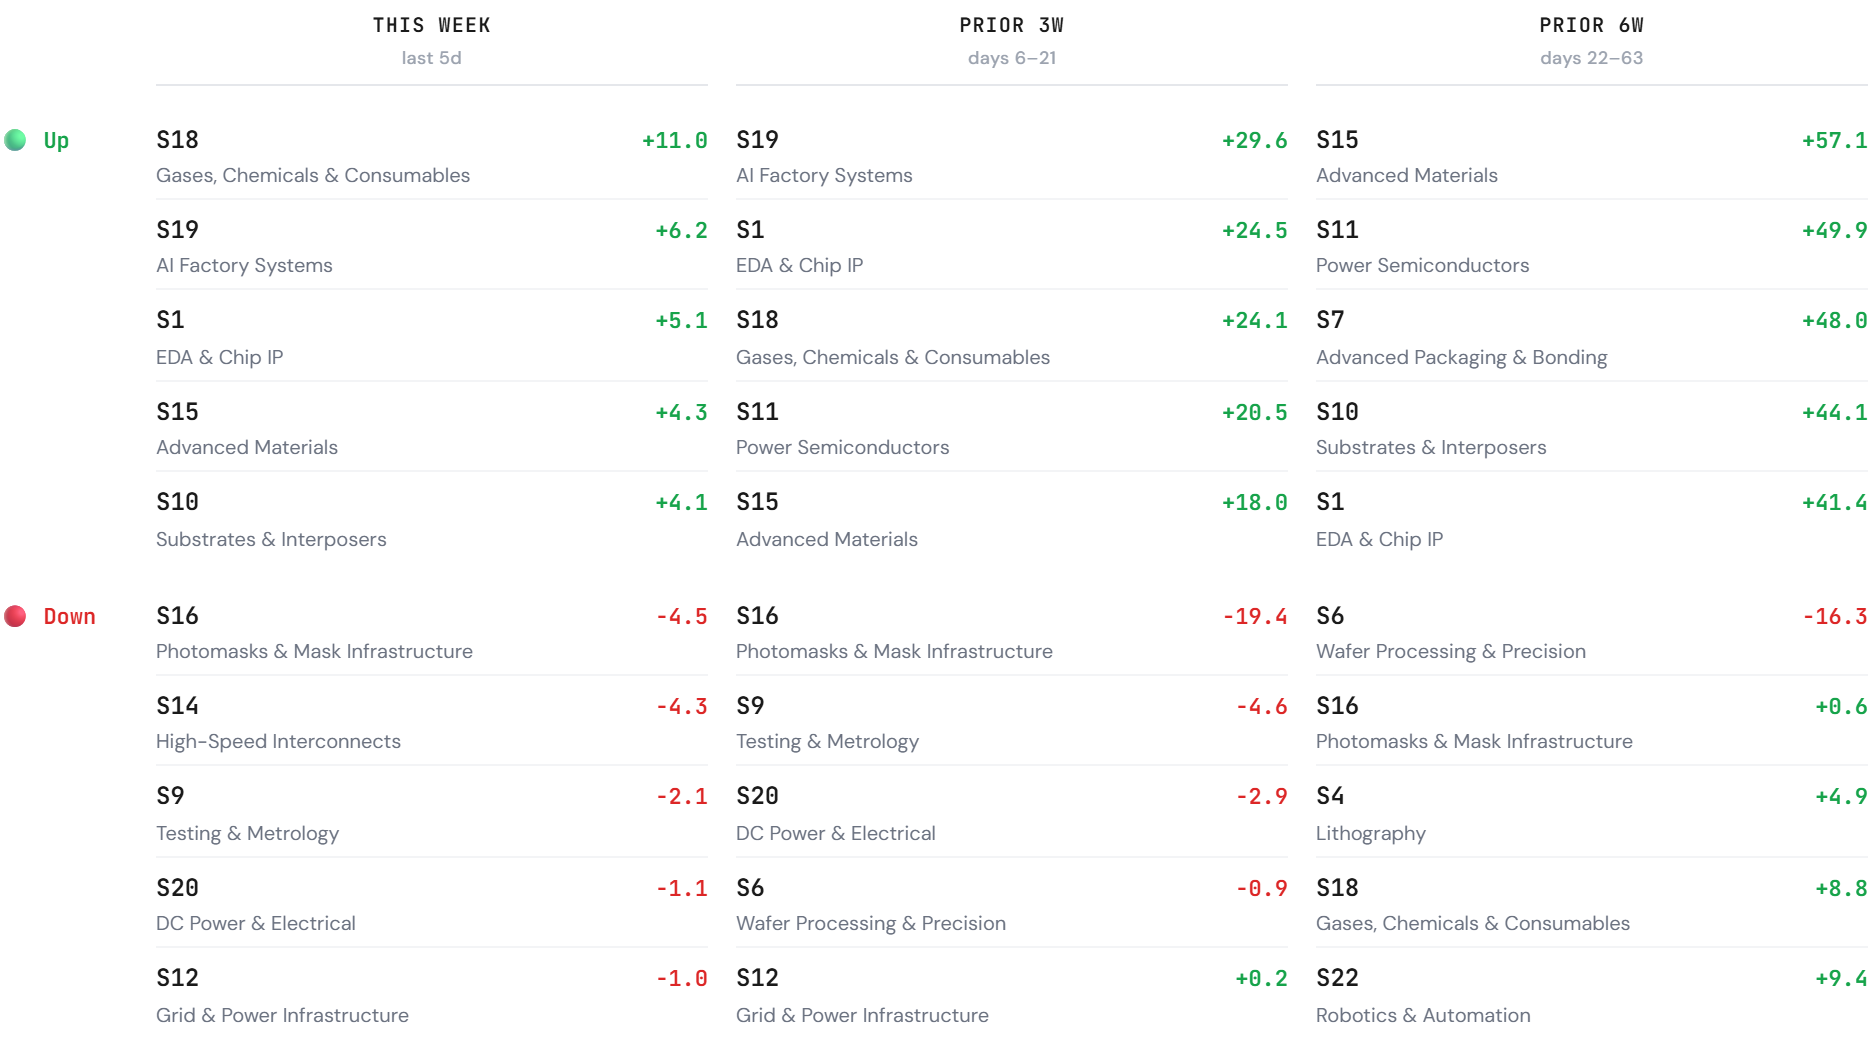
Inside Rubin (the builders), the sell-off was surgical. Materials +10.6%, vision +5.3%, grid +5.1% — the periphery of the build-out was fine. The core got hit: foundry −6.5%, fab subsystems −7.7%, memory −9.6%, storage −12.0%.
Inside the Agentic Ecosystem: identity +14.7%, security +10.4%, the application layer +10.2%, ops +7.3% — while the models tier fell −12.4% (a small tier, where single names dominate the print) and compute −2.6%. The market paid for what uses intelligence and sold what trains it.
Inside AW40: everything green — the Asia cohort +12.0%, applications +9.3%, enterprise +7.9%. The broadest strength anywhere in the universe.
Inside HALO: defense +18.4% and space +16.7% — the week's two strongest cohorts anywhere on our shelf — against flat-to-negative energy and nuclear.
Next week: continuation or reversion — the summer question
Two questions decide the tape into the seasonally weak stretch, and they are the same question mirrored.
1. Does the agentic run continue, or mean-revert? AW40 +7.7% and the AEI's application and security tiers at +10–15% in a single week is momentum that historically invites digestion. The regime backdrop still reads trending, not blow-off — but a week like this pulls forward returns. Watch the AEI application layer against its 20-day: holding above it keeps the continuation case; the first close below hands the baton to reversion.
2. Do investors buy the semi dip? The equipment and memory complex just repriced 7–12% in three sessions while software absorbed the money. If the dip gets bought fast — SOXX reclaiming the late-June shelf near 590 within days — the rotation was positioning ahead of earnings, and the dispersion closes from below. If it doesn't, the market is telling us something about AI-capex expectations into the July prints — and Rubin's core sectors are the live read on that conversation.
The bar itself: earnings expectations at cycle peaks. The quieter risk behind both questions is what the market now requires to stand still. Consensus has calendar-2026 earnings growth near +24% year over year — a level forward estimates rarely reach, and historically the kind of print that marks the late innings of a profit cycle rather than the early ones. Three drivers carry it, and all three are concentrated: the AI-infrastructure capex wave (2026 estimates for the infrastructure leaders revised up by half or more), an energy base effect from this spring's crude spike (temporarily triple-digit second-quarter sector growth — vulnerable now with crude back under $70), and margins that have so far refused to mean-revert. Beneath the aggregate the divide is stark: tech and infrastructure carry second-quarter projections around +40%, while the median across value and defensives sits nearer +13%.
Why it matters for the autumn: when the forward bar crosses roughly 20%, the market has priced flawless execution — small misses and soft guidance get punished out of proportion, and a 2026 peak makes the 2027 comparisons unforgiving before a single number is reported. Add the circularity we track all year on this site — index-level earnings growth currently depends on the build-out spending of a handful of buyers. If data-center monetization disappoints, the estimate downgrades arrive index-wide, not stock by stock. This week's tape — equipment and memory repriced 7–12% while the low-expectation half of the market rallied — reads like a first rehearsal of exactly that repricing.
The seasonal overlay: strong July, midterm asterisk. On the plain calendar, July is historically one of the Nasdaq's better months — which argues for the continuation case. But 2026 carries an asterisk: it is a midterm year, and the pattern changes. The three months running into a midterm election have historically been the weakest stretch of the four-year presidential cycle — an upward bias survives, but pre-midterm gains for the broad market have averaged only around 2–2.5% across that window, with uncertainty over control of Congress sitting on multiples. Volume tends to thin as the vote approaches, and volatility tends to spike once the ballots are in. The tail cases are worth remembering without forecasting them: in cycles that coincided with macro shocks — 1974, 2002 — the pre-midterm window produced double-digit drawdowns; 2022 rode a −20% bear market into the vote, 2018 a milder correction. The flip side completes the arc: the six months after a midterm have historically been among the strongest of the entire cycle. Cycles have phases; so do election years.
The frame for all of it: earnings season starts mid-July with the heavyweight AI prints in the back half — reported against the highest expectation bar of the cycle — and behind it opens the pre-midterm window described above. My base case remains some form of profit-taking before the season starts: a week like this one, where winners extend +8% while the VIX falls, is exactly the setup that tends to get trimmed into event risk; the bar makes misses expensive, and the calendar withholds its usual July support in a midterm year. The dispersion itself — software vs. semis, deployment vs. build-out — may be the summer's defining feature until the soft patch resolves it. The other end of the arc is already dated: historically, the strongest stretch of the cycle begins the week the midterm uncertainty clears — and by then the 2026 bar will have been tested print by print. Probability, not prophecy: we hold both branches, watch the levels, and let the calendar argue with itself.
Source: closelook.net Functional Indices and data lake, closes through Jul 2 (U.S. markets closed Jul 3–4); Bitcoin through Jul 5. Midterm-cycle statistics from published cycle research (Capital Group, U.S. Bank); consensus earnings figures from sell-side aggregates (FactSet Earnings Insight, Goldman Sachs U.S. equity forecast) as of early July. This is an investment diary, not investment advice — Look Investment GmbH is not a licensed adviser.