Weekly Signal · · 13 min read
Much More Than Semis — The Broadening Tech Bull
Eight ETFs in the Tech & Thematic table printed new 52-week highs last week — most of them all-time highs. SOXX weekly traces three trendlines of escalating steepness, with the final stage running near-vertical at 52°. The semi leadership has a chorus: Compute, Data Center, Power/Grid, Battery — exactly the Generation-Rotation footprint of Rubin Early Ramp colliding with Mid-Ramp Power/Cooling.
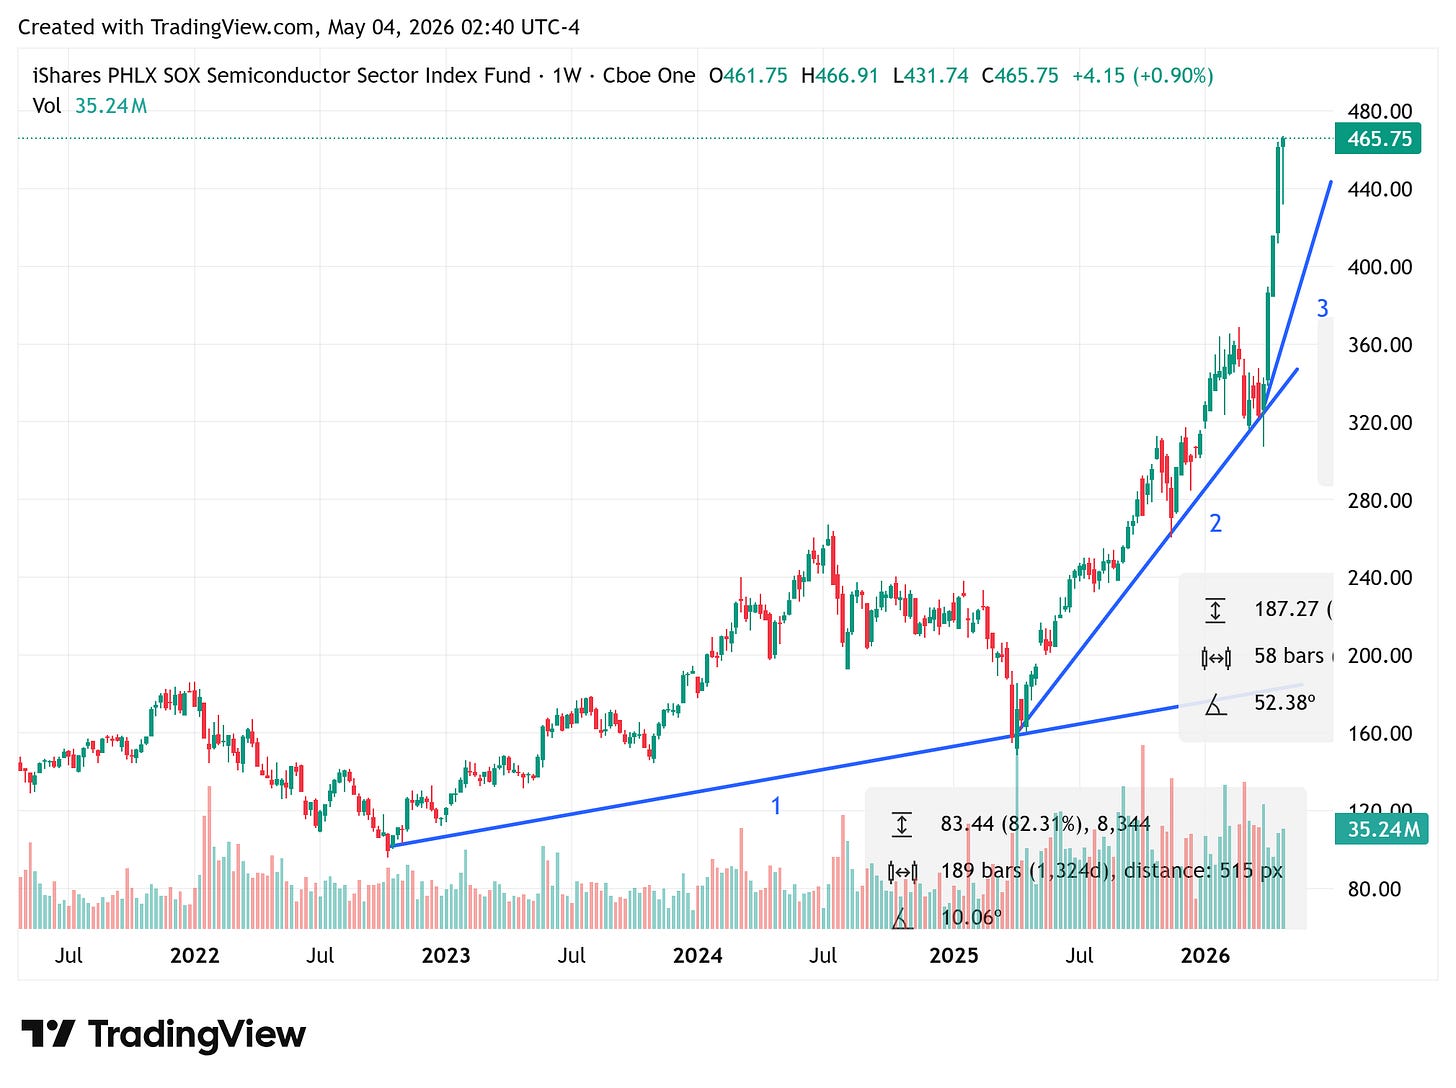
SOXX weekly traces three trendlines of escalating steepness: a 10° base from 2022 through 2024, a moderate middle leg through 2025, and a near-vertical 52° acceleration into spring 2026.
Each successive stage runs at roughly five times the slope of the prior one. That geometry — slope multiplying as the trend ages — is the textbook signature of a blow-off, historically the last stage before a reversion to the mean.
(1) Verdict — One Line
Temperature: 🟢 Hot — but selectively. Last week delivered a rare breadth signal: eight ETFs in the table below printed new 52-week highs, some of them all-time highs (SMH, XSD, AIQ, DTCR, WTAI, QTUM, GRID — plus LIT at a fresh 52W high but still ~9% below its November 2021 ATH).
That's not Mega-Cap concentration; that's a multi-axis breakout across Compute (SMH, XSD, AIQ, WTAI, QTUM), Data Center (DTCR), Power/Grid (GRID), and Battery (LIT) — exactly the Generation-Rotation footprint of Rubin Early Ramp colliding with Mid-Ramp Power/Cooling.
(2) The Tech Universe
Heat concentrates in physical AI. Semis lead (XSD +155% 52W, SMH +140%), and the AI Barbell is firing on the Grid sleeve (GRID +24.91% YTD, new ATH) — but not uniformly: NLR is consolidating ~3% below its March highs, XLU is just defensively drifting. The "Power" trade is currently a Grid-Equipment trade, not a Nuclear trade.
Cold pockets are structural, not cyclical. IGV –18% YTD isn't a momentum dip; it's the SaaSpocalypse repricing — agentic AI eating per-seat economics. FINX –13% YTD and ESPO –11% YTD round out the application-layer weakness. The +1.68% bounce in IGV last week is reflex, not reversal.
Hedges are diverging. GLD is consolidating (–2.32% 5D, still +42% 52W), IBIT is decoupled to the downside (–19% 52W) — Bitcoin is no longer correlating with the tech bid. COPX took a –4.03% week but sits on +107% 52W; that's profit-taking in a doubled asset, not a trend break.
(3) The Winners — Broader Than Just Semis
The Semi-Complex
Four panels, one pattern. SMH (cap-weighted) at 509.82, SOXX at 465.75, SMHX (fabless) at 51.27, XSD (equal-weighted) at 498.40 — all four pressing or printing fresh highs into the May 1 close. The equal-weighted XSD outperforming cap-weighted SMH is the breadth tell: when equal-weight beats cap-weight inside a sector, participation is wider than the leaders alone would suggest. This is not a Nvidia/Broadcom-only tape.
Stochastic is pinned in the upper band on all four. Overbought, yes — but in established uptrends, overbought tends to mean continuation, not reversal. The first stochastic cross-down without a corresponding price break is the early warning to watch.
Compute, Quantum, and Battery
DTCR (Data Center) and QTUM (Quantum) are the cleanest charts on the page — uninterrupted multi-year uptrends still inside their structure, both at fresh ATHs. Datacenter buildout and quantum compute are the AI-capex sleeves with the least visible exhaustion.
WTAI is a different shape: a deep 2024 drawdown followed by a vertical 2026 recovery, only now back at prior peaks. The momentum is real, but the chart is at resistance, not above it.
LIT is the hardest read on the page. Yes, it broke out of a three-year base above $50 — but the November 2021 peak at $97.13 still sits ~9% above current price. LIT has cleared its 52-week high but not its all-time high. That distinction matters: in DTCR, QTUM, and WTAI, you're trading with the long-term trend; in LIT, you're still trading inside an unresolved post-2021 repair.
Infrastructure & the Power-Trade Nuance
The "AI Barbell" sleeve is not monolithic. DTCR (Data Center) is leading. SNSR (Internet of Things) is breaking out alongside it — quietly, but the chart is unambiguous.
NLR (Uranium) shows a textbook lower high — peaked early 2026, now consolidating roughly 3% below the March top. XLU (Utilities) is the slowest of the four and clearly defensive, drifting sideways near the top of its multi-year channel.
Translation: the Power-trade right now is a Grid-Equipment trade, not a Nuclear trade. GRID printed a fresh ATH last week. NLR did not. The NLR consolidation is not yet a top, but it has stopped leading.
(4) The In-Betweens — The Middle Nobody Is Writing About
This is the bucket the headline misses. Neither breaking out with the semis nor breaking down with software, these sectors are sitting on inflection points. If a leadership rotation begins, it begins here first.
- CIBR (Cybersecurity) — 68.76, +3.21% 52W but –3.76% YTD. The chart pattern is consolidation, not rollover. Cybersecurity has structural tailwinds the market is currently ignoring. A breakout above the early-2026 highs flips the setup.
- FDN (Mag-7 Internet Proxy) — 266.11, sitting roughly 7% below its 286.42 peak from late 2025. This is the chart that quietly tells you whether the rally has been narrower than it looks. If the broadening thesis is real, FDN reclaims 286 in the coming weeks. If FDN can't, the rally was Mag-7 plus semis and not much else.
- NLR (Uranium/Nuclear) — 144.00, –3.16% 3M. As above: pausing, not topping. Watch the early-2026 high for confirmation either way.
- XLU (Utilities) — 46.55, +9.04% YTD. Drifting at the top of its channel. Defensive participation, not leadership.
- SHLD (Defense Tech) — 67.92, –7.57% 1M, –9.73% 3M. The clearest "rolling over" candidate in the in-between bucket. If this drops to the loser column next week, that's a signal worth tracking.
- SNSR (IoT) — 44.79, +21.21% YTD, +38.68% 52W. Already migrating toward the winning side — the chart is clean enough to flag here.
- DAPP (Crypto Infrastructure) — 19.07, +15.37% YTD, +76.08% 52W, but –0.99% last week. Choppy, not broken.
(5) The Losers — Wider Than Just Software
The headline is "software lags." The reality is that application-layer rerating extends beyond software to adjacent themes that share the same characteristic: businesses where agentic AI threatens unit economics or attention share.
- IGV (Software) — 86.63, –18.03% YTD, –10.70% 52W. The SaaSpocalypse trade. Per-seat licensing models are being repriced as agentic AI compresses the value of the seat. Last week's +1.68% bounce is reflex, not reversal — until IGV reclaims structure, every rally is a sell.
- FINX (Fintech) — 25.61, –12.98% YTD, –9.28% 52W. The weakest pattern on the page. Multi-year base with no recovery attempt and stochastic stuck in the lower band. The fintech application layer is being rerated for the same reasons software is.
- ESPO (Gaming) — 91.73, –11.47% YTD, –3.08% 52W. Two-year range with a recent break to the downside. Gaming attention economics are losing to AI-native experiences — the chart agrees.
- IBIT (Bitcoin) — 44.47, –19.07% 52W. The macro tell of the page. Bitcoin used to correlate with the tech bid; this year, it doesn't. IBIT down 19% over a year in which SMH did +140% is the cleanest example of decoupling on the table. We don't read IBIT as a structural sell — we read it as confirmation that the AI-infrastructure trade is now its own animal, no longer dependent on broad risk-on flows.
(6) The Question
Continuation, reversal, or broad bull with rotated leadership?
That's the only question that matters from here. The three buckets above are the status. The next move is the path forward.
(7) Three Scenarios
Blow-off Until Summer
52° trendline holds. Semis extend. Breadth narrows back to leaders. Equal-weight stops outperforming cap-weight. Late-summer mean reversion sharper because the move was steeper.
Rotation Out of Tech
QTEC fails to hold breakout above the regression channel. Ex-tech (QQXT) takes leadership. Defensives, value, rate-sensitives bid up. Probability low given current breadth, but not zero.
Broad Bull, Rotated Leadership
Bull continues, leadership inside tech rotates. CIBR / FDN / NLR / SNSR close the gap to leaders. Equal-weight keeps beating cap-weight. AI-infrastructure breadth widens.
Scenario A · Continuation / Blow-off until summer. The 52° trendline on SOXX holds. Semis extend; AI Compute extends; breadth narrows back to the leaders; equal-weight stops outperforming cap-weight. Late-summer mean reversion is sharper because the move was steeper. Vertical moves end vertically.
Scenario B · Reversal / Rotation out of tech. QTEC fails to hold its breakout above the regression channel. Ex-tech (QQXT) takes leadership. Defensives, value, and rate-sensitives bid up — the bear case for the broadening thesis. Probability is low given the current breadth, but not zero — this is what August historically delivers if it delivers anything.
Scenario C · Broad bull continues with rotated leadership (preferred). The bull continues, but leadership inside tech rotates. Second-tier and in-between names — CIBR, FDN, NLR, SNSR — close the gap to the leaders. Equal-weighted indices keep beating cap-weighted. The Mag-7 plateaus or modestly underperforms while the AI-infrastructure breadth widens. The in-betweens of today become the relative winners of June and July.
We favor Scenario C.
(8) Tech vs Non-Tech in Nasdaq 100
QTEC — the technology-only sleeve of the Nasdaq 100 — has broken out above the upper boundary of its 2023-onward linear regression channel. R² ~0.93, meaning the channel is a high-quality fit. The breakout is decisive, on volume, and confirms what the SOXX trendlines and the Section 3 charts already showed: tech leadership inside the Nasdaq 100 is not just intact, it's accelerating.
QQXT — the ex-technology sleeve of the same index — sits at the upper boundary of its regression channel but has not broken out. The recent move is a fade back toward the midline: same time period, same index family, completely different chart.
The contrast is the punchline. The "broadening" we expect is happening inside tech, not from tech to non-tech. Tech remains the leadership and we expect that to continue. Scenario B requires QQXT to break its channel and QTEC to fail its breakout — neither has happened, and the current action is moving the other direction.
(9) Global Read · US, Asia, Europe
Zoom out one fractal. US technology and Asian infrastructure (Taiwan and Korea semis, Japan equipment, China datacenter buildout) are the global leaders. Europe lags — but the lag is misleading.
European AI-infrastructure leaders in the same verticals are outperforming strongly. ASML and ASMI in lithography, BESI in advanced packaging, Schneider Electric and Siemens Energy on the grid side, Prysmian in cabling, ABB in automation — these names are doing what their US and Asian counterparts are doing.
They just don't carry enough weight inside SXXP or DAX to lift the indices. European benchmarks are dominated by financials, staples, autos, healthcare, and energy — sectors that aren't participating in the AI-capex super-cycle. The European AI-infrastructure leader is in the bull. The European index is not.
Same broadening principle as inside the US tech universe: the headline tells you less than the dispersion underneath it.
Three independent observations, one pattern. Inside US tech: semis vs software is too coarse. Inside the Nasdaq 100: tech vs ex-tech is widening, not narrowing. Across regions: US/Asia vs Europe misrepresents what's happening in the right sectors. At every scale, the dispersion is wider than the headline.
(10) Preferred Scenario
Broad bull continues, with rotating leadership in tech. The in-betweens are where this rotation shows up first. Cap-weighted indices keep grinding higher; equal-weighted indices outperform them.
AI-infrastructure breadth widens. Mag-7 leadership softens without breaking. European and Asian AI-infra leaders continue to outperform their home indices.
(11) What Comes After
The bull holds into late August on current breadth and acceleration. August and September are historically the weakest two months of the calendar — the seasonal headwind alone is enough to end the trend, even without a fundamental catalyst.
This year that seasonal weakness collides with mid-term election uncertainty. Fear builds through October into early November. Volatility expands. The leaders that ran hardest in May–July correct hardest in August–October.
Post-election relief — regardless of outcome — typically resolves the uncertainty premium. A year-end bull through November and December follows the historical playbook for mid-term cycles. That's the setup we're underwriting.
Closelook Weekly Signal · Special Edition — Tech Breadth · closelook.net/weekly/
Thomas Look · [email protected]