—

Amazon.com Inc (AMZN) — chart, structure and Closelooknet read

Pick a ticker to load its detail page.

The desk on AMZN

What this diary said about Amazon.com Inc, what it holds and what would change its view — in its own words, dated. Investment diary, not advice.

What we hold

BookPositionSinceResult
AI Cycle 2030 (wikifolio) ↗ 11 shares · average entry €203.15 — —
Closelooknet (wikifolio) ↗ 35 shares · average entry €240.30 — —

Model books as of the latest close; wikifolio positions from the official wikifolio data, entries in euros. Results are unrealised, before any exit. A record of what the diary does, not a recommendation to do the same.

Our record on AMZN

Every scored call, pick and trade this diary has made on Amazon.com Inc, with the outcome where it is known.

Company snapshot — Amazon.com Inc

AMZN in five paragraphs: what it makes and sells, where it sits in the Closelooknet stack, who it is priced against, why we track it, what we watch. Research diary, not advice.

What it does
Amazon runs three reporting segments: North America and International retail, and Amazon Web Services (AWS). The retail arm sells its own inventory and hosts third-party sellers, alongside devices such as Kindle, Fire and Echo, and a media and advertising business built around Prime membership. AWS sells compute, storage, database and machine-learning services to businesses and developers, including the infrastructure used to train and run AI models. It is based in Seattle and serves consumers, sellers, advertisers and enterprise customers worldwide.
Where it sits in the stack
Amazon carries no seat in our Rubin index, so it sits instead in the hyperscaler sleeve that the diary tracks under Mag Pulse, our name for Magnificent Seven momentum. Through AWS it is a large customer of the chip and data-centre layers that Rubin does track, since its cloud capex helps set the pace of orders further down the stack.
Who it is priced against
Closelooknet's peer group for Amazon is hyperscalers and platforms, the curated set the market prices it against rather than a plain sector match: Microsoft, Alphabet, Oracle, Alibaba and Walmart; Meta is the additional name the wider market often adds to that list.
Why Closelooknet tracks it
Amazon holds seats in the Nasdaq-100 and the Dow Jones Industrial Average, and it carries a Closelooknet score with momentum as the strongest module and valuation as the weakest. The diary's Weekly Signal has tracked it among the long-run Magnificent Seven trends, a Pattern report ties its quarterly capex disclosures to Nvidia's tape, and a 101 piece names AWS among the hyperscalers set against the alt-hyperscaler cloud names.
What the diary watches
Whether AWS capex and cloud growth keep supporting the momentum read even as the valuation module stays the weakest part of the score.

Amazon.com Inc (AMZN) trades on US exchanges, classified under Consumer Cyclical.

The Closelooknet company score reads 50/100 composite (momentum 64, quality 54, valuation 42) across 7 modules — the full breakdown, chart structure and analog history load live above.

Written from the company’s public profile and Closelooknet’s own readings, 2026-09-17. Descriptive, refreshed with the registry; corrections welcome via the imprint. closelook.net is an investment research diary — market structure, index membership and scores are our own readings, not investment advice. Related: AMZN news on the tape · index compare · sector dispersion · scanner.

Signals for this name

Every Closelooknet reading that exists for AMZN, from the same nightly bakes the boards use. Research diary readings, not advice.

The Street on this name 2 analyst actions on the wire · latest: price target by Wells Fargo, 2026-09-03

The Street on this name

Analyst actions and the latest print for AMZN from the Closelooknet wires — third-party opinions on the record, not our readings.

  • Price target Wells Fargo — target 338 from 328 Target raised to $338 from $328 (+32.6% to spot) 2026-09-03
  • Price target Evercore ISIMember Login — target 355 Target set to $355 (+38.5% to spot) 2026-08-28

2 actions on the analyst wire since 2026-08-13: 2 target changes. Analyst wire → · Earnings wire →

Who it is priced against Hyperscalers and platforms · 5 names with week and year-to-date

Peer group

Hyperscalers and platforms

Curated competitor set — who the market prices this name against, not just who shares its sector.

Compared against AMZN on the nightly bakes; the Peers tab ranks the cohort on the Closelooknet scores where it exists.

Versus its index Agentic Winners 40 — the name, its sleeve and the index over day, week and month

Versus its index

The name against its Closelooknet index and its own sleeve — equal-weight, nightly closes.

Agentic Winners 40 · as of 2026-09-24

DayWeekMonth3 months
AMZN0.0%−0.7%−4.5%+9.9%
Megacap Gateway+0.8%+2.5%+7.2%—
Agentic Winners 40−0.3%−0.8%−1.4%—

Against the index: 0.1 pts ahead on the week, 3.1 pts behind on the month; against its Megacap Gateway sleeve 11.7 pts behind on the month.

Returns from the index workers’ nightly closes; equal-weight sleeves. A relative reading from the research diary, not advice.

Dividends and capital return no distribution in twelve months

Dividends and capital return

What AMZN pays out and buys back — distributions read from the price series, money terms from the filings.

  • Distributions No cash distribution recorded in the price series over the last three years
  • Share count +1.0% in FY2025 19.5 bn USD of stock-based compensation in the year

Per-share amounts are derived from the adjusted price series in the listing currency, so dates sit within days of the ex-date; filing figures come from the fundamentals feed for the last reported fiscal year. An investment diary, not a recommendation.

How it trades on rate days beta 0.40 to TLT · on the worst bond days it fell more than the market

How it trades on rate days

How AMZN has moved when long-dated Treasury yields rise — measured against TLT, the 20+ year Treasury fund.

  • Beta to long bonds, 1 year 0.40 — shows only a loose link to bond moves for every 1% move in TLT (20+ year Treasuries), Amazon.com Inc moved 0.40% on average · correlation 0.11 · higher than 40% of US names
  • Beta, last 3 months 0.38 about the same as over the year
  • On the 10 worst bond days −1.16% on average against −0.74% for the S&P 500 the 10 sessions of the past year in which TLT fell most, i.e. long yields rose most
  • Latest of those days +0.04% TLT −1.29% that day 2026-09-24

Daily total returns from the adjusted price series; a TLT down day is a day long yields rose. Beta = the average move of the name for a 1% move in TLT. Past sensitivity, not a forecast. An investment diary, not a recommendation.

Weather around the name 3 macro readings: Money Temperature, Factor regime, Sovereign pressure

The weather around this name

Macro readings that apply by membership — the regime, the factor tape, the sector cell, the funding backdrop.

  • Money Temperature Composite 60/100 · S&P 500 fund at 66, bullish alignedEight instruments scored on position, momentum, volume, volatility and fragility — the regime every name trades inside. Temperature lab → 2026-09-24
  • Factor regime Momentum leading — risk appetite buildingMomentum against low volatility (SPMO / SPLV): above its 50-day trend, 99th percentile of the window, +10.1% over 20 sessions. Factor regime → 2026-09-24
  • Sovereign pressure Index 0.75 · up 0.21 over 21 sessionsG7 long-end yields, 10s30s and the slope — the funding weather for every balance sheet on this site. Sovereign pressure → 2026-09-24

FAQ · from the current data · as of 2026-09-25

Quick answers

What is Amazon.com Inc (AMZN)?

Amazon.com Inc trades as AMZN on the US exchange and is classified under Consumer Cyclical in the Closelooknet research universe, as of the registry build of 2026-09-25.

Is AMZN in a Closelooknet index?

Not currently — Amazon.com Inc is tracked in the Closelooknet research universe but is not a constituent of a Closelooknet functional index as of 2026-09-25.

What is Amazon.com Inc's Closelooknet composite score?

50 out of 100, with momentum 64, quality 54 and valuation 42 sub-scores, as of 2026-09-25. Scores are Closelooknet's own research readings, not ratings or investment advice.

What is Amazon.com Inc's earnings print record?

Across the 10 prints Closelooknet covers, Amazon.com Inc beat EPS estimates 9 times and revenue estimates 9 times; the three-day reactions split 5 up, 2 flat and 3 down (moves beyond ±3%), as of the 2026-07-28 card. The full print-record card carries the per-print history.

Where does AMZN trade against its moving averages?

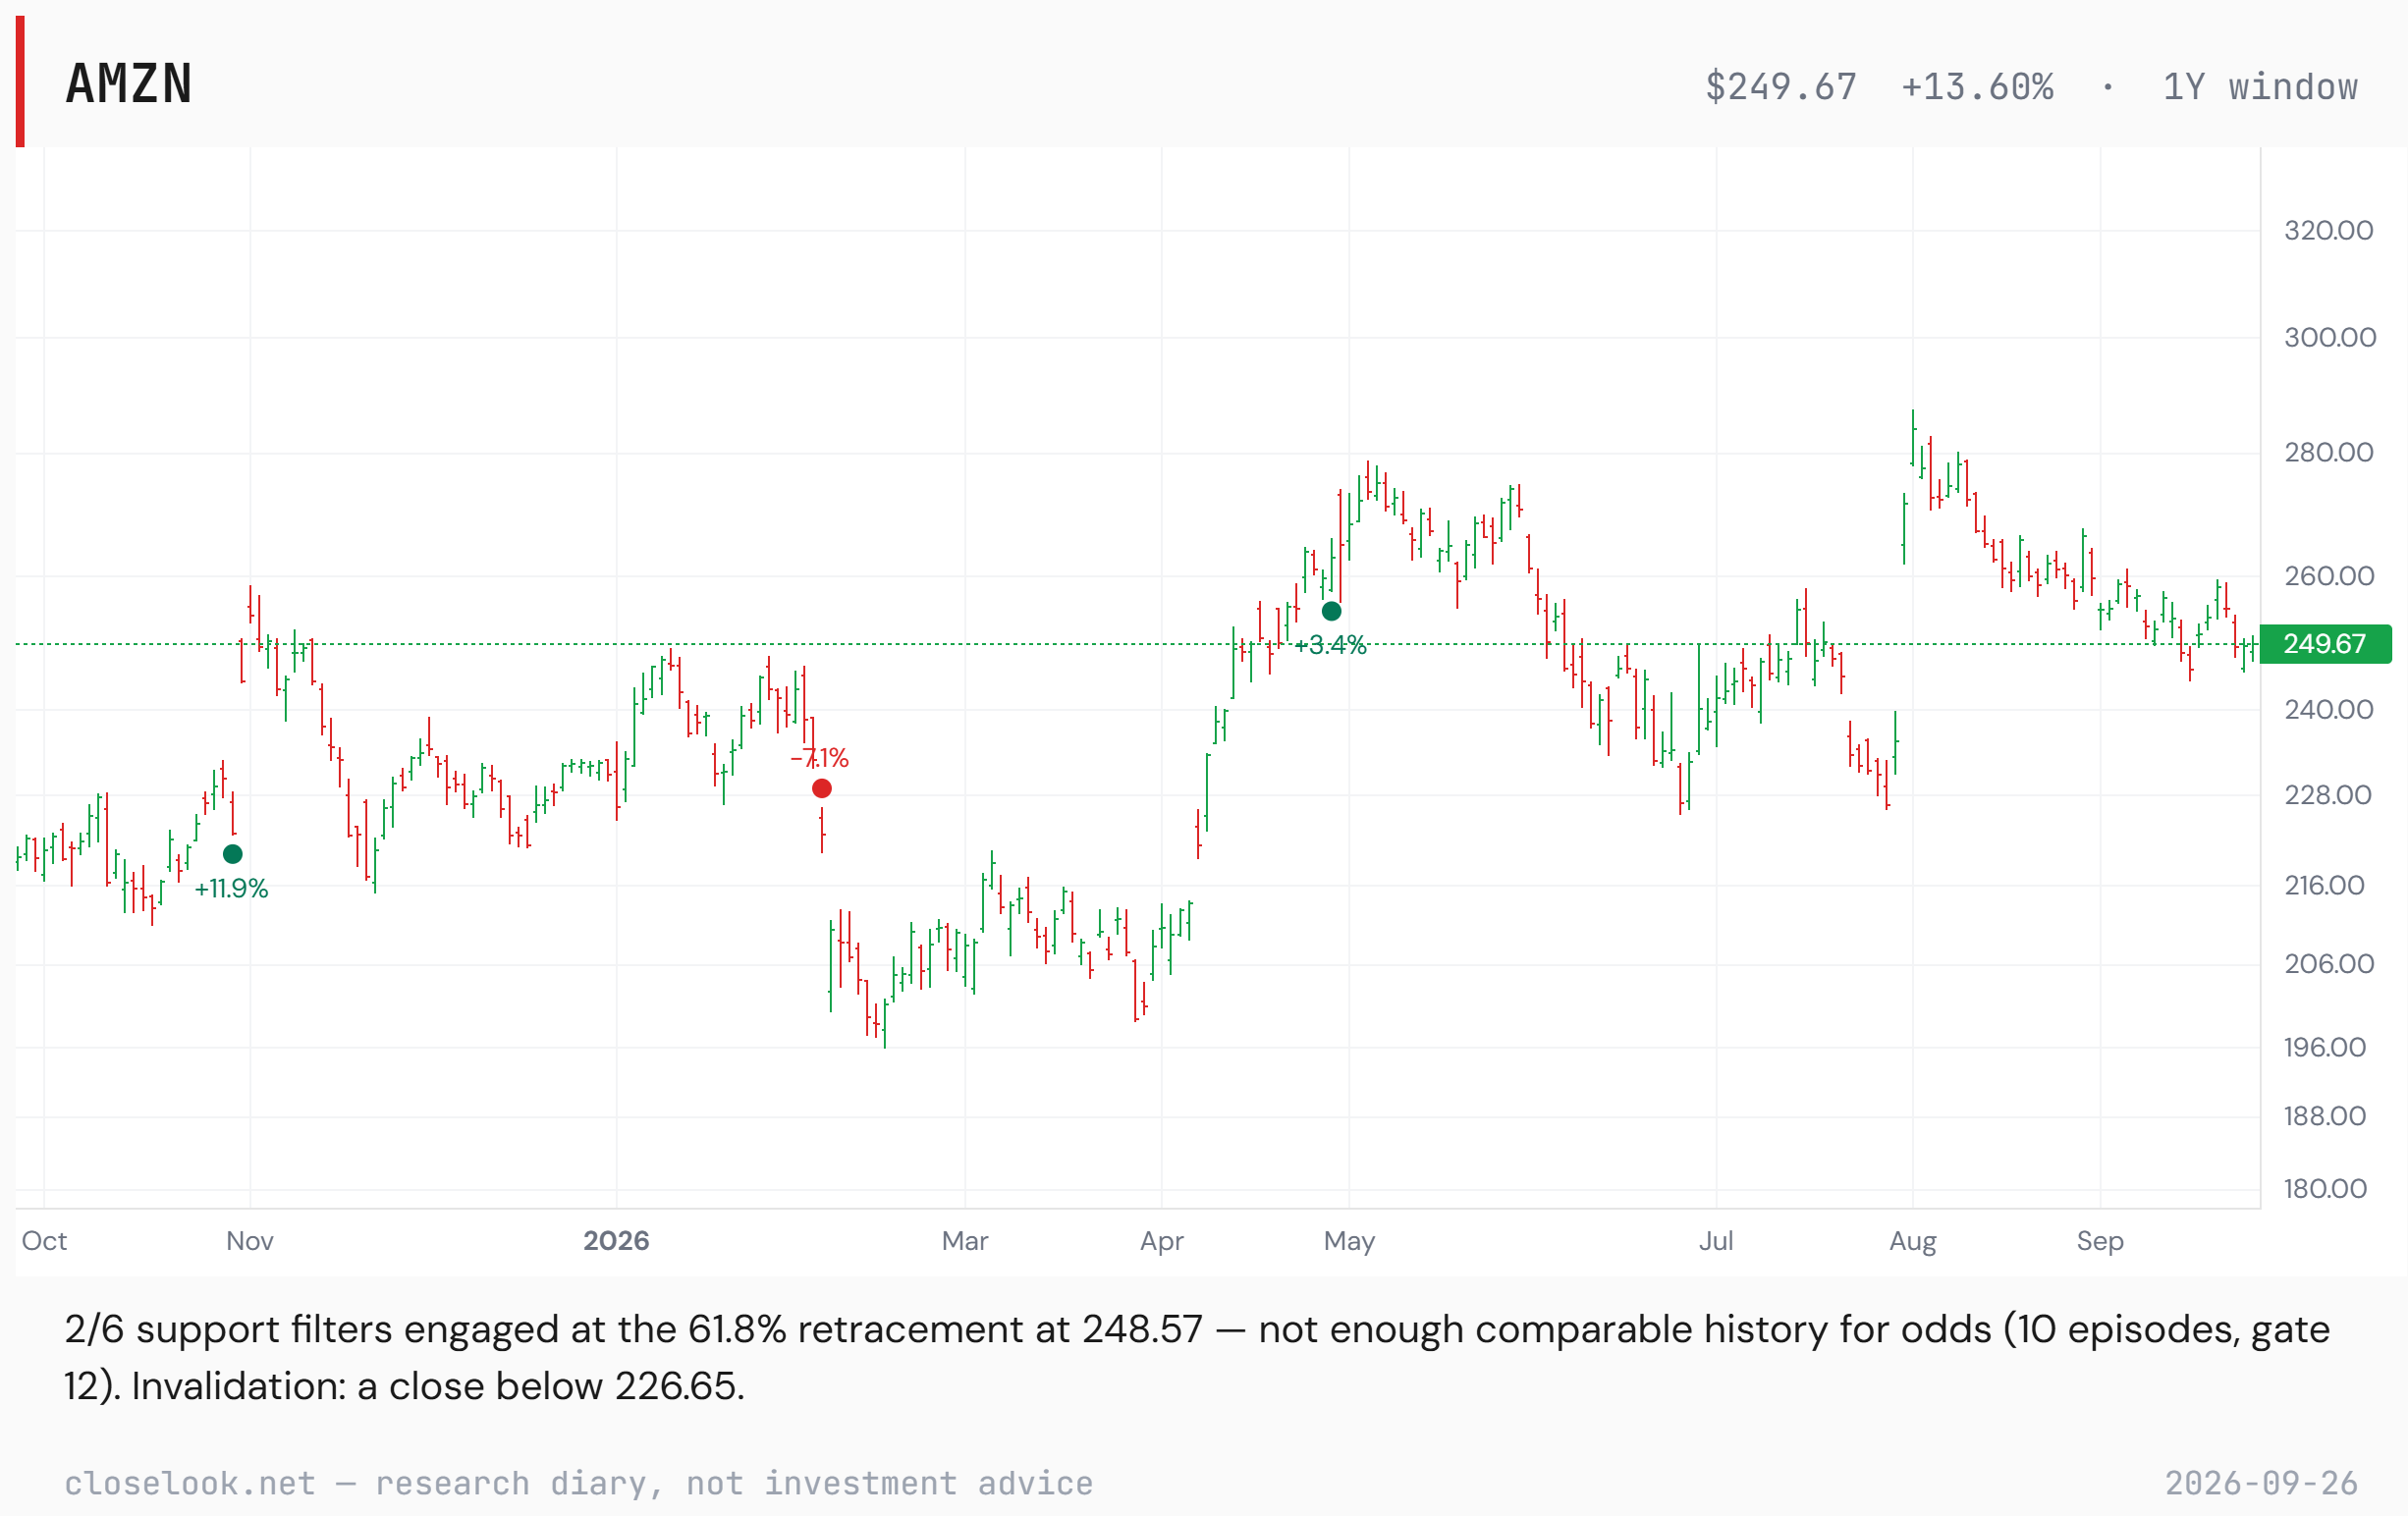
In a correction — 13.2% off its high: 13.2% below its 52-week high and under its 50-day — a textbook 10-to-20% correction. As of 2026-09-23 — a technical state from the nightly Closelooknet bake, not advice. The Technical tab carries the full row.

How is AMZN doing against its Closelooknet index?

Over the past month Amazon.com Inc is −4.5% against −1.4% for the Agentic Winners 40 — 3.1 points behind its index, as of 2026-09-24. Its Megacap Gateway sleeve is +7.2% over the same month. The “Versus its index” table on this page carries the day, the week and the month for the name, its sleeve and the index.

What does Amazon.com Inc do?

Amazon runs three reporting segments: North America and International retail, and Amazon Web Services (AWS). The retail arm sells its own inventory and hosts third-party sellers, alongside devices such as Kindle, Fire and Echo, and a media and advertising business built around Prime membership. AWS sells compute, storage, database and machine-learning services to businesses and developers, including the infrastructure used to train and run AI models. Closelooknet's peer group for Amazon is hyperscalers and platforms, the curated set the market prices it against rather than a plain sector match: Microsoft, Alphabet, Oracle, Alibaba and Walmart; Meta is the additional name the wider market often adds to that list.

Where does Amazon.com Inc sit in the AI build-out?

Amazon carries no seat in our Rubin index, so it sits instead in the hyperscaler sleeve that the diary tracks under Mag Pulse, our name for Magnificent Seven momentum. Through AWS it is a large customer of the chip and data-centre layers that Rubin does track, since its cloud capex helps set the pace of orders further down the stack. Amazon holds seats in the Nasdaq-100 and the Dow Jones Industrial Average, and it carries a Closelooknet score with momentum as the strongest module and valuation as the weakest. The diary's Weekly Signal has tracked it among the long-run Magnificent Seven trends, a Pattern report ties its quarterly capex disclosures to Nvidia's tape, and a 101 piece names AWS among the hyperscalers set against the alt-hyperscaler cloud names.

Does Amazon.com Inc pay a dividend?

No cash distribution shows in Amazon.com Inc’s price series over the last three years. The share count rose 1.0% over the fiscal year. The "Dividends and capital return" block on this page carries the lines.

How does Amazon.com Inc trade when bond yields rise?

Over the past year Amazon.com Inc had a beta of 0.40 to TLT, the long-dated Treasury fund — it shows only a loose link to bond moves, higher than 40% of US names. On the 10 sessions in which long bonds fell most it moved −1.16% on average, against −0.74% for the S&P 500. The "How it trades on rate days" block on this page carries the lines.

What has Wall Street done on Amazon.com Inc recently?

The most recent analyst action on Amazon.com Inc on the Closelooknet wire is a price target by Wells Fargo on 2026-09-03 (target 338 from 328). 2 actions on the analyst wire since 2026-08-13: 2 target changes. Analyst actions are third-party opinions recorded by the wire, not Closelooknet readings. The “The Street on this name” block on this page lists the moves; the full feeds are the analyst wire and the earnings wire.

Where has Closelooknet written about Amazon.com Inc?

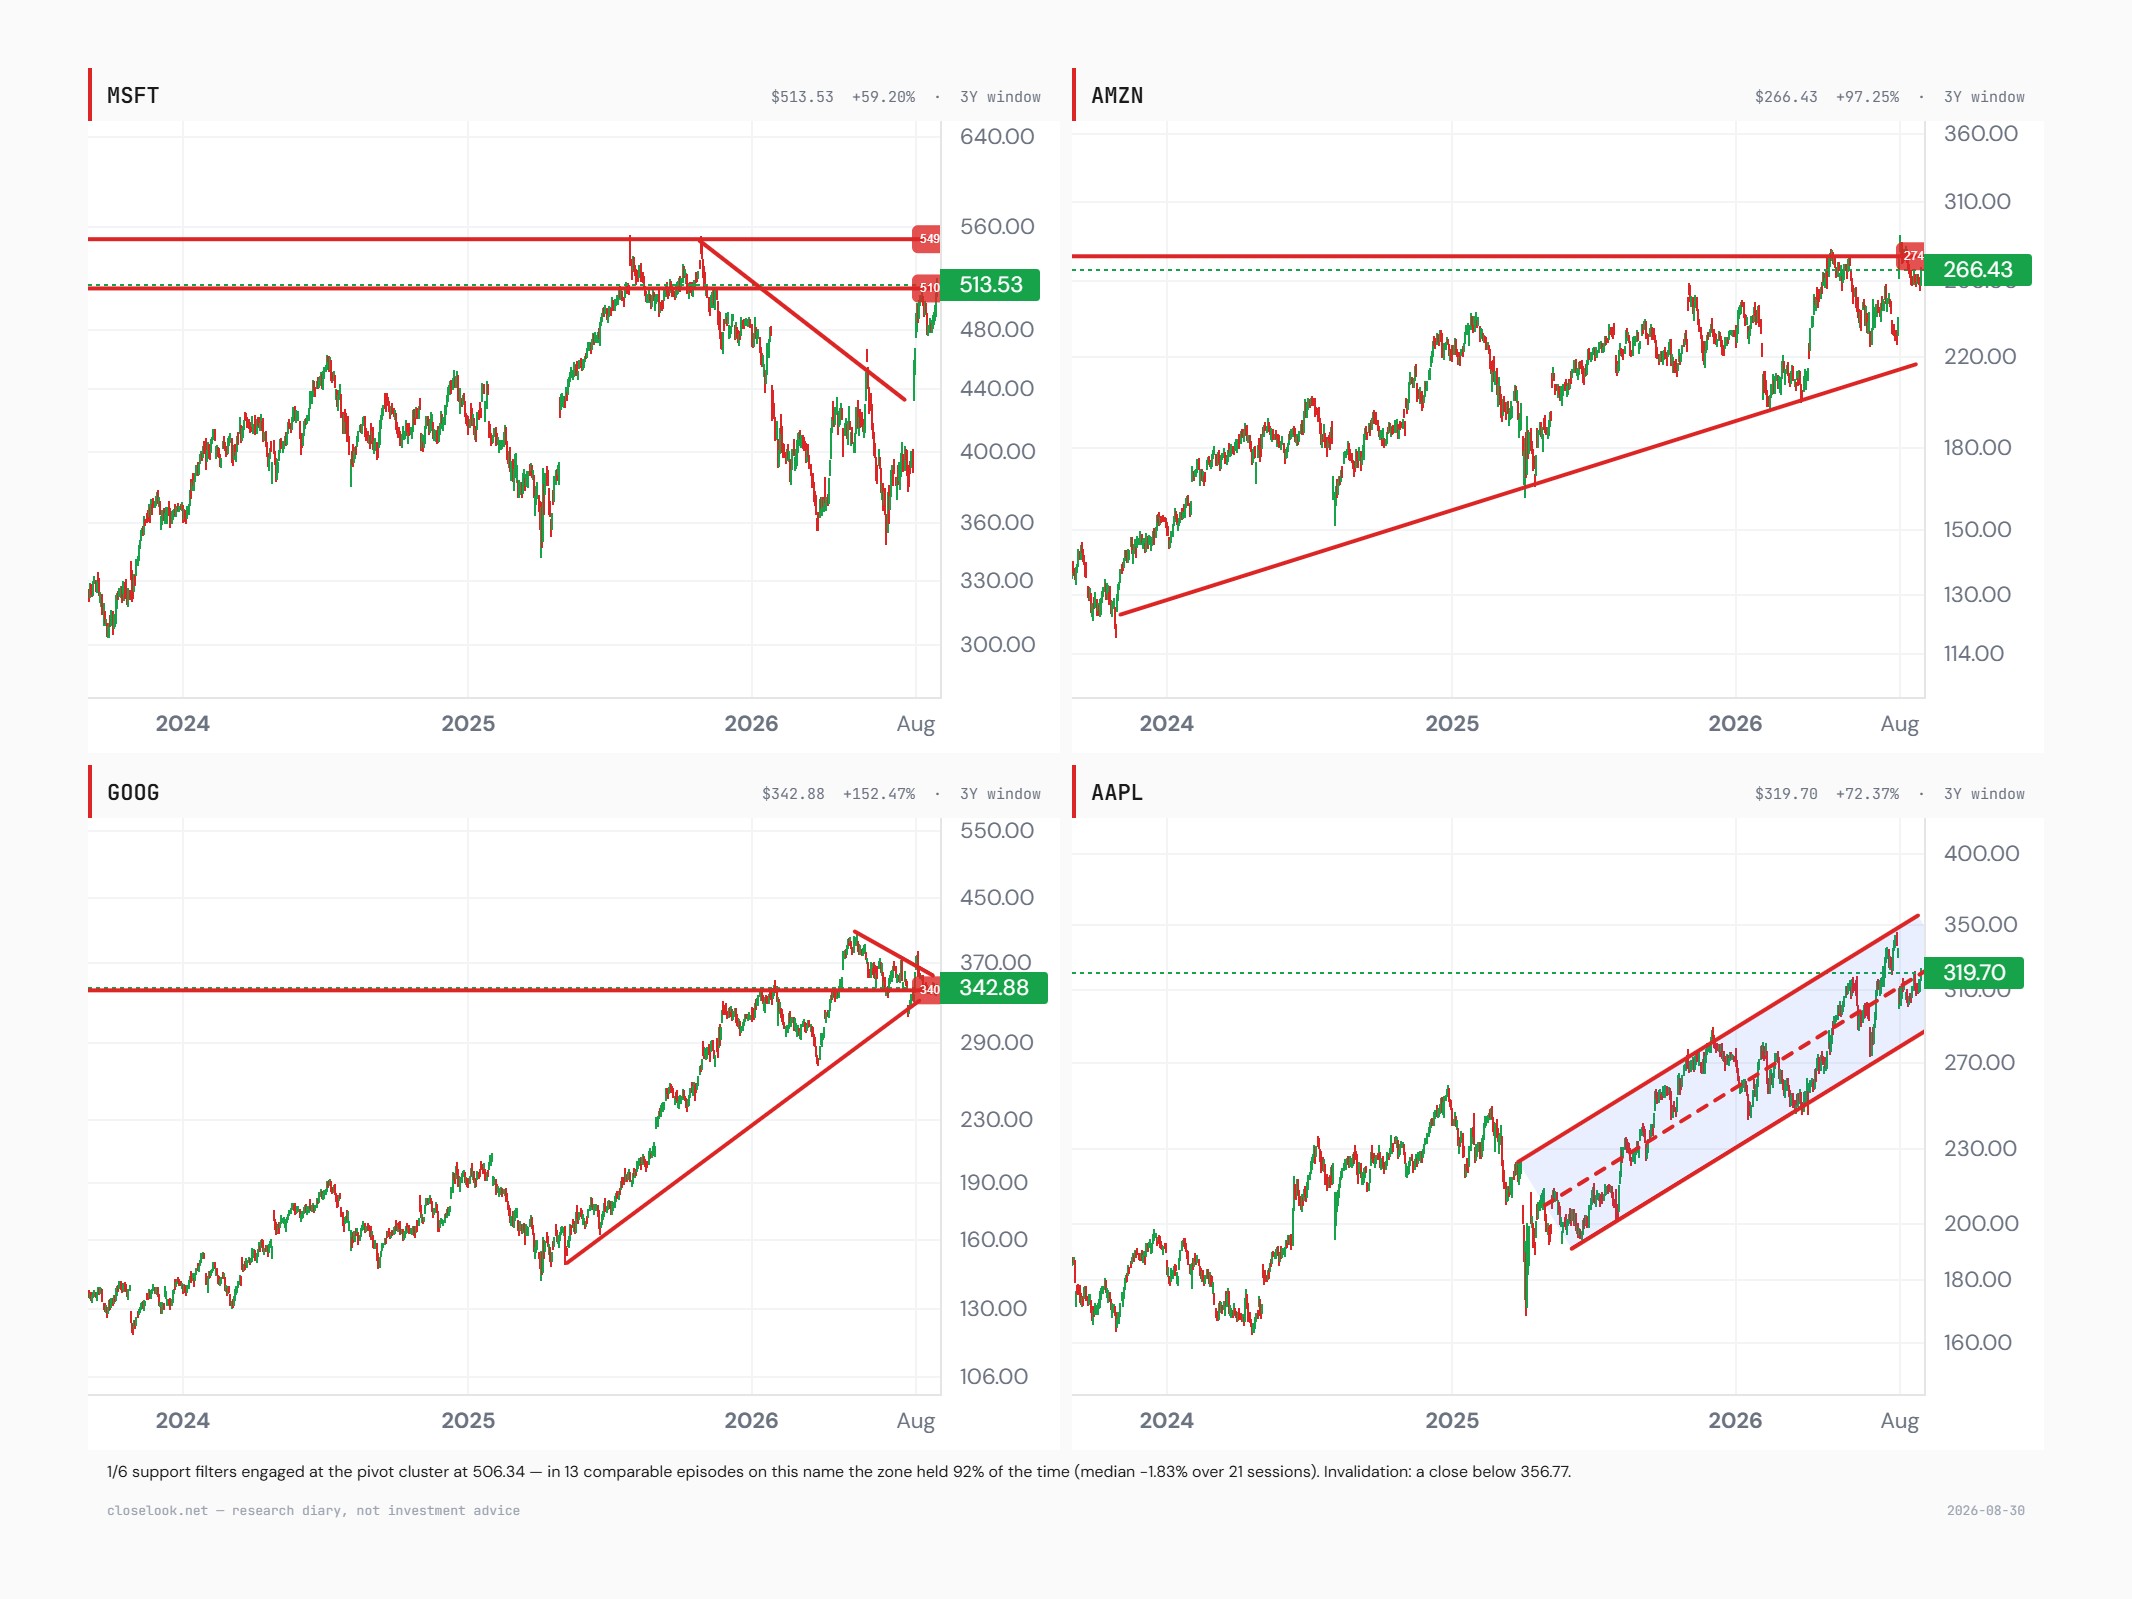
Amazon.com Inc appears in 20 Closelooknet pieces, most recently Midday 10: AI Credit — Oracle invokes force majeure on a New Mexico data center; the 30-year hits 5.45% (2026-09-24); Morning 10: Rates — the 10-year closes at 5.11% and the 5-year hits 5%; Tokyo reopens higher, chip-equipment makers lead (2026-09-24); Midday 10: Yields — the 10-year is back above 5% on a hot PMI and a hawkish Fed; chips fall, software is bought (2026-09-23). What Closelooknet said most recently: 2 · The four long trends — and the one most behind The four long trends, three years each: MSFT +59%, AMZN +97%, GOOG +152%, AAPL +72%. (Weekly Signal, 2026-08-30). The "Mentioned on Closelooknet" block on this page lists the long reads, the reference entries and the dailies that name it.

What does this page show?

A live price chart with SMA overlays and drawing tools for AMZN, performance metrics, index-membership context and the Closelooknet structure read — an investment research diary view, not investment advice.

Mentioned on Closelooknet 20 pieces · newest: Midday 10, “AI Credit — Oracle invokes force majeure on a New Mexico data center; the 30-year hits 5.45%” (2026-09-24)

Mentioned on Closelooknet

Where AMZN appears in the diary — 20 pieces, newest first. Every link is our own writing.

Long reads

101 and glossary

Related in the Closelooknet universe

then Internet Retail. Scored names rank on their Closelooknet score; names without one rank on trend state — above or below their 50- and 200-day averages — never on a score they do not carry.