Weekly Chart Pick · 2026-10-16
Retail — the store that wins when money is tight breaks its five-month downtrend
A trillion-dollar retailer fell 23.5% from its May record to its August low, punished after a report it beat. Since 6 October it is up 10%, the strongest of the consumer names, and it has broken the line that capped it since May. It gains when shoppers trade down and it uses AI rather than building it. Our read: the next hurdle sits at 118–122; a close above 122 opens the way back to the record zone near 134.
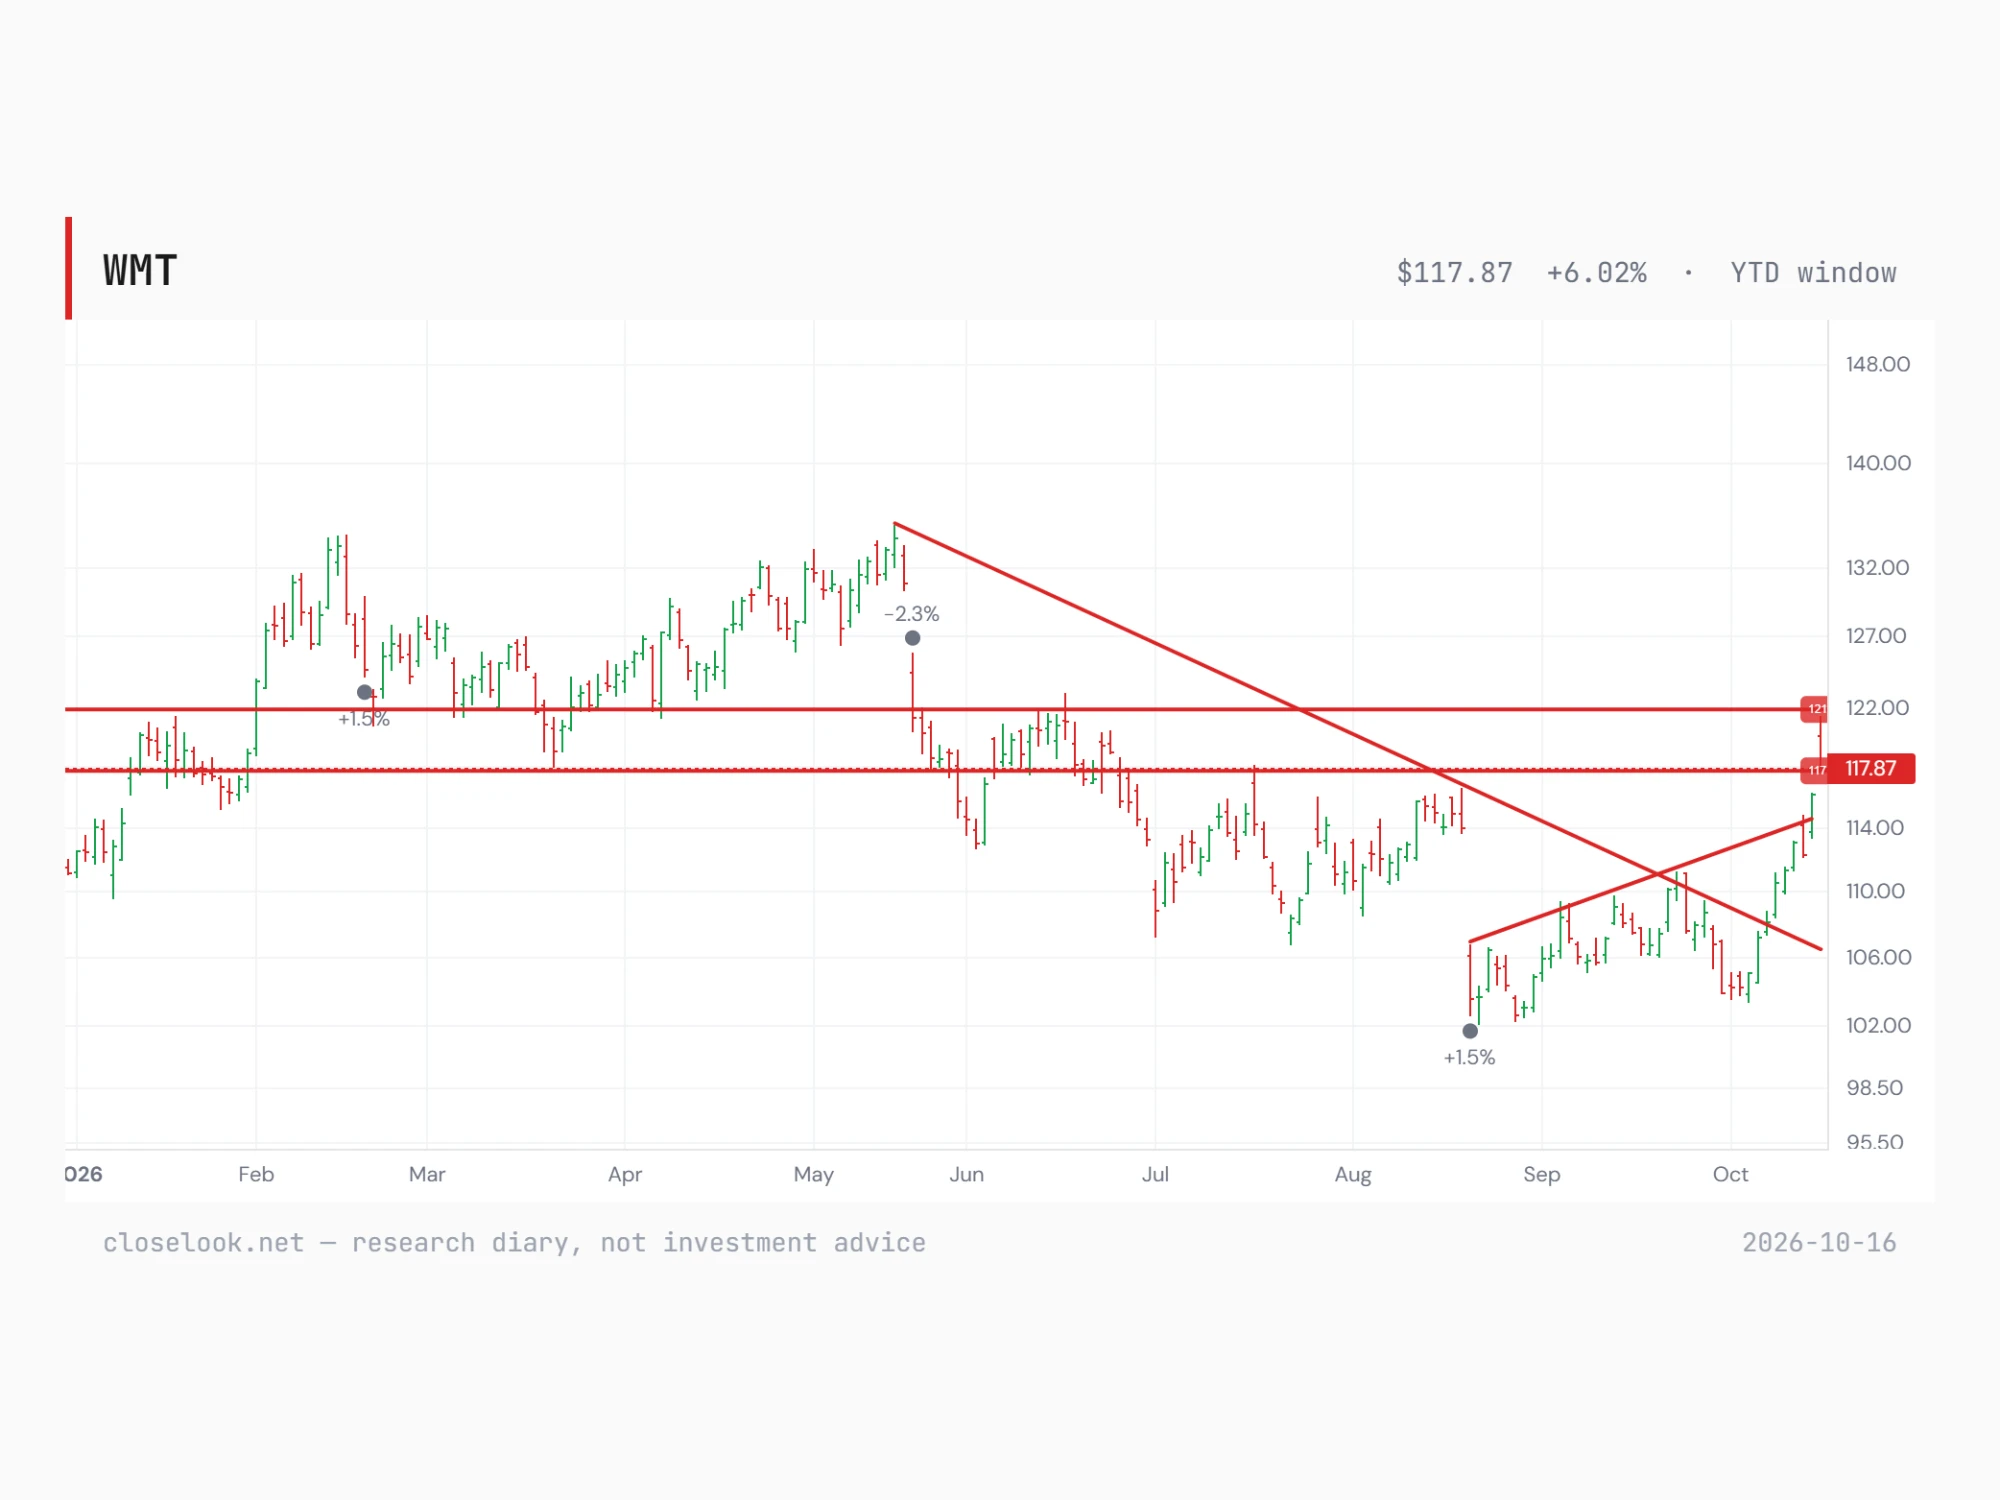
- Downtrend broken. The stock broke its falling line from the May record in early October and has risen in 9 of the last 12 sessions.
- Strongest consumer name since 6 October: +10.0%, against +6.0% for the staples sector, +1.5% for discretionary and −0.9% for the S&P 500.
- Wins when money is tight. With prices rising 3.7% a year, shoppers trade down; a broker upgrade this week cited faster grocery share gains.
- AI on the using side. Online sales +23% and advertising +38% last quarter; AI-assistant shoppers place about 35% larger orders — no data centres to pay for.
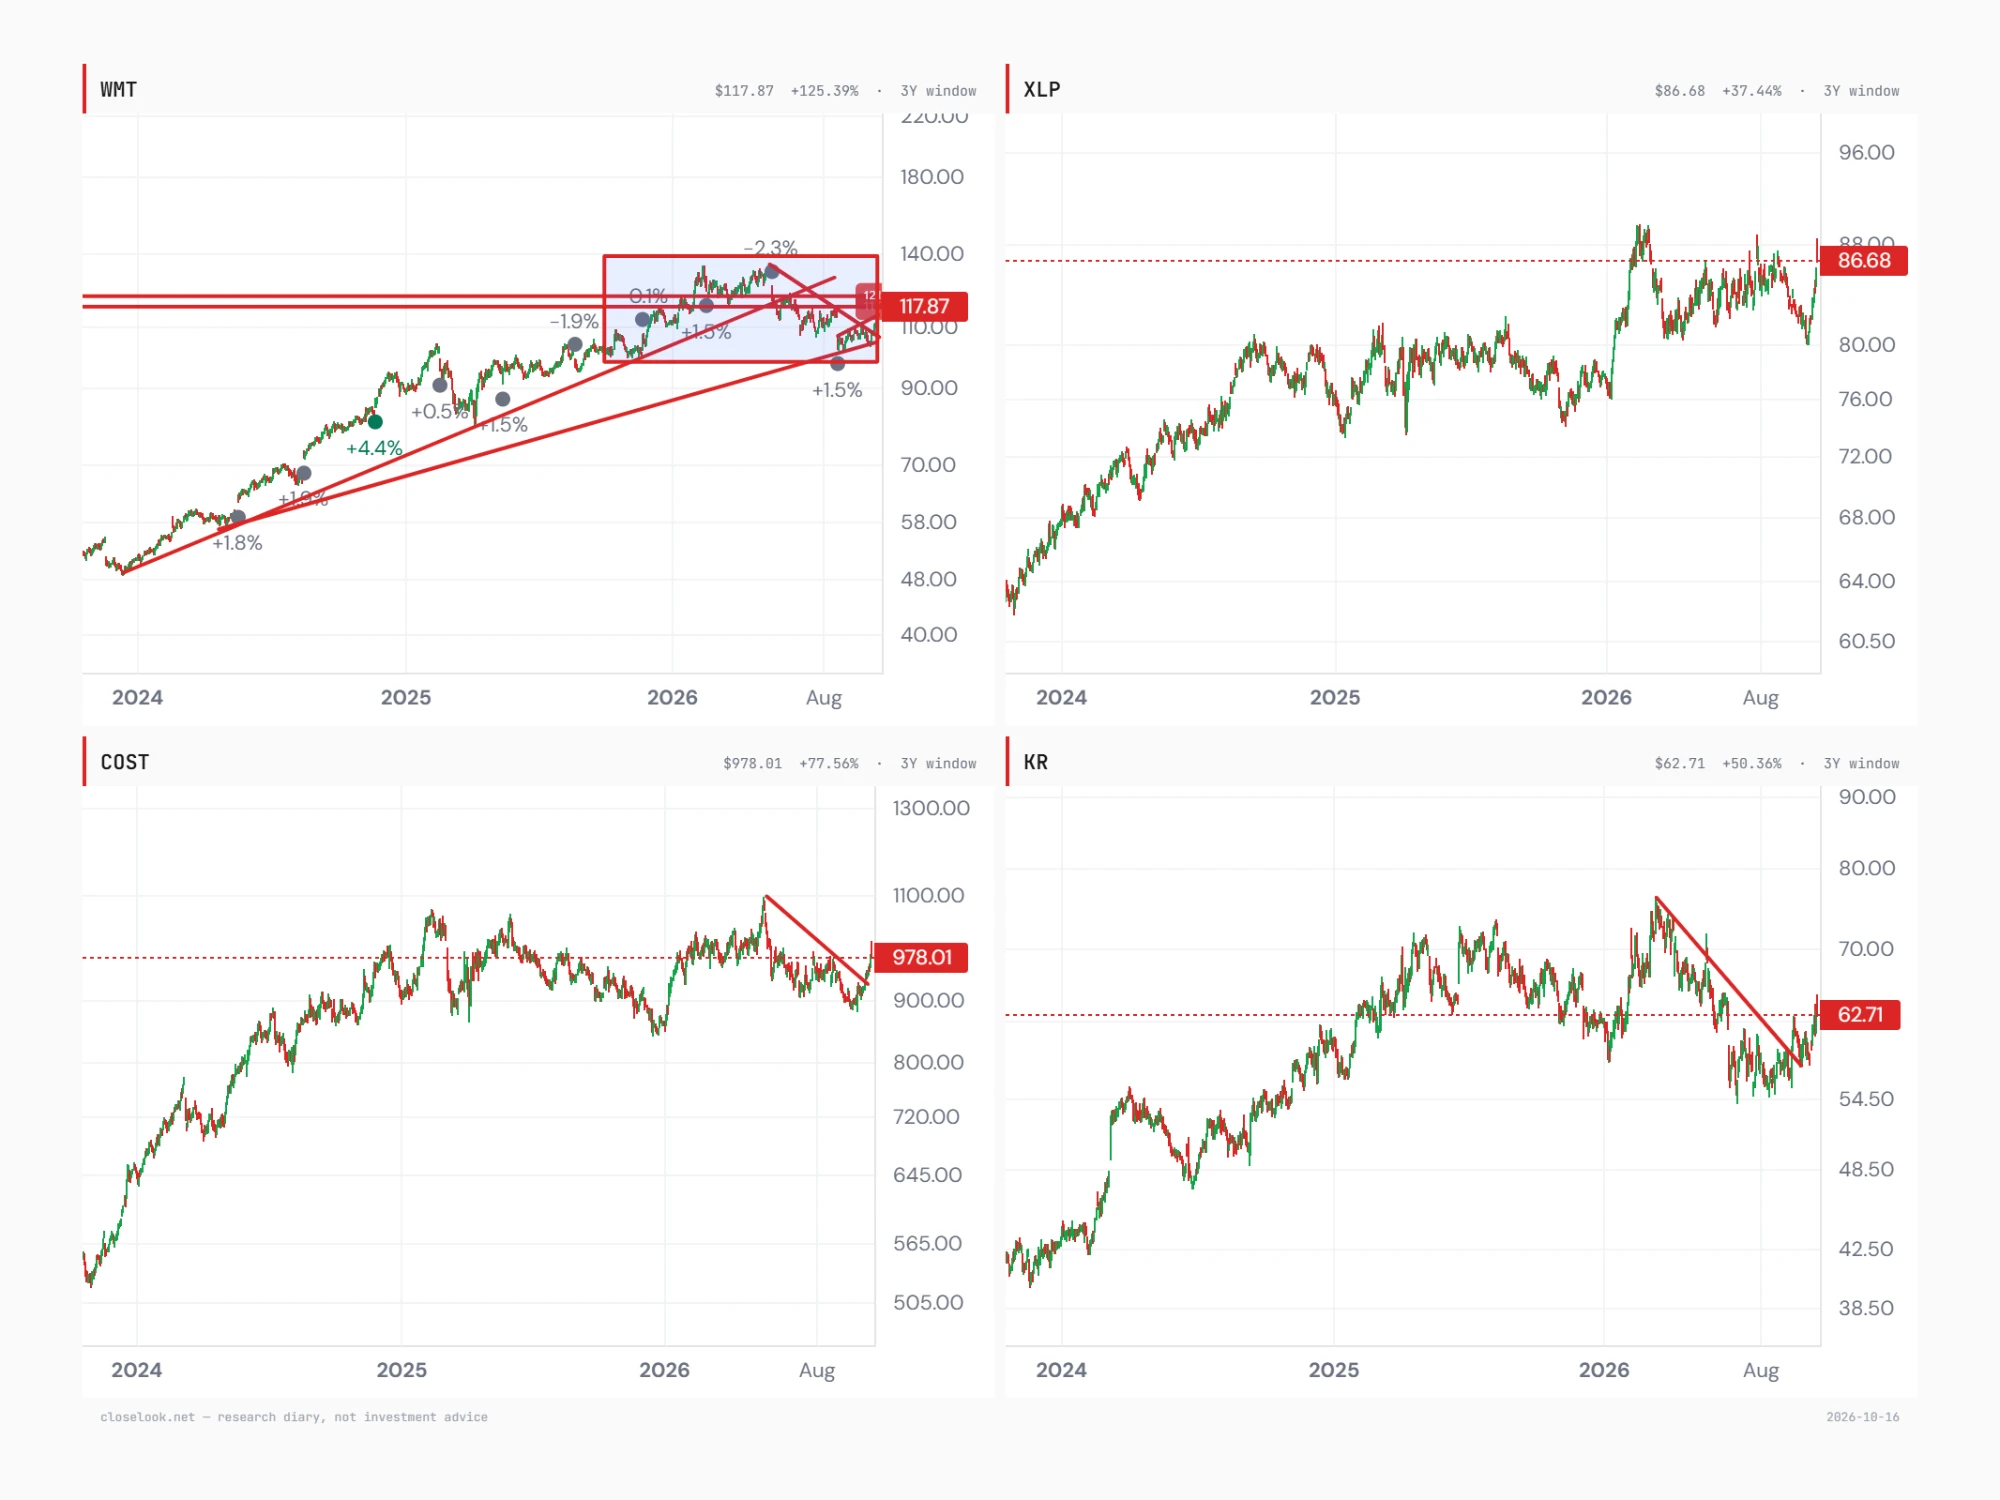
- Competitors confirm it. The two closest grocery rivals broke their own falling lines this week; the staples fund is back near its high.
- Three hurdles ahead: the 200-day average at 118, the old floor at 122 and the May record zone near 134.
WMT Walmart last close 117.87 (2026-10-15)
The Setup
The claim: Walmart is the rare company that wins on both sides of this market. When money is tight, shoppers trade down to it. When AI pays off, it is one of the companies using AI to sell more and spend less, not one spending billions to build it. After a five-month fall from its May record, the chart has turned with the rotation we describe in today's Daily Pulse.
Start with the money-is-tight side. September consumer prices rose 3.7% on the year, producer prices 6.3%. In that setting a grocery bill matters more than a gadget, and the retailer with the lowest prices gains share. That was the reason Deutsche Bank gave for raising the stock to buy on Wednesday, with a $136 price target, as reported: persistent inflation reinforces Walmart's value proposition and speeds up its grocery market-share gains. The S&P 500's two consumer sectors show the split. Consumer staples, the things people buy in any economy, are up 11.6% this year; consumer discretionary, the things people can put off, is down 5.0%.
Against the consumer sectors of the S&P 500
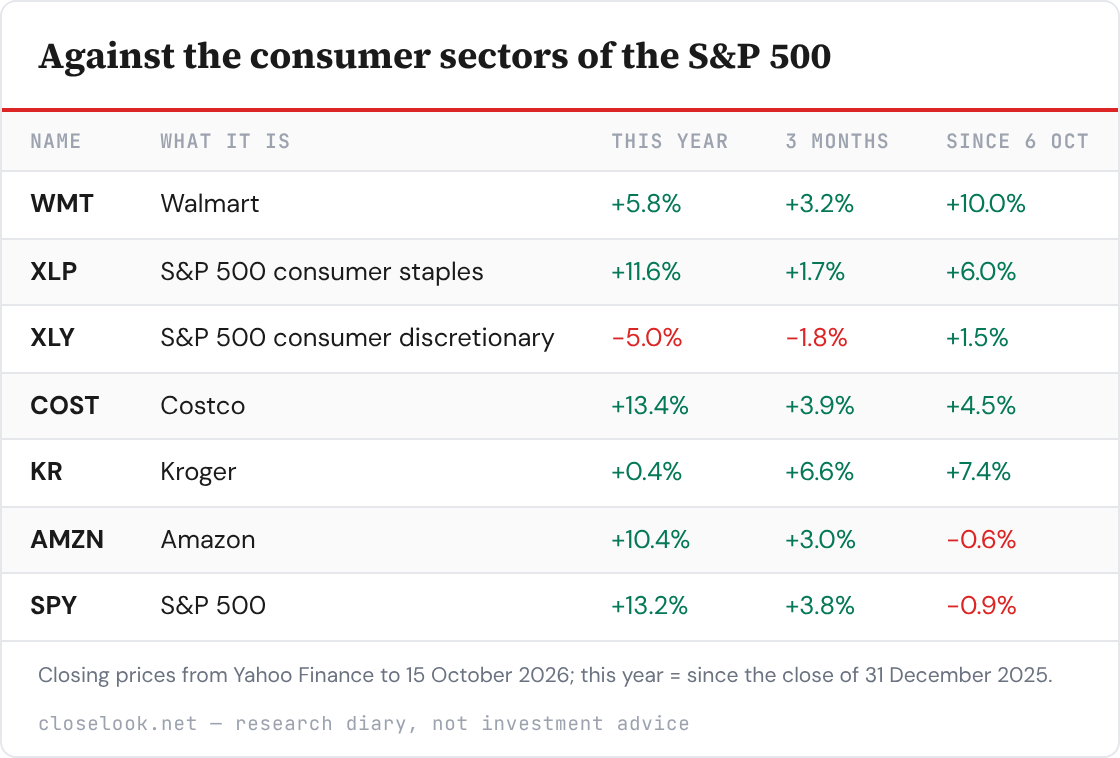
Table as text
| Name | What it is | This year | 3 months | Since 6 Oct |
|---|---|---|---|---|
| WMT | Walmart | +5.8% | +3.2% | +10.0% |
| XLP | S&P 500 consumer staples | +11.6% | +1.7% | +6.0% |
| XLY | S&P 500 consumer discretionary | −5.0% | −1.8% | +1.5% |
| COST | Costco | +13.4% | +3.9% | +4.5% |
| KR | Kroger | +0.4% | +6.6% | +7.4% |
| AMZN | Amazon | +10.4% | +3.0% | −0.6% |
| SPY | S&P 500 | +13.2% | +3.8% | −0.9% |
Closing prices from Yahoo Finance to 15 October 2026; this year = since the close of 31 December 2025.
Walmart itself has lagged its own sector this year (+5.8% against +11.6%) because of the punishment after its August report, but since 6 October it is up 10.0%, the strongest of the group. The grocers are moving together: Kroger is up 7.4% and Costco 4.5% since the record day.
An AI beneficiary on the application side
Walmart does not sell chips, servers or power. It uses AI, and cheaper, better AI makes the assets it already owns more valuable: the transaction data of hundreds of millions of shoppers, its supplier relationships, local inventory in about 4,600 US stores and the delivery network behind them. Rivals can use the same AI models; they cannot copy that network. Walmart can win without winning the race for the best model. In our language this is the Use end of the chain (Build → Operate → Use) — the end that gains when AI gets cheaper, and that the market is rewarding while it marks down the builders.
Walmart already uses AI in three places, as the company describes it:
- Inventory and logistics — better forecasts, fewer empty shelves and fewer markdowns, fuller trucks and shorter delivery routes.
- Employee productivity — software takes over merchandising analysis, customer-service and administrative tasks, lowering the cost of serving each customer.
- Shopping and advertising — better search and recommendations raise how often a visit becomes a sale and how much goes in the basket, and make ads more relevant.
The evidence so far is encouraging but not proof. In February management said shoppers using its AI assistant Sparky had average orders about 35% larger — a link, not proof that the assistant caused the extra spending. In the quarter to July global e-commerce grew 23% and advertising 38%; that supports the digital story, but not all of it is AI. Walmart does not report what AI adds to profit.
The reason it matters is scale. An extra half point of operating margin on $700 billion of revenue would be $3.5 billion of operating profit a year — simple arithmetic, not a forecast, and Walmart's revenue is already above that level. One caution: Walmart says it passes savings on to shoppers, so AI may show up first as lower prices and more market share rather than wider margins.
That is why we pick it this week. The rotation out of AI hardware needs a home that does not depend on AI spending; Walmart is that home and still a beneficiary if the AI story ends well.
In the Closelooknet readings
Said plainly: this is Walmart (Nasdaq: WMT), the world's largest retailer, with about 4,600 US stores, Sam's Club and a growing online and advertising business. It is a member of our T1 index of companies worth more than $1 trillion, where it is currently the largest weight. In the AI chain we follow — Build (chips, data centres) → Operate → Use — it sits firmly at the Use end. It also has a Print Record card: ten reports in a row met with a flat or positive reaction until August, when a beat was punished 9.15% on the day.
52-week range (closes): 100.61 – 134.2
The latest print
Last report — quarter to 31 July, published 20 August. Revenue rose 5.9% to $187.94 billion (5.1% at constant currency), ahead of the roughly $186.8 billion expected. Adjusted earnings were $0.81 per share. Global e-commerce grew 23% (US 24%), advertising 38% and membership income about 17%. Walmart raised its full-year outlook: net sales growth of 4–5% at constant currency (from 3.5–4.5%) and adjusted earnings of $2.80–2.87 per share (from $2.75–2.85). The market looked at one number instead: US same-store sales rose 2.6% against 3.5% expected, and the stock fell 9.15% that day. Refunds of earlier tariffs added about 7.5 points to operating income growth, as reported — a one-off.
Next report: 19 November (company calendar per our Print Record card), estimate $0.64 per share on about $187.4 billion of revenue. Same-store sales will again be the number.
The fundamentals
At $117.87 the stock trades at about 42 times the midpoint of this year's guided earnings ($2.80–2.87) — a premium price for a retailer, paid for steady growth, rising high-margin income (advertising, membership) and safety. Deutsche Bank's new target is $136, as reported. The stock is 12.2% below its record close of $134.20 (19 May) and 14.9% above its 2026 low close of $102.63 (27 August).
The chart, read by hand
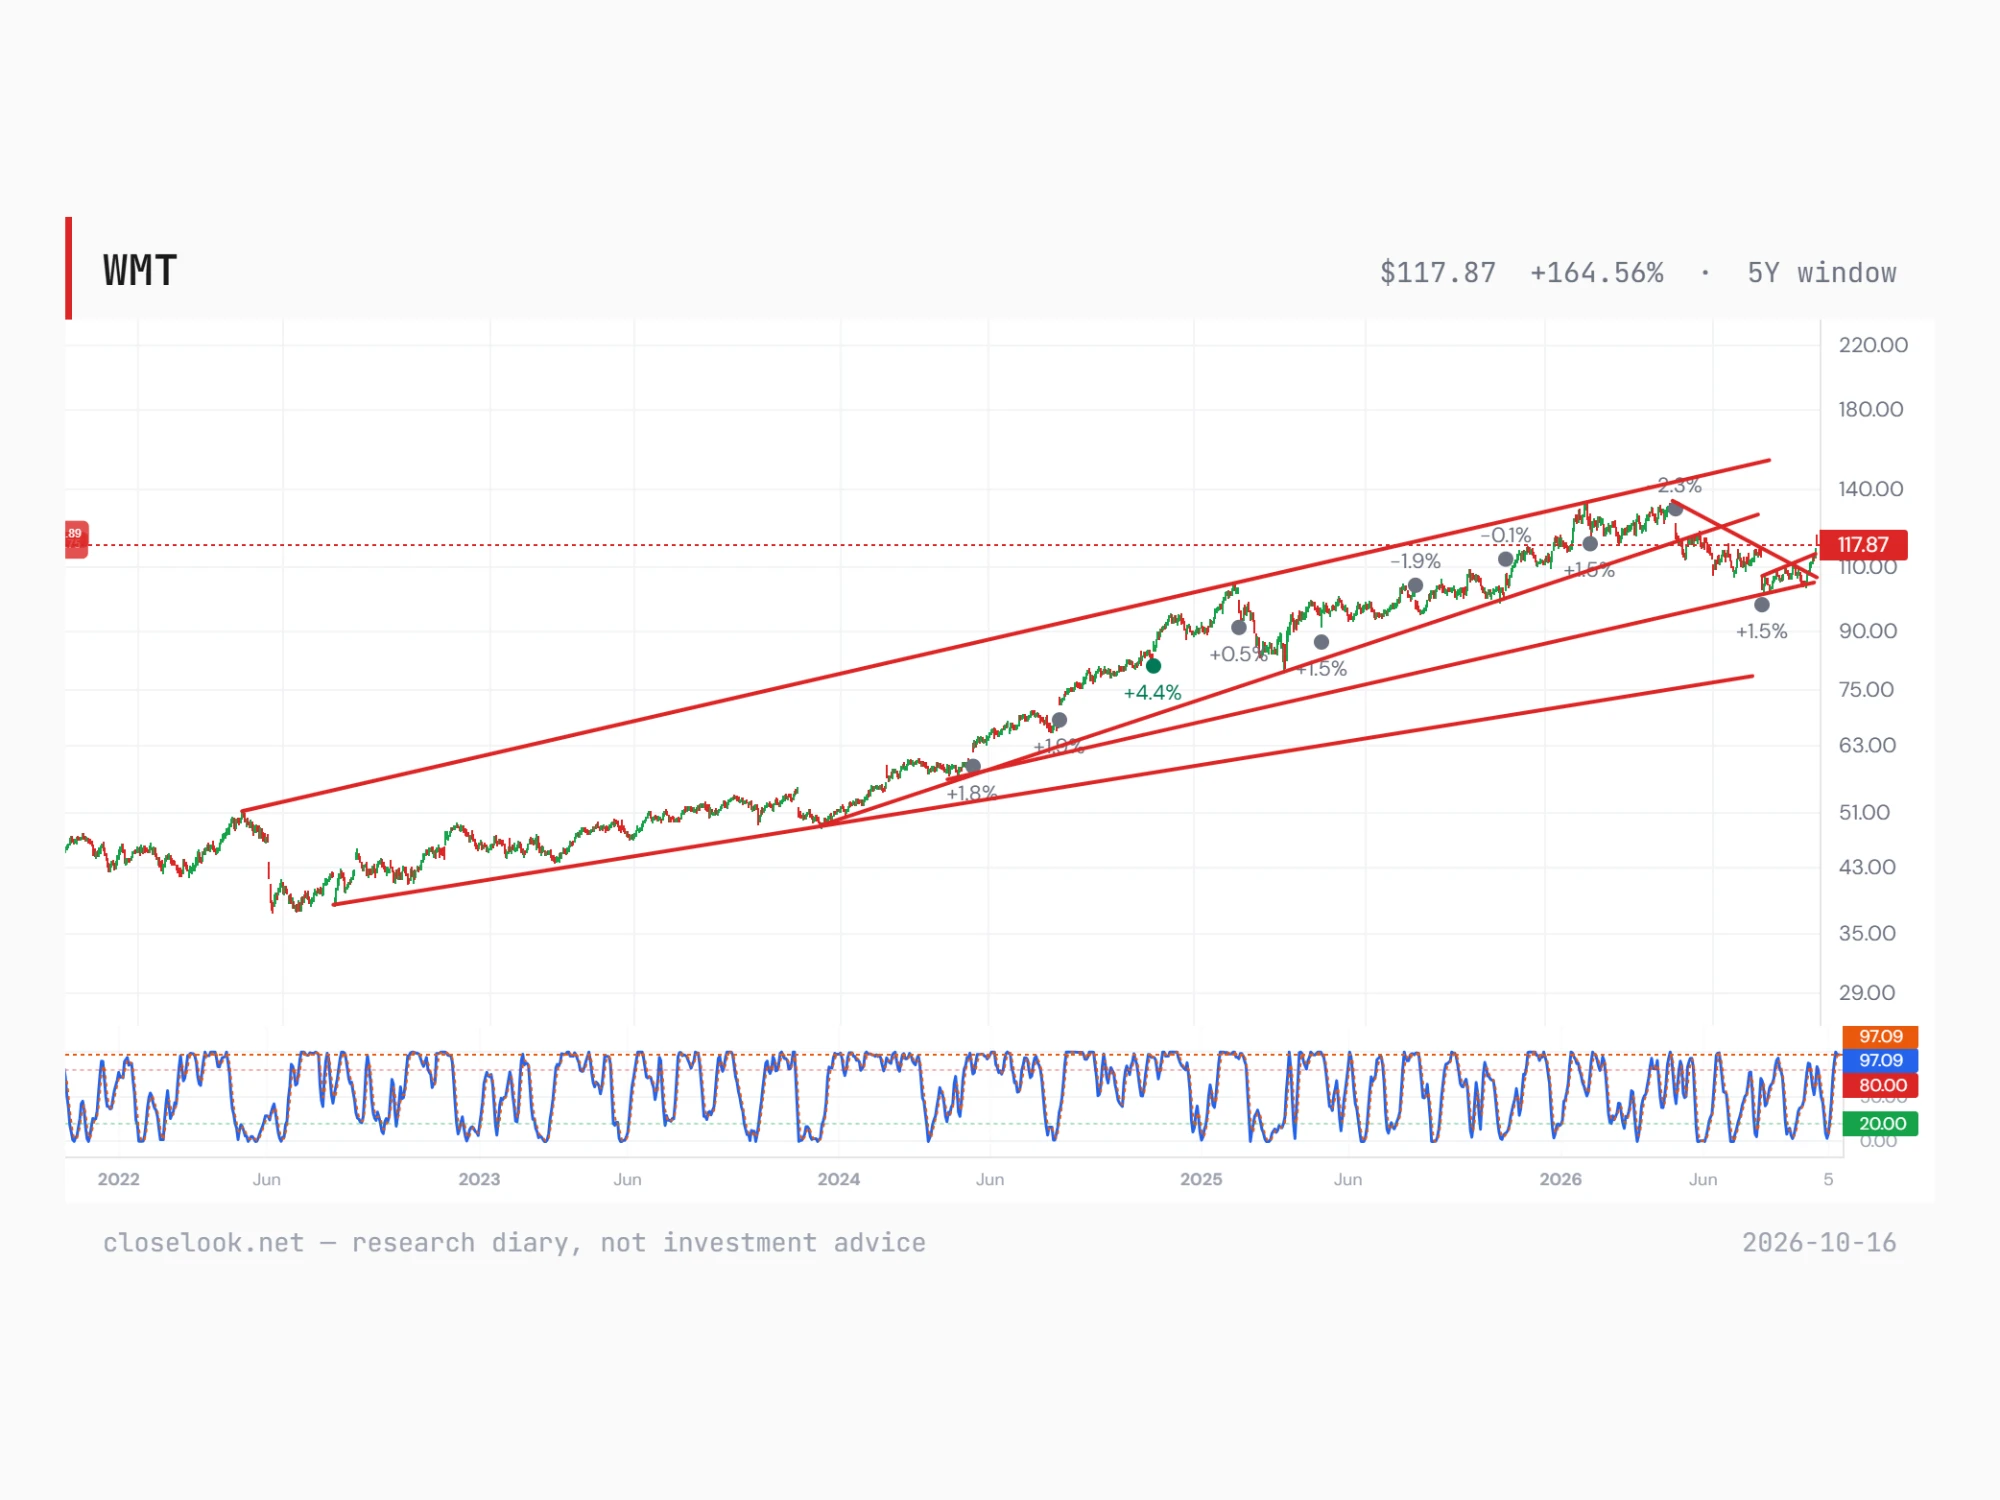
Trend: Five-year view: the rising channel from the 2022 low is intact. The steepest line from late 2023 broke in mid-2026, the fall from the May record stopped in August on the next, flatter line of the fan, and the price has turned up from there. This year: the falling line from the May high broke in early October; price then cleared the rising line from the August low and now stands at the horizontal line near $117.90, just under the 200-day average ($118.23). Thursday reached $121.38 intraday on the heaviest volume of the run and closed $3.50 lower — the first push into the $122 floor of February–May was refused.
Oscillators: Stochastic at 97 on the five-year chart — overbought after nine up days in twelve. A pause or pullback toward the broken lines (about $114, then $108–109 with the 50-day average at $108.78) would be normal and would not break the turn.
Elliott Wave count: Difficult to count cleanly. Most likely the stock is inside an extended wave 3 of the bull market that began in early summer 2022 (low $39.09 on 20 May 2022, split-adjusted). The consolidation since the May record — five months so far — is the longest pause of that bull market. Its depth fits a correction inside wave 3: the fall from $135.16 (19 May) to $102.15 (21 August), −24.4%, retraced 38.7% of the rise from the December 2023 low of $49.85 — almost exactly the 38.2% Fibonacci level at $102.57. Against the whole rise since 2022 it retraced only 34.4%; the 38.2% level there, $98.46, was never reached. Read that way, the pause is a rest before the next leg rather than the end of the trend. A close below the August low would put this count in doubt.
Key levels: $134.20 — record close (19 May); record zone 134–135 · $122 — floor of February–May, turned ceiling; Thursday's high $121.38 · $118.23 — 200-day average; $117.90 horizontal line · ~$114 — rising line from the August low, now support · $108–109 — broken downtrend line and 50-day average ($108.78) · $102.15 — August low (21 Aug, intraday), at the 38.2% retracement ($102.57) of the rise from December 2023; 2026 low close $102.63
What the machines say
Technical snapshot (as of 2026-10-15) — vs 20d — · vs 50d — · vs 200d — · off 52w-high -12.8% · stochastic K 80.5 / D 92.2 · Recovery attempt under the 200-day
Machine blocks render only where our engines actually cover the name — nothing is padded.
The risks, equal billing
What would prove us wrong. A close back below about $108 — the broken downtrend line and the 50-day average — would turn the breakout into a bounce inside the fall. Below $102.63 the August low and the lower fan line of the five-year chart would be gone.
The rotation can reverse. Much of the October move is money leaving AI hardware. If Microsoft and the cloud names show strong AI receipts from 28 October, some of it can flow back as fast as it came.
Price. About 42 times earnings leaves little room for another soft same-store-sales number on 19 November; August showed the market punishes even a beat.
AI may not reach the margin. Walmart passes savings on to shoppers, so AI may lift market share more than profit; and outside shopping agents could capture part of the customer relationship and the advertising money. What would strengthen the case: falling fulfilment cost per order, rising cash flow after investment, and operating profit growing faster once the tariff refunds are taken out.
Squeeze cuts both ways. Trade-down helps market share, but if consumers cut volume as well, even the cheapest store sells less; and August's operating income was flattered by one-off tariff refunds.
Our forecasts
Next 2–4 weeks: Overbought after nine up days in twelve: a pause or pullback toward $114 is the likely next step; holding above it keeps the turn intact.
Into 19 November: The report decides whether $122 breaks. Same-store sales above 3% would confirm the trade-down story; another 2.6% would cap the stock under $122.
12 months: With the five-year channel intact and the downtrend broken, a close above $122 opens the way back to the record zone near $134; a defensive grower that also uses AI should hold its premium while growth slows.
Diary views, not advice — held publicly alongside the scored record.
Why publish this name? Because our Directional Flow readings are what let us say it: stocks with this or a similar setup have often — historically — done well over the following twelve months. That is the engine's backtested observation about the past, not a forecast; past performance may not be an indication of future performance. Which is exactly why every pick is scored publicly against the tape from today, at one week, one month, three, six and twelve. 12-month view, written 16 October 2026 from the close of 15 October ($117.87). Diary, not investment advice.
Closelooknet publishes an investment research diary, not investment advice. Every pick is scored publicly against the tape at 1w/1m/3m/6m/12m from publication — the record, not the single call, is the product.
Open the live WMT terminal → All picks & the running record →
A note from the editor: the Weekly Chart Pick is free. Its price is one click — add Closelooknet as a preferred source on Google, and you support this work in Google Discover and Search every time you read.
Google opened in a new tab. Add Closelooknet there, then come back to this tab — the Chart Pick unlocks the moment you return.
The preferred-source setting lives in your Google account — if Google asks you to sign in first, you will land on the selection page right after. Google does not tell us whether you saved the selection. Clicking “Done” unlocks the Weekly Chart Pick on this device for 12 months.