Read · · 24 min read
A formal Lab Read companion to the Weekly Signal of 2026-05-10. The four-tier signal hierarchy, the 16-event timeline (2023-07-12 → 2026-05-12), the Rubin Build-Out sector overlay, and the forward calendar.
Closelook Pattern Library · Lab Read · Published 2026-05-12
A formal methodology paper companion to the Weekly Signal of 2026-05-10, Follow the Wise Men — Pattern 03 Preview.
1. The Investable Claim
NVIDIA's corporate equity deployments are a leading indicator for the Rubin Build-Out rotation.
The observation is simple. NVIDIA writes checks into sectors that (a) can lead the rotation, (b) have not yet led to their full extent, and (c) sit on top of a bottleneck NVIDIA needs to harden before its next product cycle ships. The window between the capital disclosure and the market fully pricing the bottleneck is what Pattern 03 measures.
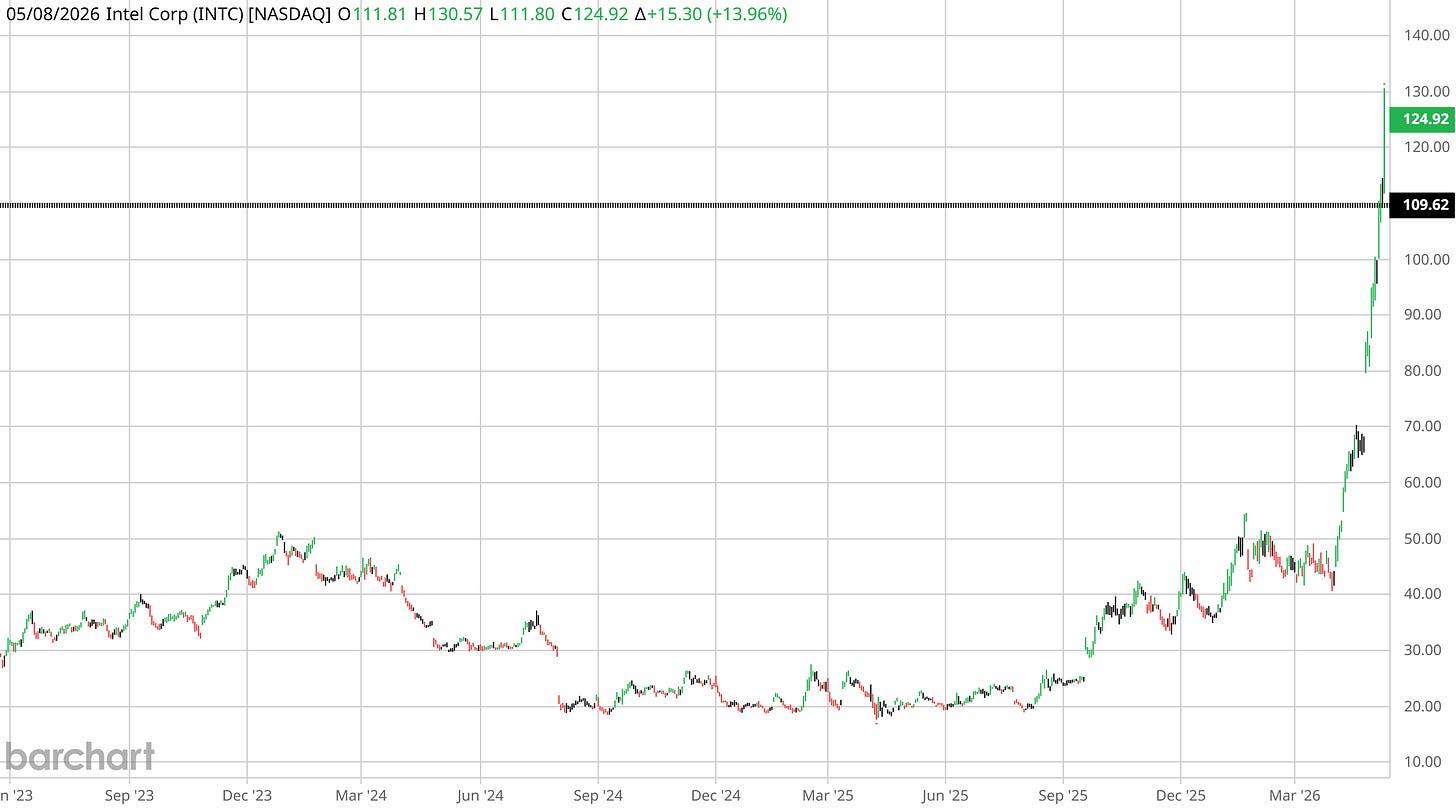
The case in point is Intel.
NVIDIA bought INTC common stock at $23.28 per share on September 18, 2025 — a $5 billion direct equity investment paired with x86 / RTX / data-center co-design under NVLink. INTC closed at $124.92 on Friday, May 8, 2026. That is +437% in seven months.
The announcement gap-up was +22%. The remaining roughly +415% accrued to whoever held the position through the seven months that followed. The popular meme — "Jensen speaks, stocks follow" — captures the +22%. Pattern 03 captures the +415%.
This dossier documents why the alternative information sources have a worse empirical track record than NVIDIA's published capital allocation (§2), the four-tier signal hierarchy that defines what Pattern 03 watches (§3), the additive equal-weight rule that defines how it acts (§4), the 16-event backtest from 2023-07-12 through 2026-05-12 (§5), the Rubin Build-Out 100 sector overlay that explains why certain names are admitted and others are deliberately not (§6), the forward calendar of high-leverage events through Q3 2026 (§9), and the Industrial AI Watchlist that flags the most likely vector for Pattern 03 v2 expansion (§10).
2. Why Not Read the Filings Yourself
The obvious alternative to Pattern 03 is the conventional one: read the 10-Ks, read the analyst notes, read the financial press, build a fundamental model, form an opinion. There are roughly 8,000 publicly listed US equities. NVIDIA's AI infrastructure stack alone covers more than a hundred candidate names across eighteen sectors. The work can be done. The empirical track record of the people who do it for a living does not warrant the effort.
The conventional sources, measured
The financial press produces news, not signal. A reporter writing about a $5 billion equity injection has the same headline word count as one writing about a routine product launch. The two events have different consequences. The headline does not distinguish them. Daily output is the job description; edge identification is not.
Sell-side analysts have a more measurable problem. A 2024 multi-dimensional study of analyst target prices found a mean absolute prediction error of 39.1% at the twelve-month horizon — and, more damning, only 54% of target prices correctly predicted the future direction of the price. Direction. Not magnitude. The broader literature is consistent: target-price errors are consistent, autocorrelated, non-mean reverting, and large, with prediction errors up to 46% even in developed markets. Sell-side research has utility in surfacing thesis material and earnings models. It does not have predictive validity in choosing which stock to own at what level.
Buy-side active managers have the same problem at scale. The S&P Dow Jones Indices SPIVA Scorecard — the industry-standard benchmark for active versus passive performance over twenty years of publication — reports that across the 20-year period 2005-2024:
- 94.1% of all US domestic funds underperformed the S&P Composite 1500
- 97.3% underperformed on a risk-adjusted basis
- Only 48.5% of those funds even survived the full 20-year window — the remainder closed or merged
The pattern repeats in real time. In the first half of 2025, 79% of actively managed large-cap US equity funds underperformed the S&P 500 — a fourteen-point worsening over the prior year. The problem with conventional alpha generation is not that it is occasionally hard. The problem is that, on the empirical record, at scale, it is almost never successful.
The better source
The asymmetric alternative. Within the AI infrastructure stack — and only there — there exists one actor whose track record on directional calls is materially better than 54%. That actor is NVIDIA, and specifically its CEO, Jensen Huang.
In 1993 Huang and two co-founders bet that graphics processing units, then a niche product for gaming and CAD workstations, would become the dominant architecture for general-purpose compute. The bet was contrarian for two decades. NVIDIA became the first $5 trillion company by market capitalization in October 2025.
In 2006 NVIDIA released CUDA, a parallel-computing platform without an obvious commercial use case at launch. CUDA became the substrate of the modern AI training and inference industry. In the early 2010s, after cuDNN bridged CUDA to deep learning, Huang wrote OIAL — Once-In-A-Lifetime Opportunity — on his whiteboard. NVIDIA's revenue has compounded at a roughly 70% annual rate from 2022 through 2026.
Huang coined and operationalized the AI factory framing in 2024; twelve months later, every hyperscaler capex disclosure used the term as a unit of account. He has consistently named the three concurrent platform shifts now confirmed in capex prints and partner adoption: general-purpose compute to GPU-accelerated, generative AI replacing classical machine learning, and agentic and physical AI emerging as the third leg.
The track record is not Jensen is always right — no one is always right. The track record is that on the structural calls within AI infrastructure, NVIDIA has been demonstrably more right, more often, than the consensus of sell-side analysts and active managers covering the same names.
That asymmetry is the methodological foundation of Pattern 03. The conventional method of reading every 10-K and every analyst note produces a 54% directional hit rate. The Pattern 03 method of reading NVIDIA's published capital allocation produces — over the 16-event log documented in §5 — a measurably better one. The KISS application is to use the better source.
Of two equally good solutions, the less complex one is better. Of two solutions where one is meaningfully better, the choice is not aesthetic.
3. The Four-Tier Signal Hierarchy
NVIDIA signals partner intent across four progressively softer tiers. Reliability as a buy signal moves inversely with the volume each tier produces in the public record.
| Tier | Name | Signal | Reliability |
|---|---|---|---|
| 1 | Capital | NVIDIA buys common stock, receives warrants, or holds explicit share-purchase rights. Documented in 8-K filings and quarterly 13F disclosures. | Hardest, most reliable. |
| 2 | Binding demand | Multi-year purchase commitments, capacity-access rights, named AI-factory deployment partnerships. No equity, but binding demand. | Very strong. |
| 3 | Architecture integration | Partner admitted to a named NVIDIA architecture layer — NVLink Fusion, Spectrum-X, DSX AI factories, AI-RAN, Vera/Rubin, BlueField, CUDA, Omniverse. | Medium. |
| 4 | Language | Jensen names a constraint repeatedly in keynote remarks, podcasts, or earnings calls — power, optics, packaging, cooling, simulation, networking, HBM — without concrete commitment behind the language. | Earliest, weakest. |
The popular meme conflates Tier 4 with Tier 1. It does not need to. Jensen's words are the loudest of the four signals and the weakest. Capital is the quietest signal and the most reliable.
Pattern 03 v1 admits Tier 1 and Tier 3 events into the cohort. Tier 2 is tracked but does not trigger entries. Tier 4 is ambient — useful for thematic framing, but never a position trigger.
The asymmetry between Tier 1 + Tier 3 (admit) and Tier 2 + Tier 4 (track / ambient) is structural. Tier 1 and Tier 3 both encode binding commitment with low ambiguity, and both produce paper trails that survive the initial price reaction — 8-Ks, 13Fs, NVIDIA newsroom releases, partner press confirmed by SEC filings. Tier 2 typically appears bundled inside Tier 1 events: Lumentum's capacity-access rights, Coherent's purchase commitments, and IREN's 5 GW deployment partnership all rode in on the same 8-Ks as the equity investments. When Tier 2 is the only signal, the disclosure usually describes a customer contract rather than a strategic alignment, and the partner often receives one product cycle of revenue rather than ongoing structural embedment.
Tier 4 is the noise floor. Treating Jensen quotes as buy signals turns Pattern 03 into a headline chase, which is what the popular meme produces. The empirical record is that the gap captured by chasing Tier 4 represents a small fraction of the total return that accrues to a Tier 1 or Tier 3 holder.
4. The Rule
Entry. Pattern 03 admits a public-equity ticker to the cohort when NVIDIA discloses a corporate equity stake or warrants (Tier 1) or admits the company to a named NVIDIA architecture layer (Tier 3 — e.g. NVLink Fusion). Public companies only. NVentures venture-arm portfolio bets do not count. Private companies (OpenAI, Anthropic, xAI, Mistral, Cohere, Wayve, Figure, Perplexity, Lambda, Reflection, Cursor) wait for IPO.
Sizing. Equal-weight at entry. Each new admission rebalances the cohort to 1/(N+1). Top-ups by NVIDIA — additional capital into a name already in the cohort — do not trigger additional buys. The position is the position.
Exit. Hold until one of: (a) NVIDIA divests, with disappearance from a 13F or trim greater than 50% read as the trigger, (b) NVIDIA announces a contradicting partnership that displaces the original, or (c) the security delists.
No stop-loss. No time-based exit. No technical-indicator gate. The rule reads NVIDIA's capital allocation, not price action.
5. The 16-Event Timeline (2023-07-12 → 2026-05-12)
The full event log records 13 admissions, 1 skip, and 3 closes across thirty-four months. The live cohort as of 2026-05-12 contains 10 names.
5.1 Admissions
| # | Date | Tier | Ticker | Company | Entry signal |
|---|---|---|---|---|---|
| 1 | 2023-07-12 | T1 | RXRX | Recursion Pharmaceuticals | $50M PIPE — AI drug-discovery partnership co-developing foundation models on NVIDIA hardware |
| 2 | 2023-09-14 | T1 | ARM | Arm Holdings | ~$147M — IPO anchor after the 2022 NVIDIA-Arm acquisition deal collapsed |
| 3 | 2024-09-05 | T1 | APLD | Applied Digital | $160M direct equity + AI-cloud GPU hosting partnership |
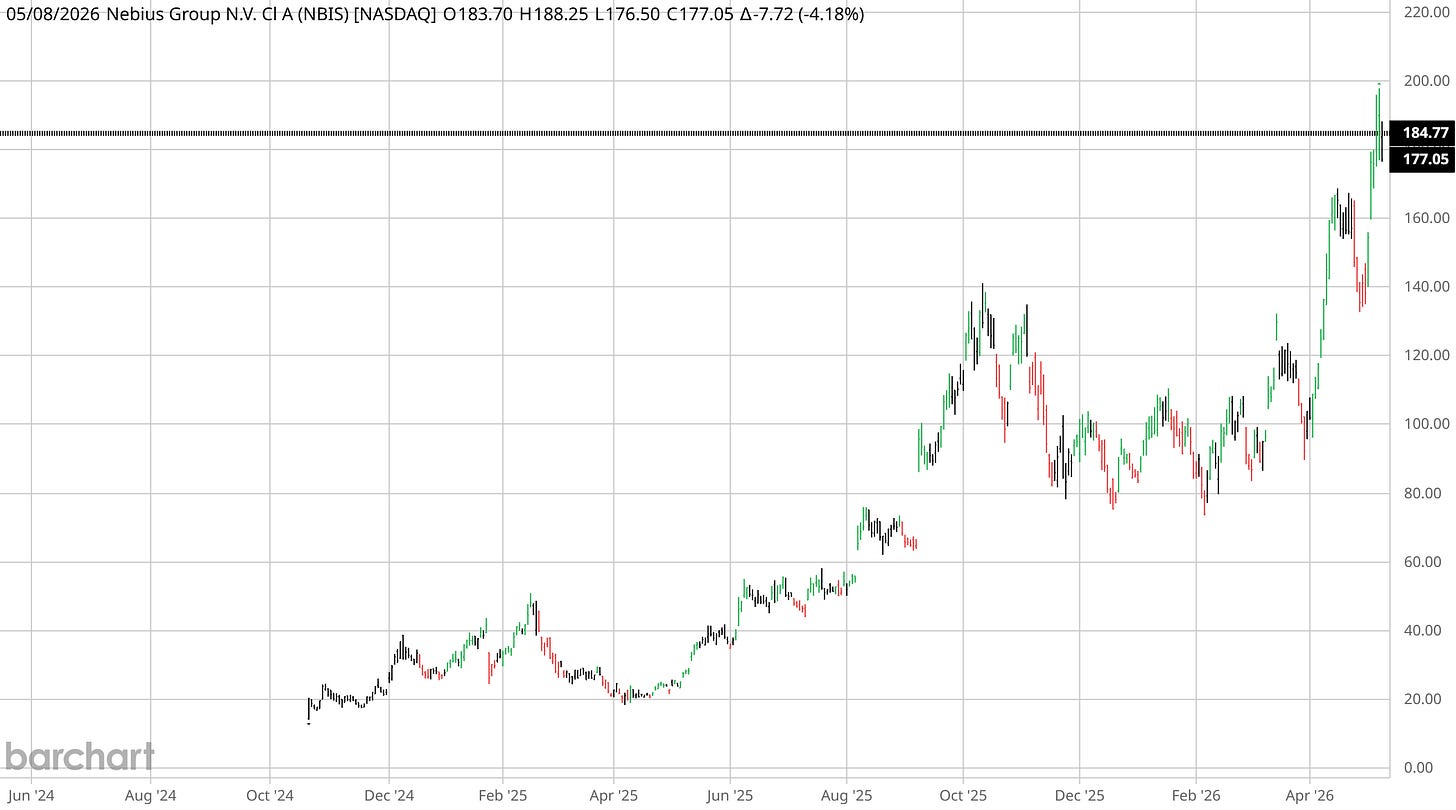
| 4 | 2024-12-02 | T1 | NBIS | Nebius Group | PIPE participation post-Yandex split; Nasdaq re-list 2024-10-21 |
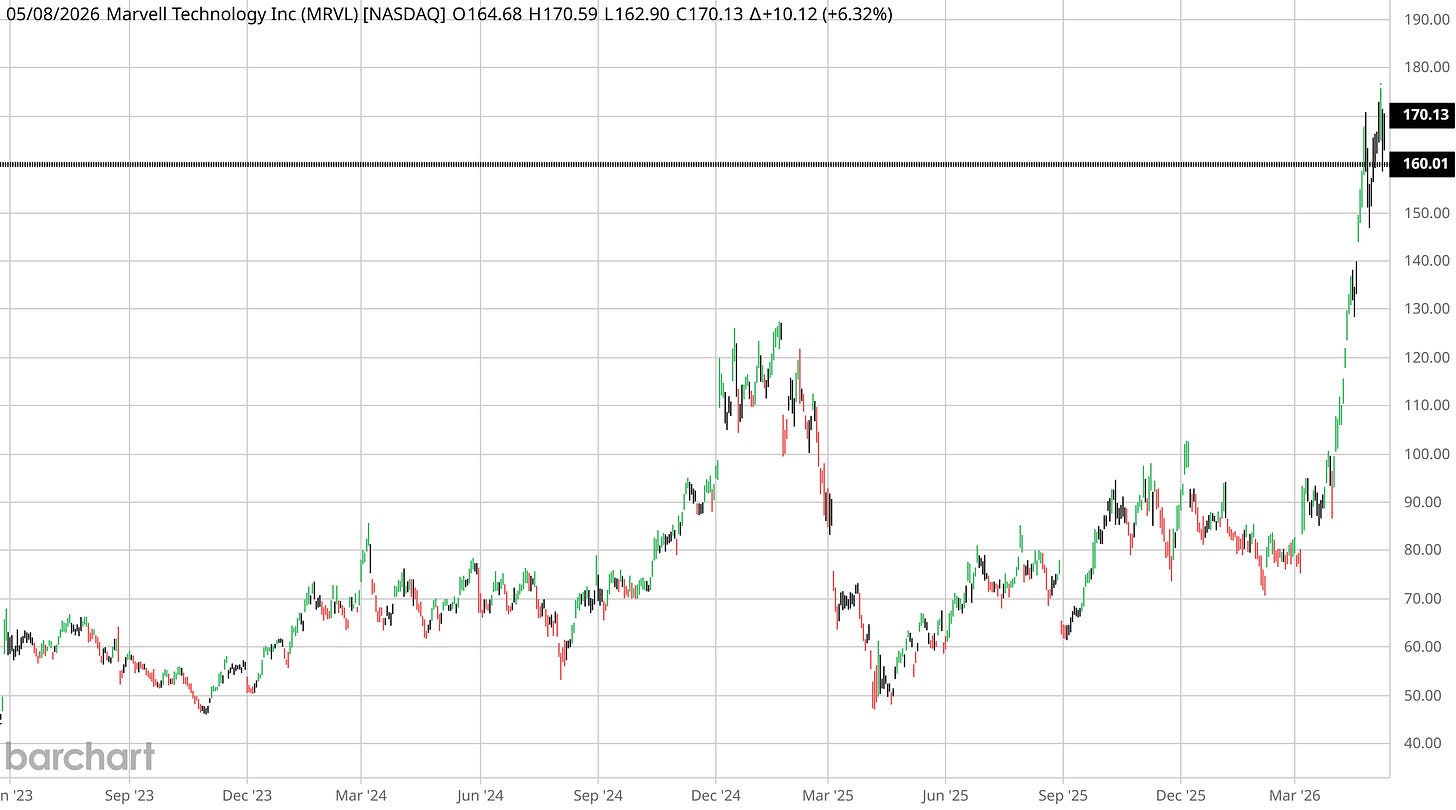
| 5 | 2025-03-17 | T3 | MRVL | Marvell Technology | NVLink Fusion launch partner at GTC 2025 — custom silicon + electro-optics admission to the named architecture layer |
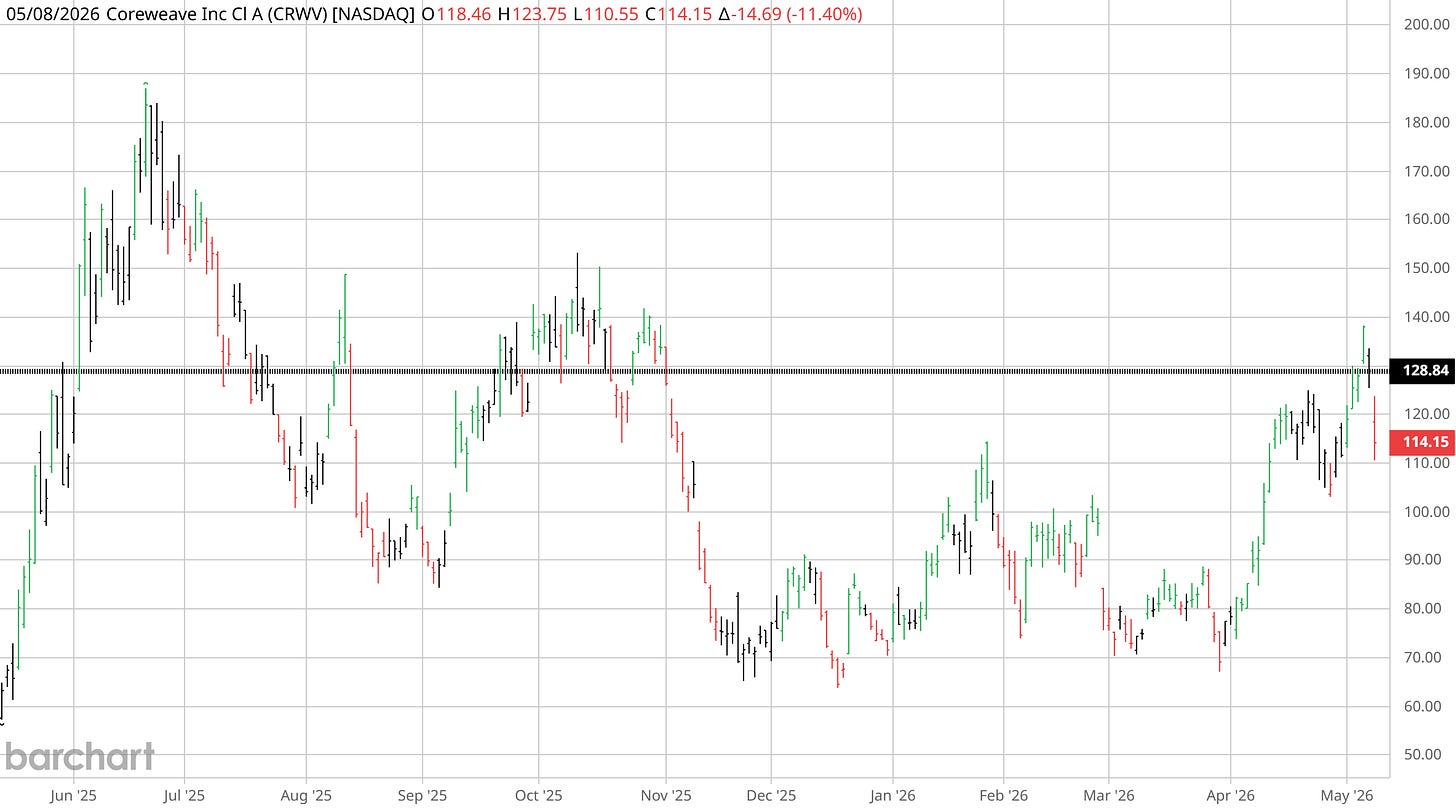
| 6 | 2025-03-28 | T1 | CRWV | CoreWeave | IPO anchor; NVIDIA had been pre-IPO Series A+ investor since April 2023 ($221M round) |
| 7 | 2025-09-18 | T1 | INTC | Intel | $5B at $23.28/share (~215M shares) + x86 / RTX / data-center co-design — the biggest single equity check NVIDIA has written |
| 8 | 2025-10-28 | T1 | NOK | Nokia | $1B equity via 166,389,351 newly-issued shares (~2.90%) + AI networking + 5G/6G RAN on NVIDIA architecture |
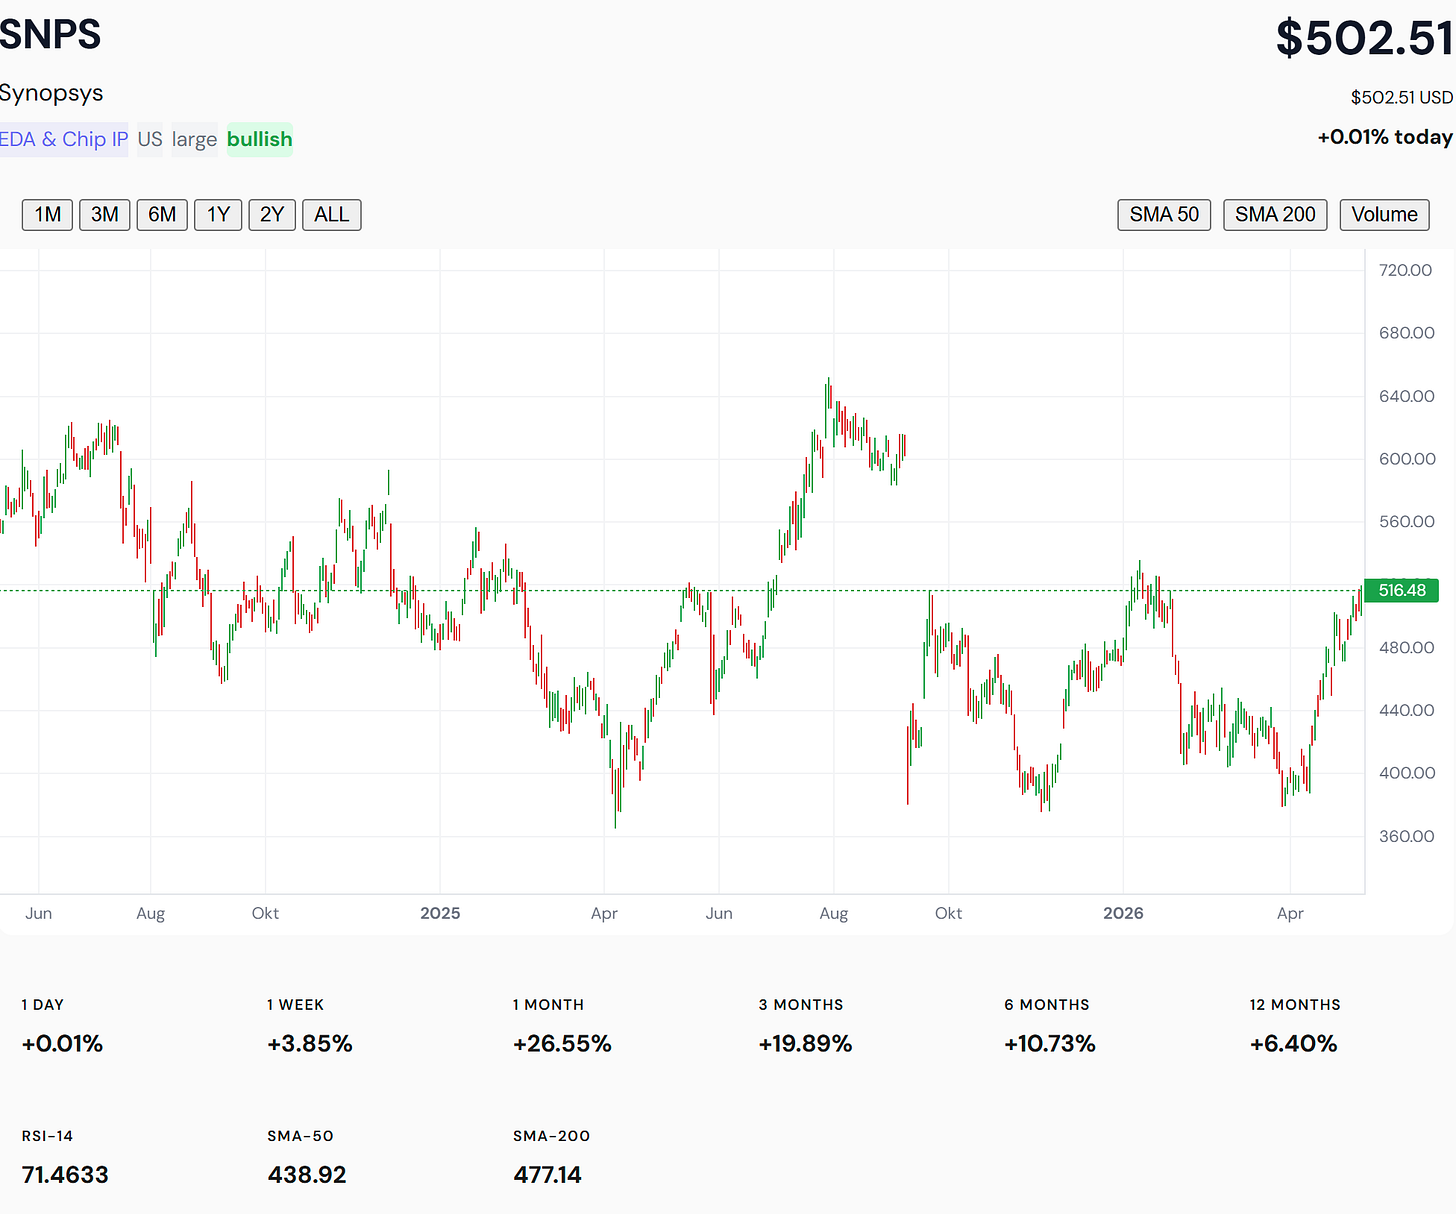
| 9 | 2025-12-01 | T1 | SNPS | Synopsys | $2B at $414.79/share + EDA / AI chip-design partnership (deepens the 2023 Synopsys.ai partnership) |
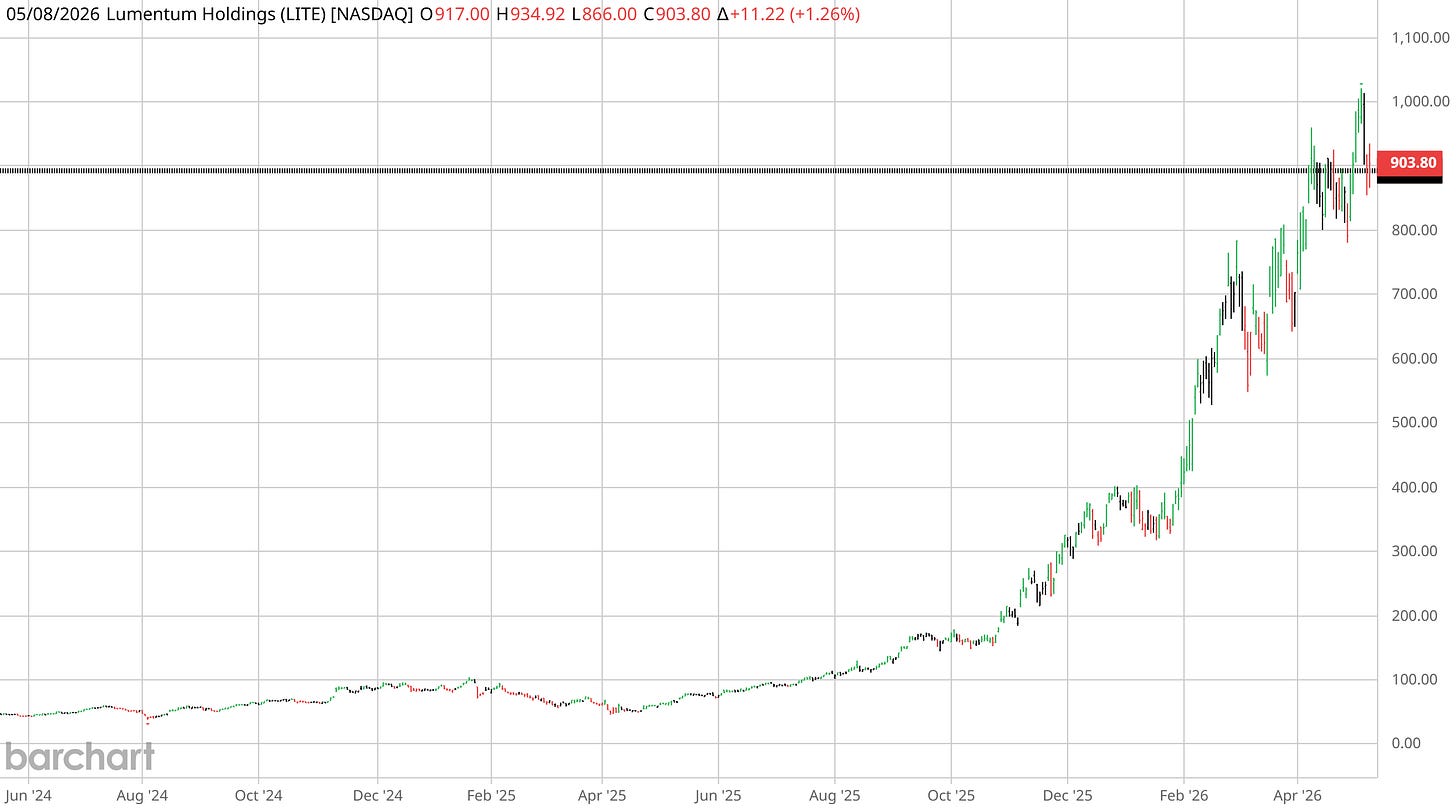
| 10 | 2026-03-15 | T1 | LITE | Lumentum | $2B + capacity-rights agreement + co-funded US fab — optics / photonics for AI factories |
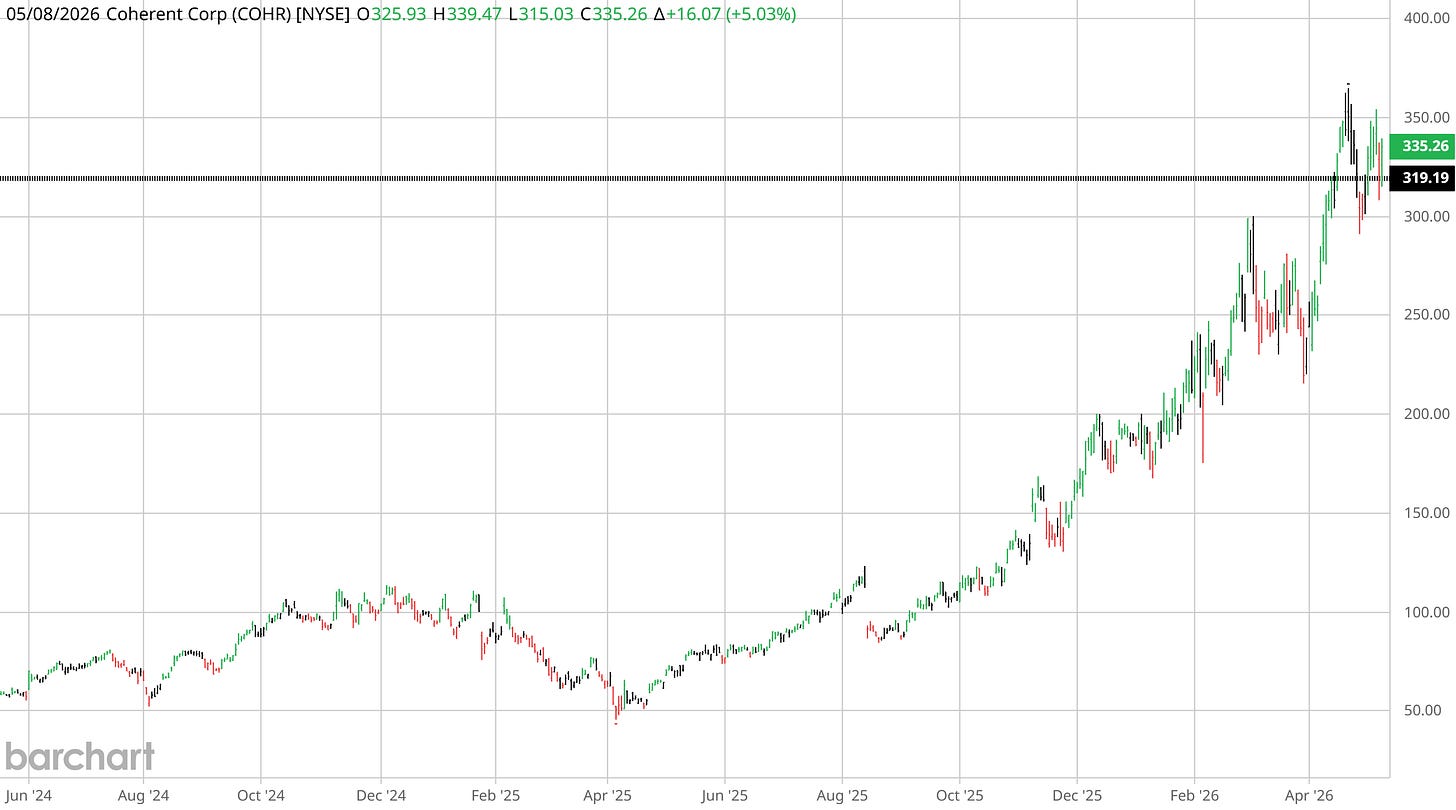
| 11 | 2026-03-15 | T1 | COHR | Coherent | $2B + co-development of optical interconnects + packaging (announced same day as LITE) |
| 12 | 2026-05-01 | T1 | IREN | Iris Energy | Rights for up to 30M IREN shares at $70 (up to $2.1B) — targets 5 GW of AI infrastructure |
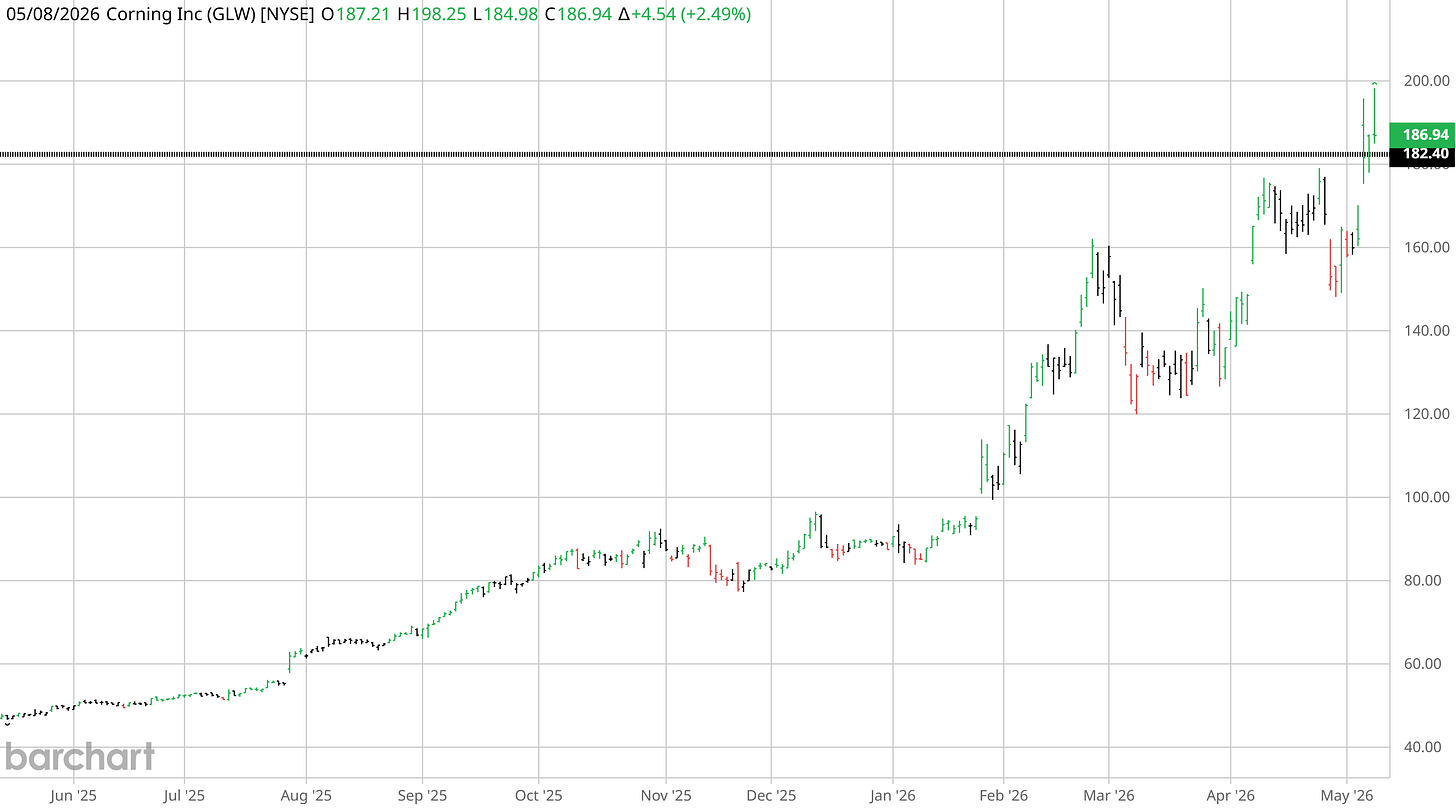
| 13 | 2026-05-06 | T1 | GLW | Corning | $500M for 3M shares at zero cost + warrants for 15M additional shares at $180 strike (up to $3.2B total) — 10× expansion of optical-fiber capacity |
5.2 The skip event
| Date | Ticker | What happened | Why skipped |
|---|---|---|---|
| 2026-01-13 | CRWV | NVIDIA additional $2B at $87.20/share (~22.9M shares) to accelerate >5 GW AI factory build-out by 2030 | CRWV already in cohort since IPO. Additive-only rule: top-ups do not trigger re-buys. The position is the position. |
5.3 Closes
| Date | Ticker | Trigger |
|---|---|---|
| 2025-08-14 | RXRX | Q2 2025 13F disappearance. NVIDIA had held the PIPE position from Q4 2023 through Q1 2025. |
| 2026-02-17 | APLD | Q4 2025 13F disappearance. The model Pattern 03 exit, held from Q3 2024 through Q3 2025. The reference case for the Exit Risk concept (see §8). |
| 2026-02-17 | ARM | Q4 2025 13F disappearance. Held continuously since IPO (Q4 2023 through Q3 2025). |
5.4 Live cohort (2026-05-12, 10 names)
COHR · CRWV · GLW · INTC · IREN · LITE · MRVL · NBIS · NOK · SNPS
INTC is shown above as Figure 1. The six remaining names with public charts available follow as Figures 2 through 7. IREN and NOK are part of the live cohort but charts are not included in this edition.
5.5 Reading the timeline
The 34-month event log decomposes into four distinct clusters.
The 2023 era — RXRX (July) and ARM (September). Early experimental positions taken before AI factory was the framing NVIDIA used. RXRX represented the AI-meets-vertical bet; ARM was the architecture bet that paid out in spite of the original M&A failing. Both closed in 2025-2026 13Fs.
The 2024 quiet stretch — only APLD (September) and NBIS (December) admitted, both in the AI-cloud / GPU-hosting bucket. NVIDIA was building the playbook quietly. Public attention was elsewhere.
The September 2025 inflection — INTC arrives. $5 billion is the largest single equity check NVIDIA has written. Three more Tier 1 events follow in 90 days (NOK, SNPS), and one Tier 3 admission (MRVL via NVLink Fusion) sits earlier in the year. The aggregate signal: NVIDIA shifted from experimental to programmatic deployment of its balance sheet.
The 2026 optics + power explosion — LITE and COHR on the same day (March 15), then IREN (May 1) and GLW (May 6) within five weeks. Six of the thirteen admissions sit inside the last fourteen months. Pattern 03 has accelerated, not stabilized. The most active week of the entire log is the one immediately preceding this dossier's publication.
The financial engine behind the cadence
The cadence is not stylistic. It is financial. NVIDIA's annual revenue ran around $27 billion in FY2023, doubled to $61 billion in FY2024, doubled again to roughly $130 billion in FY2025, and runs north of $200 billion for FY2026, with net income converting at over a third of revenue. The balance sheet that wrote a $5 billion check to Intel in September 2025 did not exist in 2022. The roughly $13 billion in combined Tier 1 capital commitments NVIDIA made in the eight months between September 2025 and May 2026 — INTC, NOK, SNPS, LITE, COHR, IREN, GLW, plus the CRWV top-up — is the direct output of the AI thesis NVIDIA articulated, validated, and was then paid for. The capital deployment cadence is enabled by the cash flow, and the cash flow is itself the validation of the thesis. As long as the AI build-out continues to scale through the Vera/Rubin and Feynman generations, the budget for Pattern 03 admissions grows with it. The 2024-2026 cluster is not the peak. It is the early run-rate.
6. The Rubin Build-Out Overlay
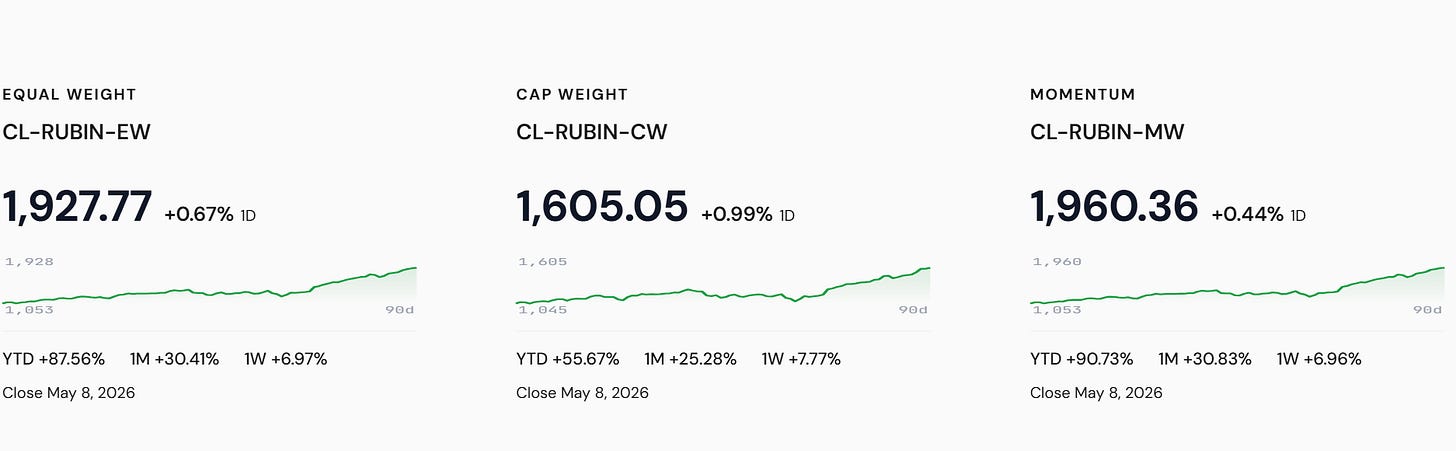
The Rubin Build-Out 100 is the Closelook structural index of 100 AI-infrastructure names organized into 18 sectors. As of the 2026-05-10 close:
- Rubin EW (Equal-Weight) at 1,927.77 — +87.56% YTD, +30.41% MoM
- Rubin MW (Momentum-Weighted) at 1,960.36 — +90.73% YTD
- Rubin CW (Cap-Weighted) trailing at +55.67% YTD — the breadth signature of a broad rally; this rally is not concentrated in the largest names
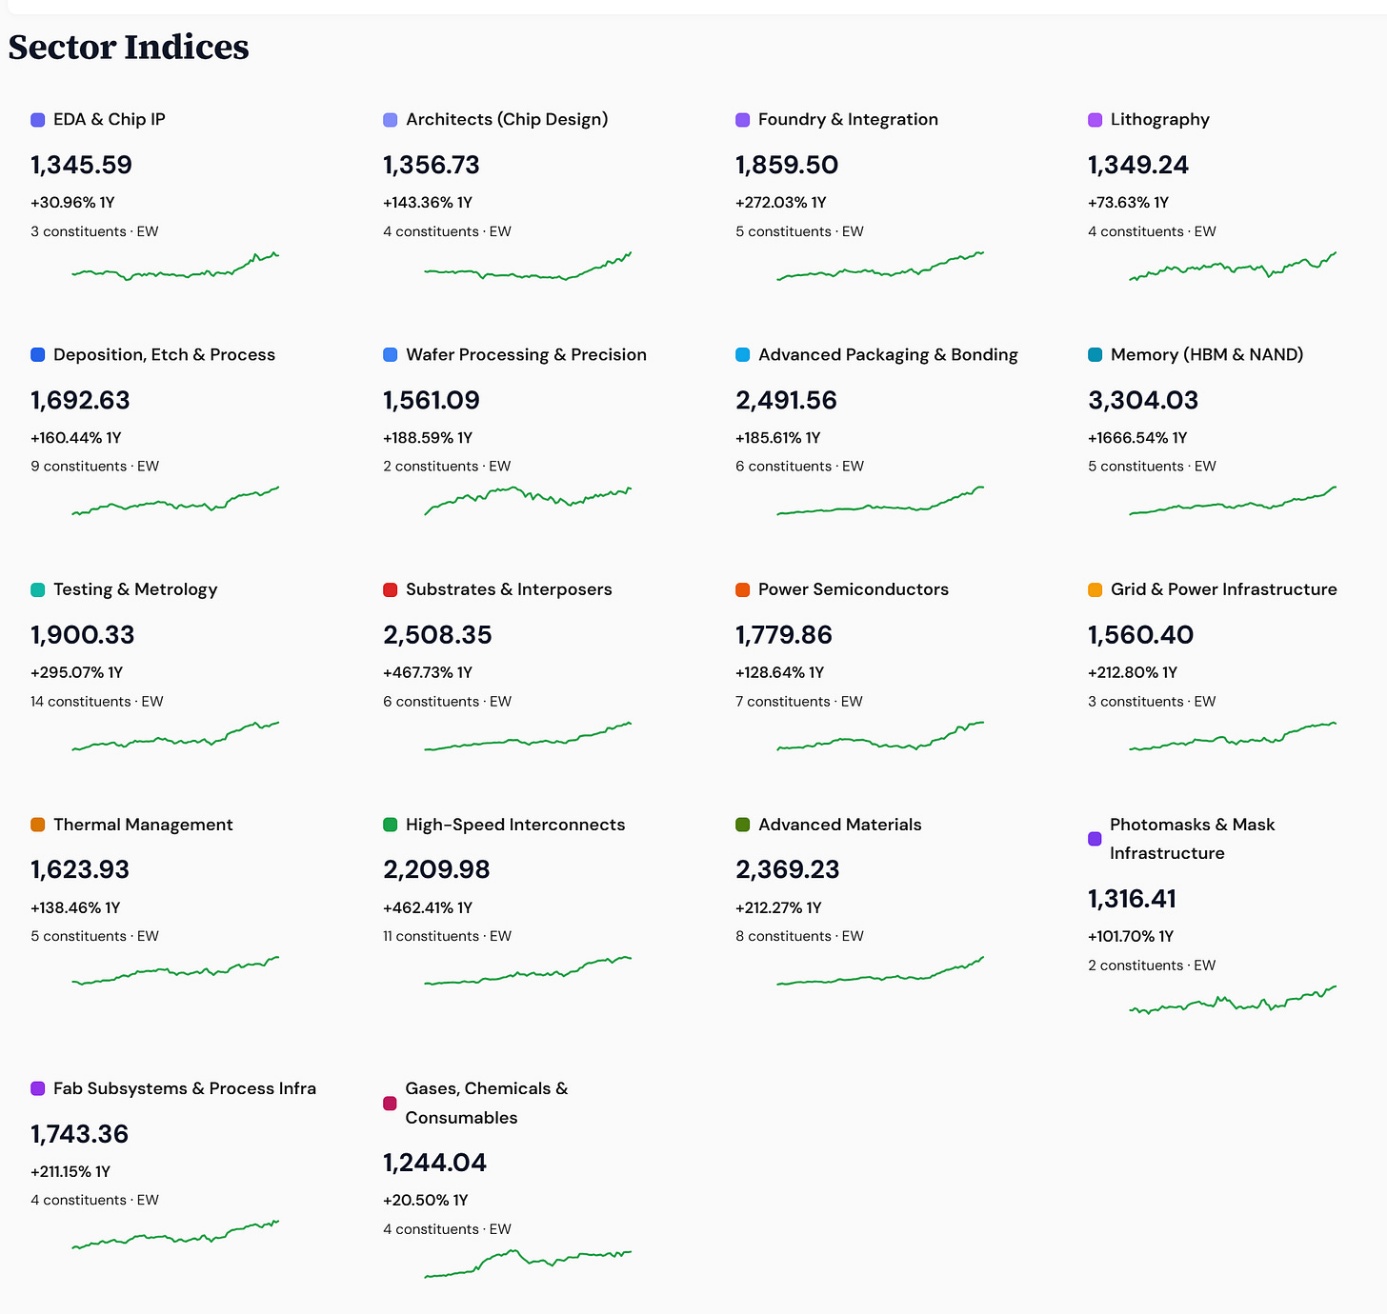
The 18-sector heatmap on a one-year basis shows the bottleneck stack speaking for itself:
| Sector | 1Y return | Pattern 03 names there |
|---|---|---|
| Memory (HBM + NAND) | +1,666% | — no NVIDIA stake |
| Substrates & Interposers | +468% | — TSMC CoWoS is vendor relationship, not equity |
| High-Speed Interconnects | +462% | LITE, COHR, MRVL |
| Testing & Metrology | +295% | — |
| Foundry & Integration | +272% | — TSMC vendor relationship, not equity |
| Grid & Power Infrastructure | +213% | IREN |
| Advanced Materials | +212% | GLW |
| Architects (Chip Design) | +143% | INTC |
| Lithography | +74% | — |
| EDA & Chip IP | +31% | SNPS |
| Gases, Chemicals & Consumables | +21% | — |
The asymmetry in this table is the dossier's most important single observation.
NVIDIA wrote zero checks for Memory. The sector is up +1,666% on a one-year basis — a sector-level seventeen-bagger. NVIDIA holds no direct equity in Micron, SK Hynix, or Samsung. They did not need to. The HBM supply chain was already structurally constrained, and the market priced the constraint without prompting. The same logic applies to Substrates & Interposers at +468% and to Foundry & Integration at +272%: TSMC CoWoS capacity was the singular bottleneck the entire industry was racing to fund. NVIDIA was the largest customer of that capacity, not an investor in it.
Where NVIDIA did deploy capital, the sectors are ones the market needed help seeing.
- Optics + Materials (High-Speed Interconnects +462%, Advanced Materials +212%) — LITE, COHR, MRVL, GLW. The Corning warrant strike at $180 — well above the prior close of $162 — marks the price NVIDIA expects the stock to reach. The investment is not a celebration of what already happened; it is a statement about what comes next.
- Grid & Power (+213%) — IREN. The bottleneck after optics is electrical. The IREN agreement gives NVIDIA the right to acquire 30 million shares at $70, a clean in-the-money position at current prices. The framework reads this as the second leg of Mid-Ramp.
- Architects + EDA (+143% / +31%) — INTC, SNPS. Not phase-rotation bets; structural-realignment bets. INTC for the CPU realignment around Vera/Rubin systems. SNPS for the engineering and simulation tax that scales as the rest of the stack accelerates. Different mechanism, same logic.
The constraint–capital–return alignment. Each admission in §5 traces back to a specific constraint in NVIDIA's own roadmap — bandwidth-density limits in optics, gigawatt-class power siting, the CPU-coupling realignment that NVLink Fusion requires, the design-complexity tax that scales with every node transition, and the operator layer that distributes NVIDIA's product into deployed workloads. The constraint comes first. The capital comes second. The stock return comes third.
NVIDIA does not invest everywhere, and the omissions are as informative as the admissions. Memory (+1,666%), Substrates & Interposers (+468%), and Foundry & Integration (+272%) all sit on top of the one-year leaderboard with no NVIDIA equity behind them. Those constraints were already structurally priced and required no intervention.
Where NVIDIA has acted, the selection has been rarely wrong. INTC at +437% in seven months. LITE on a near-twentyfold trajectory off its mid-2024 base. NBIS roughly ninefold off its late-2024 base. COHR more than sixfold off its early-2025 base. GLW trading above the $180 warrant strike four days after the deal was announced. MRVL through prior resistance on the NVLink Fusion admission. The three exits (RXRX, ARM, APLD) all closed before larger drawdowns rather than after — the rule's read-on-divestment fired in time.
NVIDIA does not need to be right about every name in the AI infrastructure stack. It only needs to be right about the names it touches. The 16-event log says it has been.
That asymmetry — constraint, capital, return — is what a leading indicator looks like when the three layers (signal × structural × timing) align. The mechanics of the stack itself are the subject of §7.
7. The Three-Layer Stack
Pattern 03 stops being a gap-up alert and starts behaving like a leading indicator only when three Closelook frameworks stack onto the same set of names.
| Layer | Source | What it reads |
|---|---|---|
| Signal | Pattern 03 (this dossier) | What NVIDIA is doing — capital, warrants, purchase commitments, architecture integration. The 16-event log. |
| Structural | Rubin Build-Out 100, 18 sectors | Which sectors can lead the rotation. The +1,666% Memory leader vs. the +21% Gases laggard tells you where dispersion sits. |
| Timing | Generation Rotation Framework | Which phase leads when. Each NVIDIA generation cycles Dawn (Equipment + EDA) → Early Ramp (Memory + Packaging + Substrates) → Mid-Ramp (Power + Cooling + Optical) → Sunset (architects flatten as the next generation begins to dominate the order book). |
All three are necessary. Signal alone is gap-up trading. Structural alone is sector-ETF buying. Timing alone is calendar speculation. The combination is the dossier.
The current state of the three layers reads consistently. Signal: thirteen admissions over thirty-four months, accelerating into 2026. Structural: an 18-sector index up +87.56% YTD with broad dispersion (+1,666% leader vs +21% laggard). Timing: Rubin in Early Ramp, with Pattern 03's recent admissions clustered in the Mid-Ramp anchor sectors that the framework predicts as the next leadership leg.
8. APLD as the Cautionary Tale
The most useful name in the Pattern 03 timeline is not one of the current ten. It is Applied Digital, ticker APLD, admitted on 2024-09-05 and closed on 2026-02-17.
NVIDIA's original disclosure was unambiguous: $160 million in strategic financing alongside Related Companies, paired with an AI-cloud GPU hosting partnership emphasizing accelerated compute, stranded power, and liquid cooling — every NVIDIA bottleneck keyword arranged in a single press release. The position appeared in three consecutive NVIDIA 13F filings.
Then it disappeared. The Q4 2025 13F, filed on February 17, 2026, showed no APLD position. Pattern 03 closed the line item on the filing date.
The post-disclosure price action is recorded for completeness — APLD traded materially lower in the months following the 13F exit — but the methodological point is not about the price. The methodological point is that a scanner with no Exit Risk concept is a graveyard. Such a scanner catches the admissions that prove the thesis and ignores the divestments that disprove individual cases. Pattern 03 includes the Exit Risk concept specifically to encode this asymmetry. The rule fires on both edges: admissions when NVIDIA's capital allocation says yes, exits when it says no longer.
APLD is the canonical reference. The rule does not assume NVIDIA's conviction is permanent.
9. Forward Calendar (Excerpt — First 90 Days)
The full forward calendar covers Tier 1, Tier 2, and Tier 3 events through Q4 2026 and is maintained as a separate operational document. The 90-day excerpt below covers the high-leverage events through Computex 2026 and the first post-Corning 13F filing.
Calendar note, July 2026: the forward calendar below has fully elapsed and is kept as the dated record of what the framework was watching.
| In | Date | Tier | Event | What to read |
|---|---|---|---|---|
| +3d | 2026-05-15 | T3 | Q1 2026 13F filing deadline | Whether LITE / COHR / MRVL / GLW / IREN show up on paper. How CRWV / INTC / NBIS / NOK / SNPS moved Q/Q. |
| +8d | 2026-05-20 | T1 | NVIDIA Q1 FY27 earnings, AMC | Optics capacity commentary; the $1T order-book remark from GTC March 18 — does it grow?; new partner names in prepared remarks or Q&A. |
| +20d | 2026-06-01 | T1 | GTC Taipei keynote — Jensen | Pre-billed Five-Layer Cake from energy to applications framing — a bottleneck taxonomy in its own right. Optics and grid partner mentions expected. |
| +21d | 2026-06-02 → 2026-06-05 | T1 | Computex 2026 | Historically the densest cluster of Tier-1 partner announcements on the calendar. |
| +94d | 2026-08-14 | T3 | Q2 2026 13F deadline | First post-Corning 13F. Confirms which of the May 2026 announcements have settled into the disclosure record. |
| +106d | ~2026-08-26 | T1 | NVIDIA Q2 FY27 earnings (estimated) | Largest single-event price reaction of the year historically. |
Three rhythmic series run alongside the dated events:
- Hyperscaler earnings (MSFT / GOOGL / META / AMZN, quarterly) — capex disclosures set NVIDIA's tape.
- Jensen interview cadence — historically one major podcast or interview per month across BG2, Acquired, the New York Times, Stratechery. Cadence breaks (six-to-eight-week gaps between appearances) read as content saved for a scheduled event.
- Partner 8-K filings — ad hoc, monitored via SEC EDGAR full-text search on the active cohort plus the named watchlist.
10. Industrial AI — The Next Wave to Watch
The Pattern 03 cohort to date concentrates in silicon, optics, infrastructure, and AI-cloud operators. The next leg of NVIDIA's partnership cadence runs into the physical world — the agentic and physical AI layer of Huang's three-platform-shift thesis. Pattern 03 v1 does not admit these names. v2 may.
Siemens is the most visible example. The partnership has deepened progressively since 2022 and reached its current scale at CES 2026 (January), when the two companies announced a joint Industrial AI Operating System — Siemens Xcelerator integrated with NVIDIA Omniverse libraries, the DSX blueprint, and NVIDIA AI infrastructure. The Siemens Electronics Factory in Erlangen, Germany is designated the first fully AI-driven adaptive manufacturing site, beginning in 2026. Siemens has committed several hundred industrial-AI specialists to the joint effort. Public customer references include PepsiCo, where the joint digital-twin work identifies up to 90% of potential issues before any physical modification. Other named industrial-AI partners disclosed at GTC, CES, or via NVIDIA newsroom releases include Schneider Electric (AI factory reference architectures, cooling, and power), Foxconn (manufacturing and EV production), and BMW (factory digital twins).
Why these are not admitted in v1. By the literal rule, Tier 3 admits — and the Omniverse / DSX integrations meet that test on its face. Pattern 03 v1 nevertheless holds these names out for two structural reasons.
Signal concentration. The Tier 3 admission already in the cohort (MRVL via NVLink Fusion) is a company whose business is substantively a function of the NVIDIA architecture. Siemens, by contrast, is a €60 billion diversified industrial conglomerate where the NVIDIA partnership is one revenue line among many; the signal-to-noise ratio for the stock is materially lower than for a silicon-photonics specialist.
Monetization vector. Industrial AI partnerships monetize through the partner's software and services portfolio — Siemens Xcelerator subscriptions, Schneider EcoStruxure deployments, Foxconn manufacturing contracts — rather than through NVIDIA's silicon ramp directly. The Pattern 03 thesis is that NVIDIA hardens its own supply chain through capital; industrial AI partnerships harden NVIDIA's reach into end-markets through software. Different mechanism, different signal.
The Industrial AI Watchlist. Tracked but not admitted. The current roster includes Siemens, Schneider Electric, Foxconn, BMW, and the broader Omniverse / DSX / Metropolis partner stack. A future Pattern 03 v2 may extend admission criteria — possibly with a concentration filter requiring NVIDIA-related revenue to exceed a meaningful threshold of the partner's total, or restricting admission to architecture launches where the partner is a named co-developer rather than a customer.
Forward catalysts. Mid-2026: the Siemens Digital Twin Composer launches on the Xcelerator Marketplace. 2026: the Erlangen AI-driven manufacturing site goes live as the first joint blueprint. January 2027: CES 2027, historically the densest cluster of industrial-AI partner announcements. Each subsequent GTC: robotics, Omniverse, DSX, Metropolis cadence.
If the industrial AI rotation produces the same kind of structural compounding that optics and AI-cloud produced over 2023-2026, Pattern 03 v2 will need a rule for capturing it. v1 deliberately leaves the door open.
11. What Pattern 03 Is Not
Stating boundaries is part of the methodology.
Pattern 03 is not a stop-loss strategy. No technical indicator, no drawdown threshold, and no time-based exit governs position closes. The only exit triggers are NVIDIA's own actions (13F disappearance, partnership displacement) or the security delisting.
Pattern 03 is not advice. The dossier records what NVIDIA has chosen to fund and what the resulting cohort has done. It does not recommend that the reader replicate the cohort, time entries against the cohort, or hedge against the cohort. Closelook is a research diary, not personalised advice.
Pattern 03 is not a forward forecast of NVIDIA's choices. The forward calendar in §9 lists events at which new admissions are statistically likely to be announced. It does not predict which admissions will occur or which partners will be named. The dossier reads NVIDIA's disclosures after they happen; it does not anticipate them.
Pattern 03 is not a substitute for the Rubin Build-Out 100. The Rubin index covers the 100-name structural universe; Pattern 03 covers the 10-name signal-driven cohort within it. The two are designed to be read together, not interchanged.
Pattern 03 is not a Tier 4 chase. Jensen quotes are tracked for thematic framing — which bottleneck is currently top-of-mind — but never as admission triggers. Tier 4 chases produce the gap-up. Pattern 03 captures what comes after.
12. The Discipline
Pattern 03 is a deliberately small idea, dressed in the right amount of structure to act on.
The rule reads three things: did NVIDIA put capital in, did NVIDIA admit the company to a named architecture layer, and did either status reverse. Everything else in this dossier — the four-tier hierarchy, the Rubin overlay, the three-layer stack, the forward calendar — exists to refine the read, not to find it.
INTC at +437% over seven months is not a gap-up story. It is a story about what the market still has not finished pricing — and what the next named partner, on the next 8-K, may extend.
Of two equally good solutions, the less complex one is better. Seven hundred years and one Skunk Works later, the rule has not lost anything.
Follow the wise men.
Closelook Pattern Library · Pattern 03 — NVIDIA Strategic Authority Investment
Methodology · 16-event backtest · Forward calendar excerpt
Companion to the Weekly Signal of 2026-05-10, Follow the Wise Men — Pattern 03 Preview
Live cohort, sector overlays, and the full Rubin Build-Out 100 index are maintained at closelook.net/indices/rubin/