Daily Pulse · · 08:30 NY · 8 min read · market · SOXX


In this edition
Yesterday's edition mapped three hard-asset ladders rung by rung; today the page turns back to the complex that has carried this market, because its chart has arrived somewhere specific. All four US semiconductor ETFs — XSD, SOXX, SMH and SMHX — closed Monday sitting back on the rising trendline drawn from their April lows. Four different construction methods, four different weighting schemes, one shared line.
That is why a four-panel grid runs with this edition rather than a single chart. When an equal-weighted small-and-mid fund, a mega-cap-weighted fund, a classic large-cap semiconductor fund and a fabless-only fund all sit on the same trendline in the same session, the touch is a property of the complex rather than of any one construction. From here the geometry offers two outcomes and no third: a bounce off the line, or a break of the trend with a move back toward the end-of-July lows.
This edition is a description of that setup. Where each fund sits, how it got there in Monday's session, which two events fall inside the window that resolves it, and what the marked levels are on both sides. All figures are close-to-close through Monday's US close unless the line says otherwise.
Four funds, one line
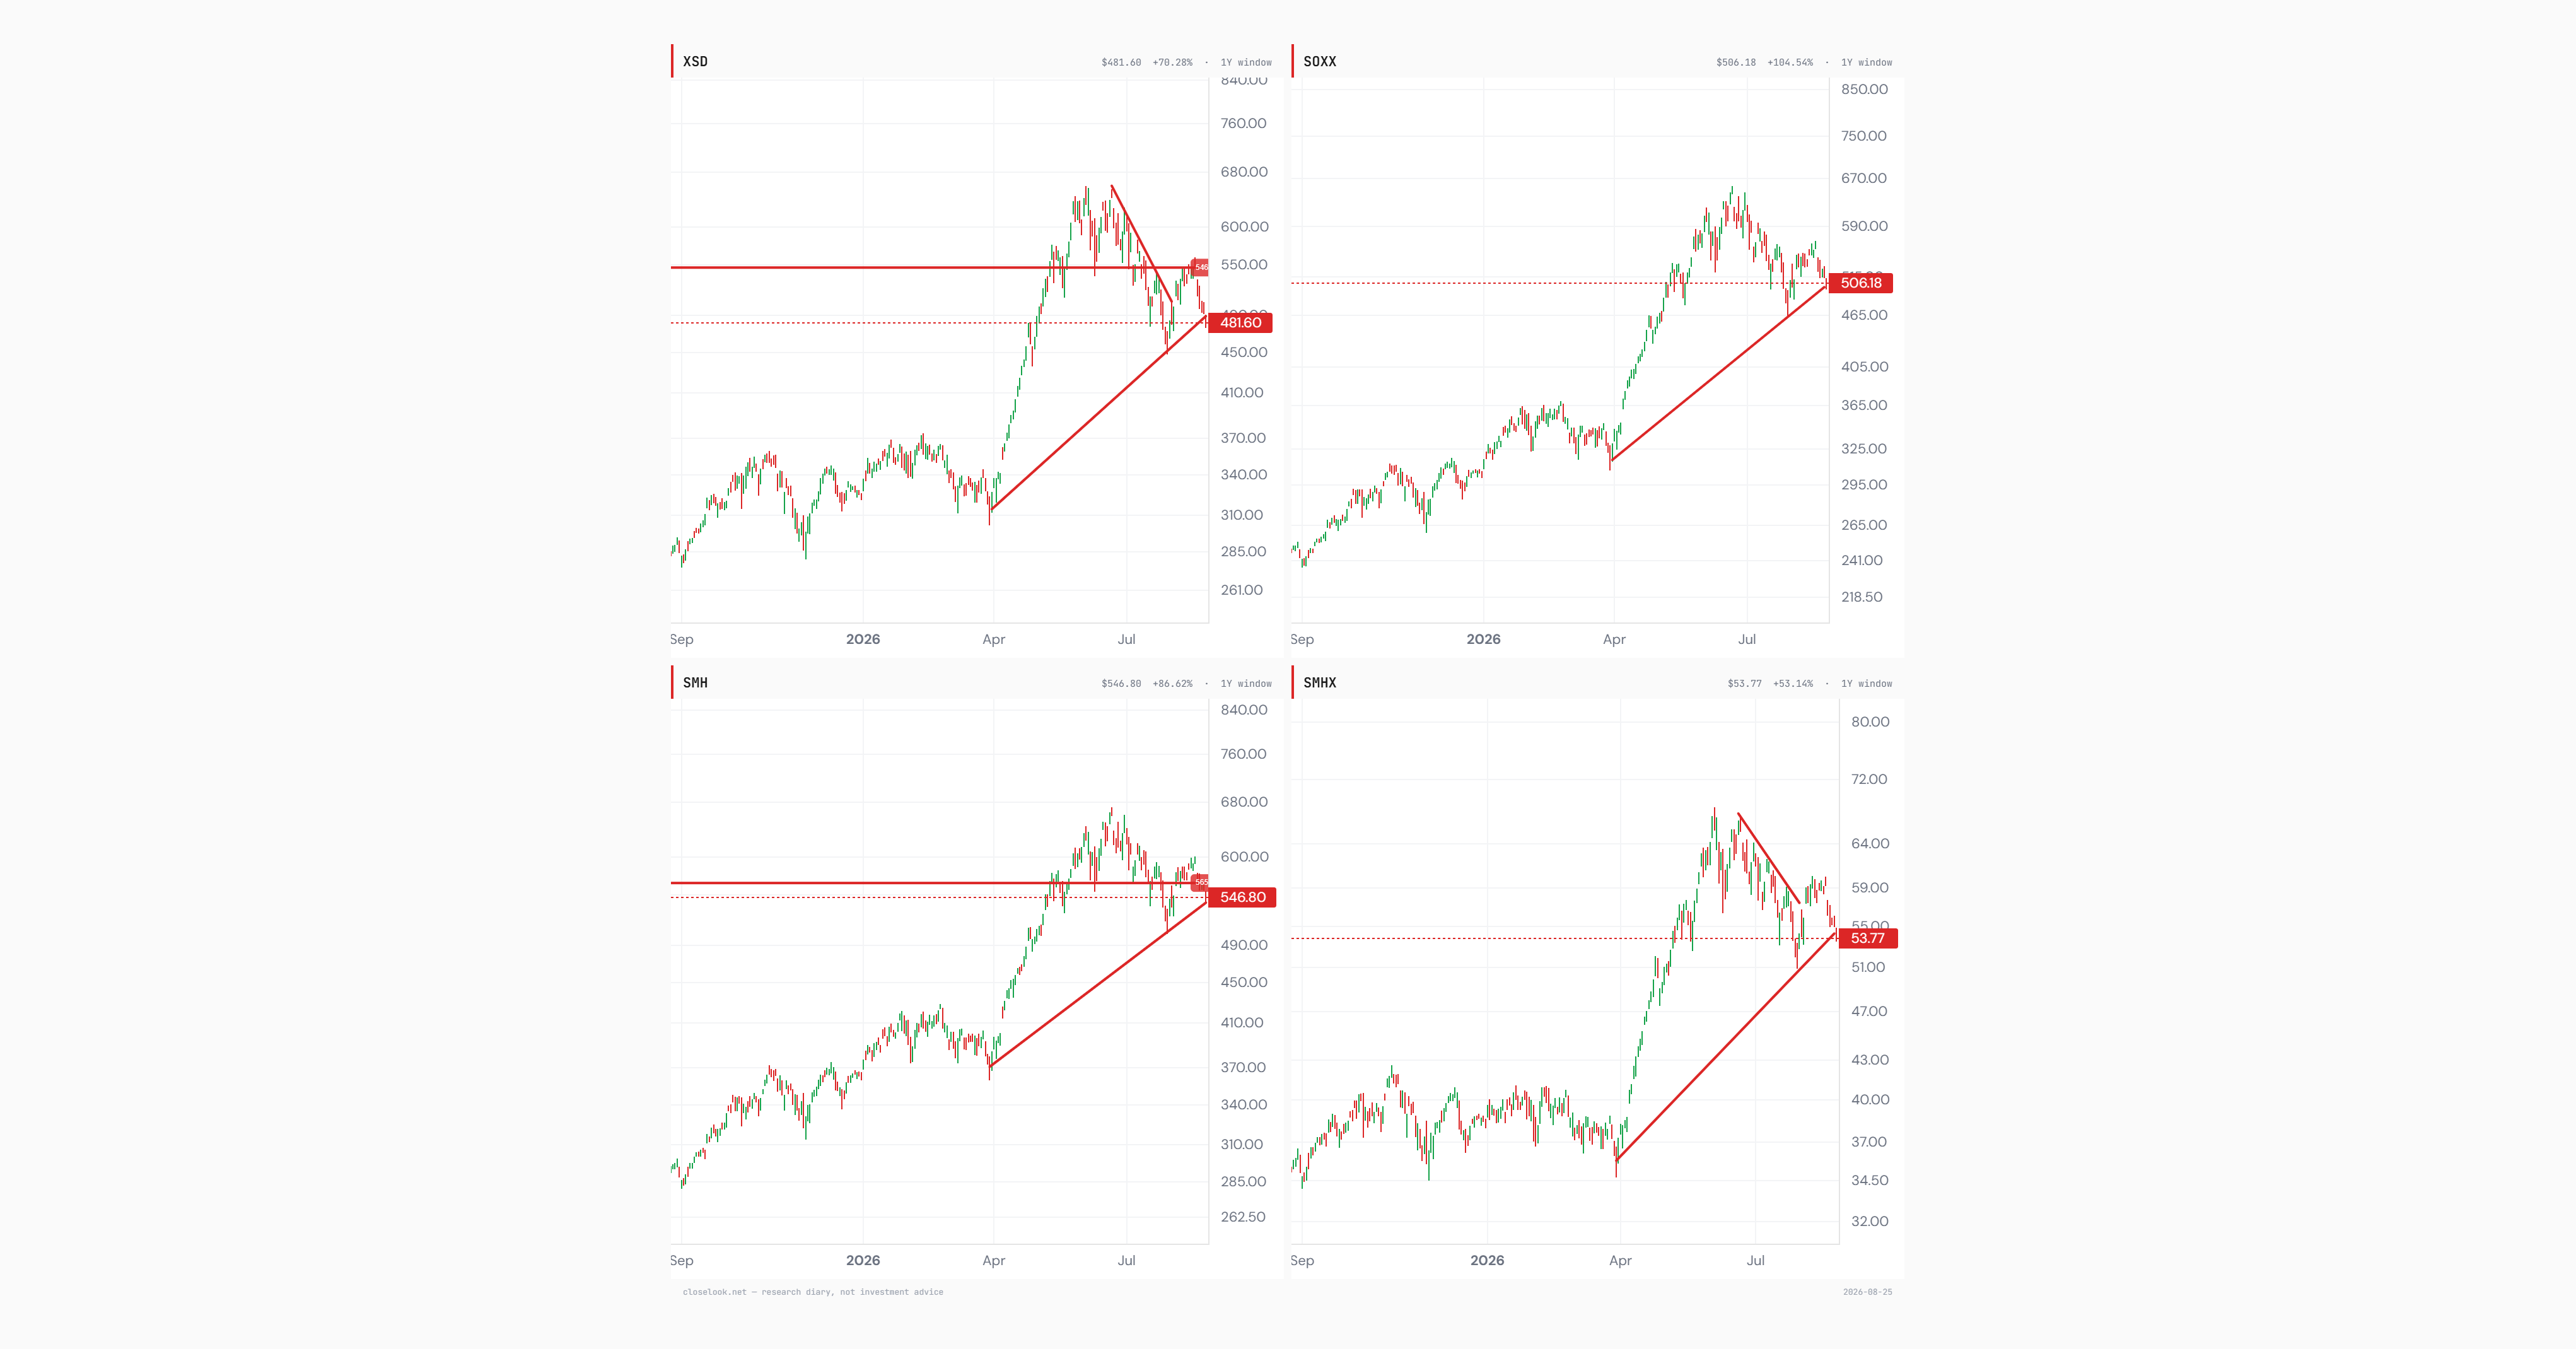
XSD (SPDR S&P Semiconductor, equal-weight, small/mid tilt) 481.60 · Mon −3.34% · 1y +78.28% · Jul-29 close 449.41 (−6.7% from here)
SOXX (iShares Semiconductor) 506.18 · Mon −2.67% · 1y +104.54% · Jul-29 close 465.00 (−8.1%)
SMH (VanEck Semiconductor, mega-cap weighted) 546.80 · Mon −2.43% · 1y +86.62% · Jul-29 close 504.22 (−7.8%)
SMHX (VanEck Fabless Semiconductor) 53.77 · Mon −2.92% · 1y +53.14% · Jul-29 close 50.94 (−5.3%) · closes through 2026-08-24
The line dates from April. Each of these four funds turned in that month and has climbed a rising trendline since, and Monday's session put all four back down onto it together. Monday's losses were tightly clustered — 3.34%, 2.67%, 2.43%, 2.92% — which is itself part of the picture: nothing in the complex was spared and nothing was singled out.
The one-year column is the size of what is being tested. SOXX has added 104.54% over that window, SMH 86.62%, XSD 78.28%, SMHX 53.14%. The trendline under review is the one that produced those numbers, which is why the touch is worth recording rather than shrugging at.
XSD is the panel that reads breadth. Equal weighting gives a small manufacturer the same say as a mega-cap, so the fund tracks the average semiconductor stock rather than the largest ones — and it has been the weaker of the four recently, now trading below a former support shelf around 550 that used to act as its floor. SMHX, the fabless-only cut, carries the smallest one-year number and sits closest to its July low at 5.3%.
The downside map is unusually tidy. All four funds printed their end-of-July low on the same day, 2026-07-29: XSD 449.41, SOXX 465.00, SMH 504.22, SMHX 50.94. Measured from Monday's closes that is between 5.3% and 8.1% of air below the current line. Those are the marked shelves the diary will read against if the trend gives way — not forecasts, just the last place the complex stopped.
C — free account
The free C account unlocks the full Daily Pulse — every section of this read.
One tap with Google or one email — no password, no card. You are signed in until you sign out, on this browser, from then on.
Join the Look — freeAlready joined on this browser? The full edition shows automatically — if it doesn't, sign in again here. Looking for the archive, portfolios and realtime? That is C+.