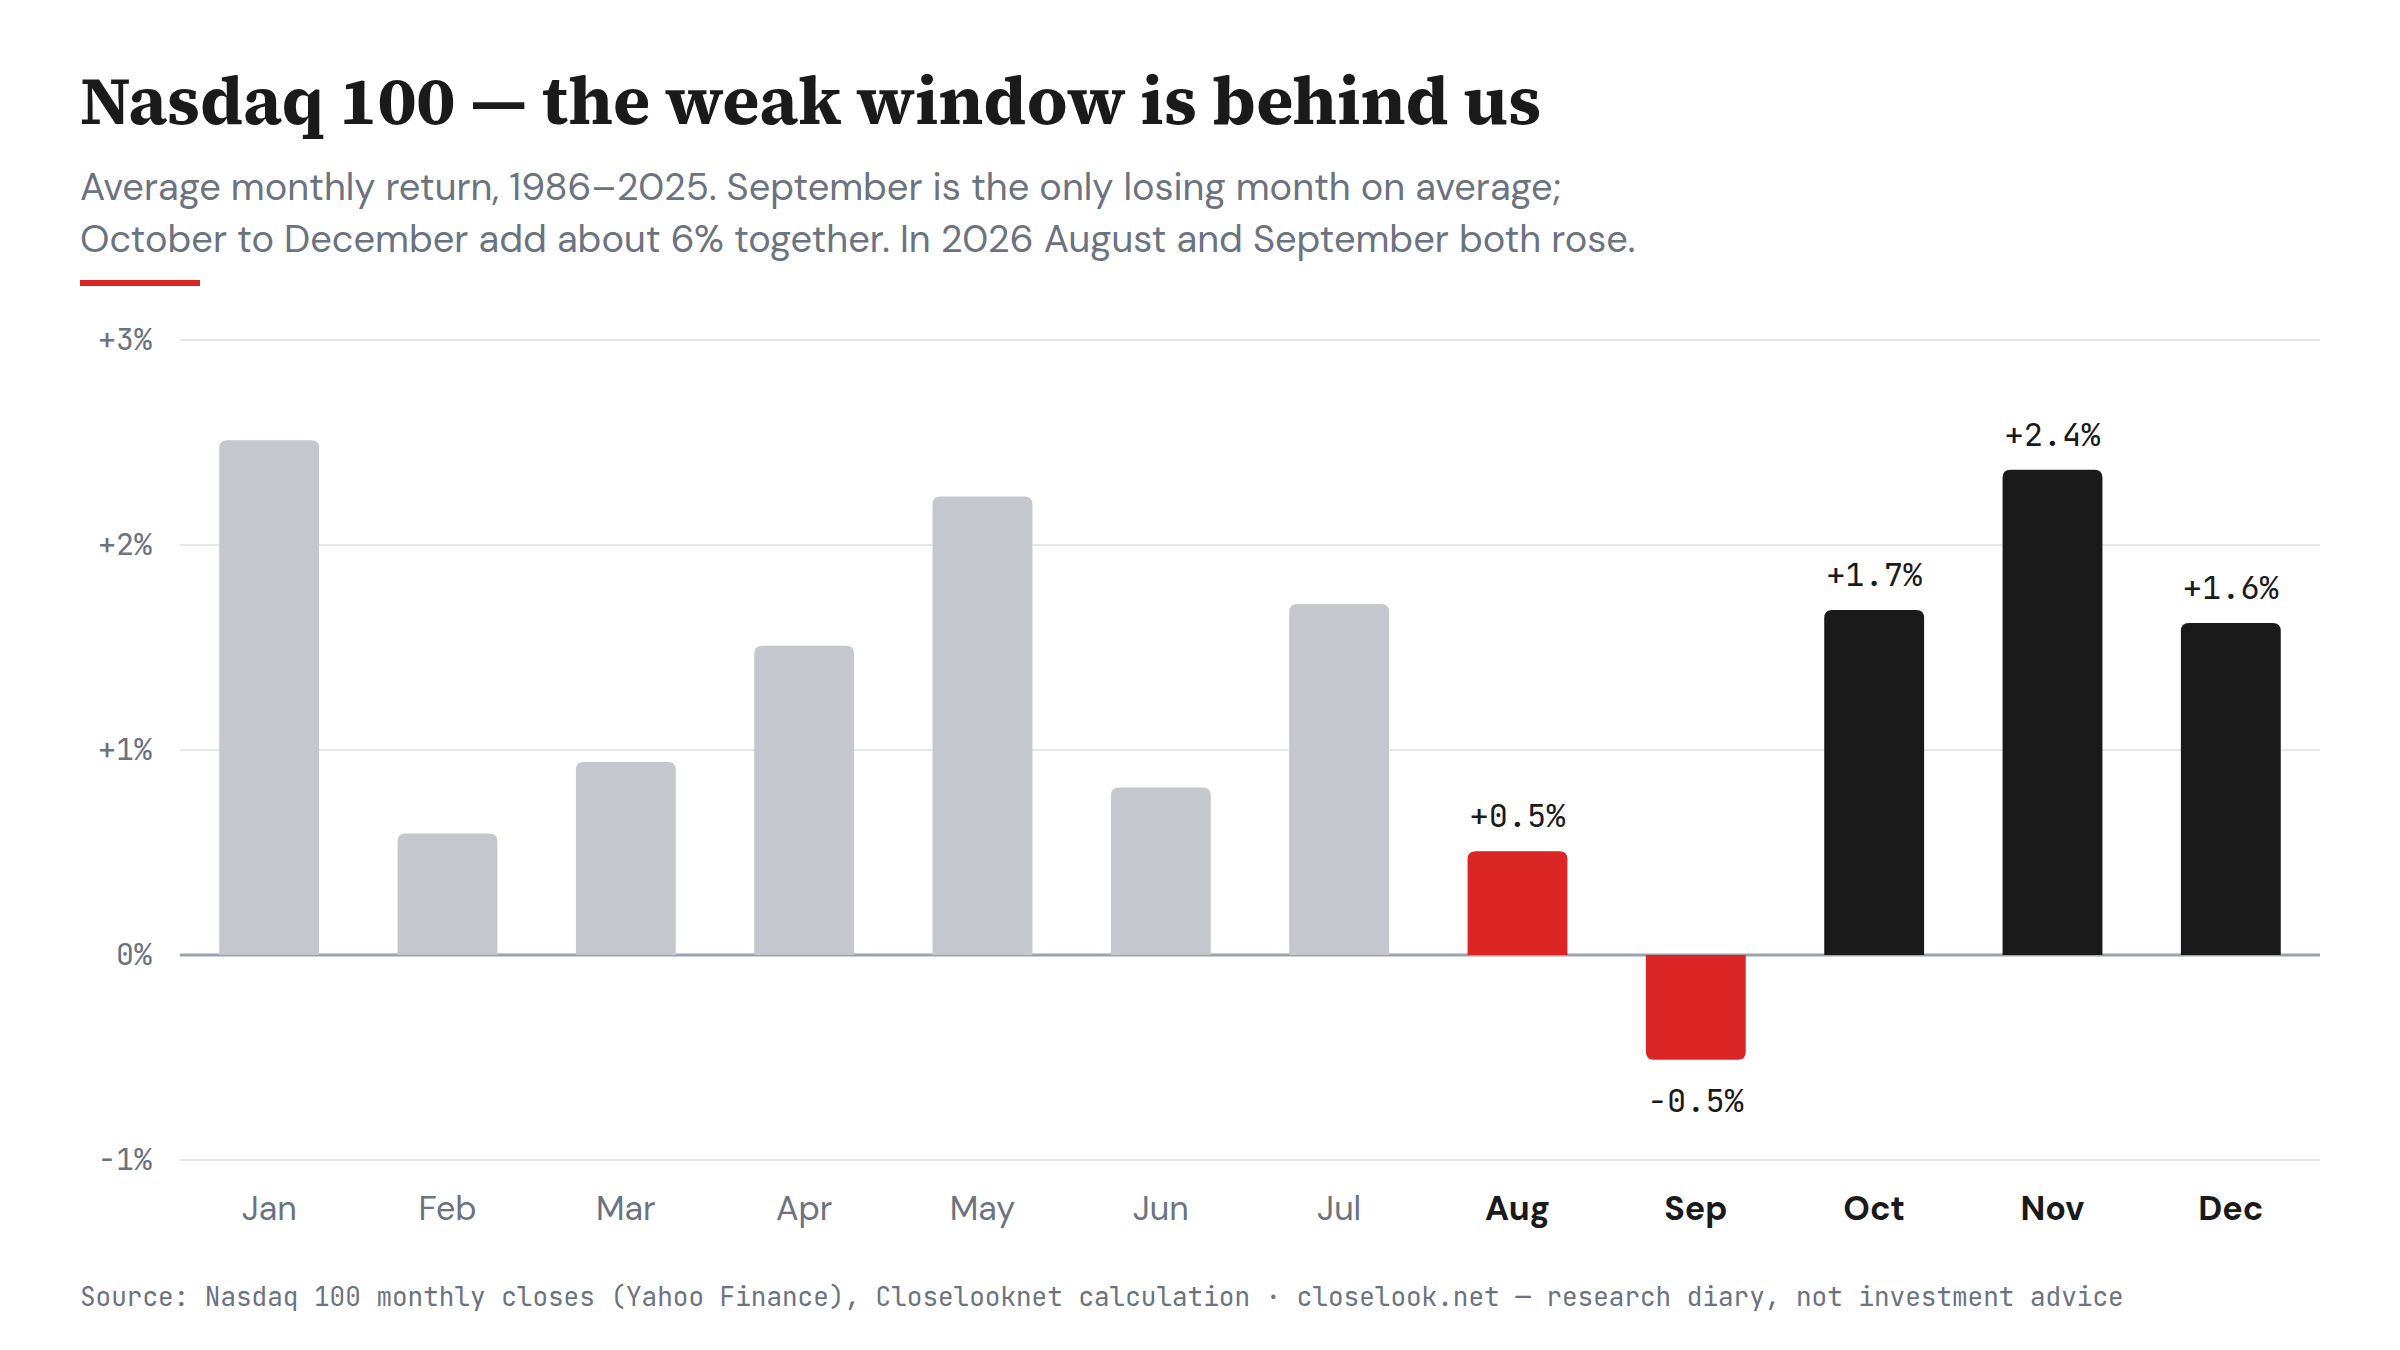
The Nasdaq 100 went through the worst stretch of the calendar and came out higher. Since 1986, September has been the only month in which the index loses on average, and August is the second-weakest. This year it rose 4.2% in August and 3.2% in September, closed Wednesday at 30,408.50 and sits 1.05% below its record close of 30,732.40 from 22 September. Futures point to a gain of about 1.5% at Thursday's open: enough for a new high. It did that while long-term bonds fell to their lowest close in a year.
The weak window is behind us
We counted every month since 1986. On average the Nasdaq 100 rose in eleven of twelve months; only September lost, by 0.5%, and it rose in just 21 of 40 years. October, November and December together added 6.1% on average, and the final quarter was positive in 28 of 40 years.
October's average hides its worst days: the crash of 1987 (−26.8% in the month) and 2008 (−16.3%). But neither was a midterm year. In the ten midterm years since 1986, October rose eight times, by 3.9% on average. The folklore says the first weeks of October stay choppy before the rally starts; the midterm data is kinder than the folklore. The vote is on 3 November.
C — free account
The free C account unlocks the full Daily Pulse — every section of this read.
One tap with Google or one email — no password, no card. You are
signed in until you sign out, on this browser, from then on.
Already joined on this browser? The full edition shows automatically —
if it doesn't, sign in again here. Looking for the archive, portfolios and
realtime? That is C+.
One more block on our desk — tomorrow's levels and what we're watching into the next session. Join the Look — it’s free.
The signals behind thisEach line links to the tool it comes from