Daily Pulse · · 08:30 NY · 9 min read · market · TLT


In this edition
Yesterday's page followed the semiconductor complex down onto its April trendline and back off it; day one went to the bounce, and Nvidia reports tonight as that test's referee. Today the tape hands this diary a different line to read, drawn in the part of the market the consensus has been calling dead money all year: the long end of the Treasury curve.
The setting matters, because the read that follows runs against it. The dominant story on rates has been supply and deficits — the same pressure this diary's own Sovereign Pressure board exists to track, G7 yields grinding higher, a steepening 10s30s, more issuance than the market wants to absorb. It has also, quietly, become a crowded story: rising rates is by now closer to the consensus position than to an edge, and crowded stories are exactly where a turn in price deserves the most attention. Gold near 4,700 and bitcoin holding a 77,000–83,000 range are usually filed as the other side of that trade — money paid to avoid duration — though this page returns below to a second reading of that same bid.
Price did not go along with any of that this week. TLT, the long Treasury fund, stopped falling at a marked line, held the touch intraday, and closed Tuesday at August's highest level. This edition describes that chart and the level it now has to hold. All figures are close-to-close through Tuesday's US close unless stated.
Four windows, one level
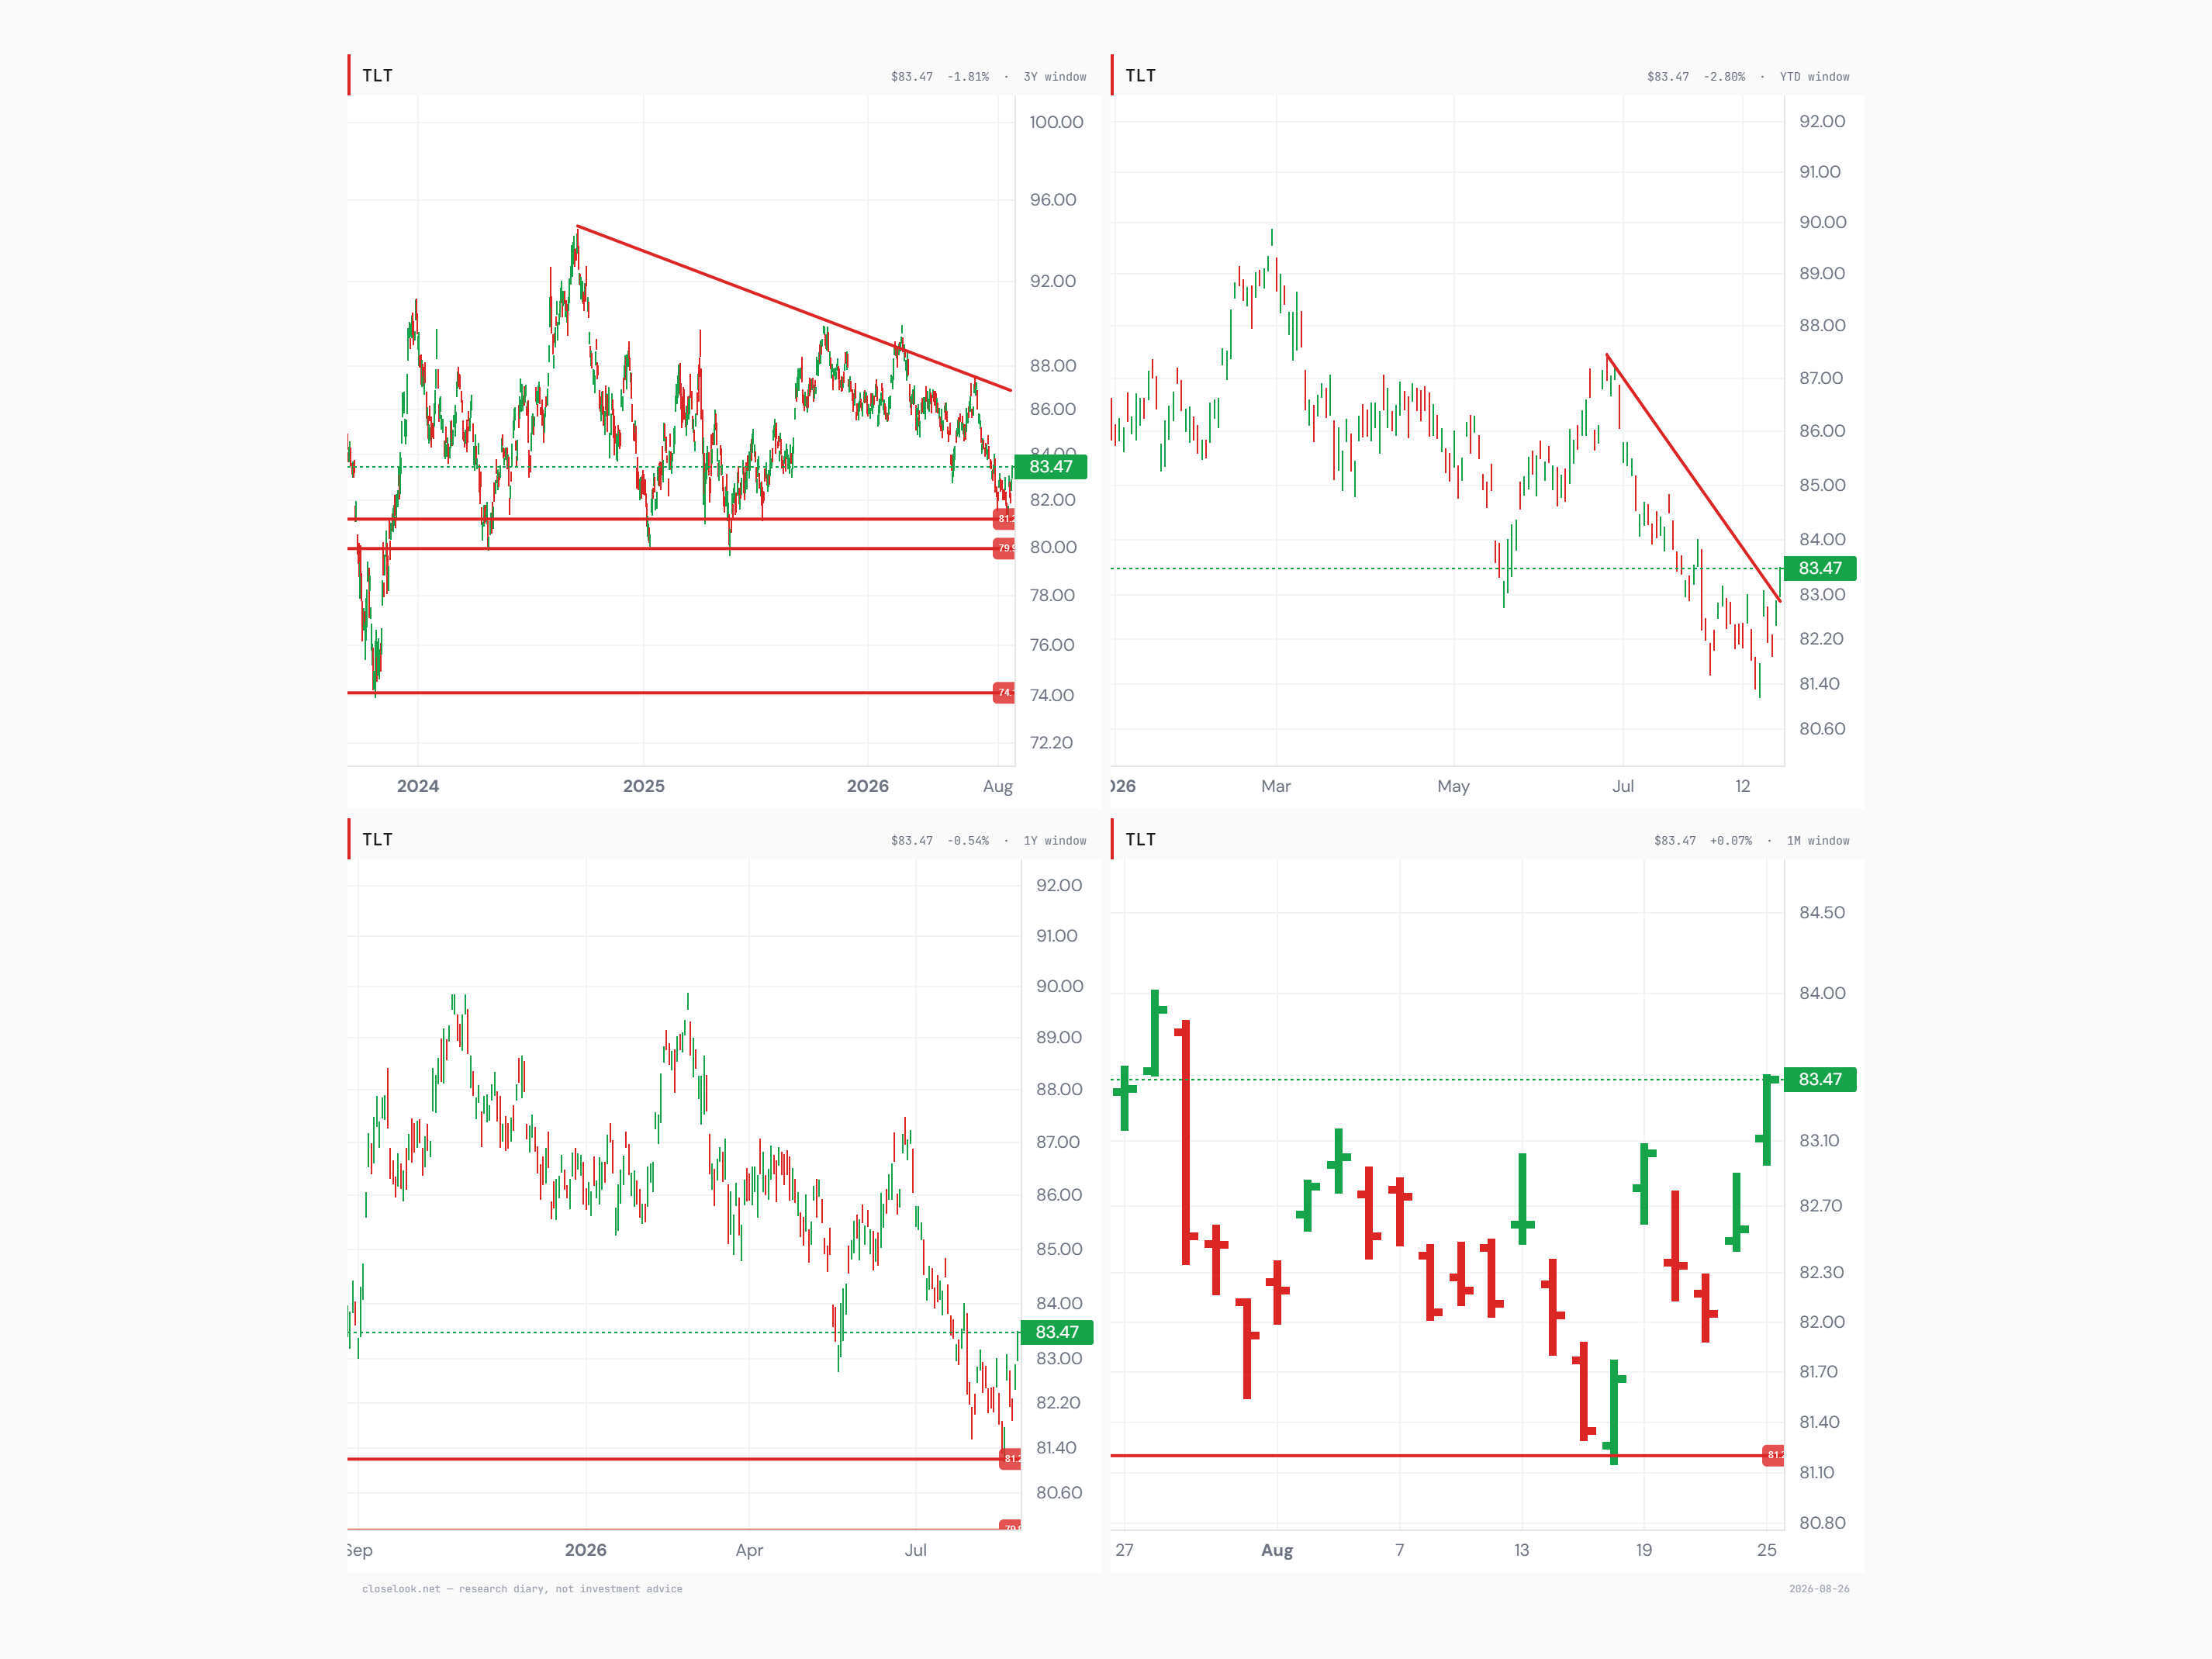
TLT (iShares 20+ Year Treasury Bond) 83.47 · Tue +1.10% (prior close 82.56 — the highest close of August)
Year low 81.17 intraday (2026-08-18, printed exactly on the chart's marked ~81.2 support and held; lowest close of the stretch 81.35 on 08-17)
From the 08-18 close (81.66) to Tuesday: +2.22% in five sessions
50-day 84.10 · 200-day 86.56 (price below both) · year high 92.19
3Y −1.81% · YTD −2.80% · 1Y −0.54% · 1M +0.07%
The three-year panel carries the most overhead. A descending trendline drawn from the 2024 peak near 94.5 sits above the market at roughly 87, and below price the chart marks three horizontal shelves: the ~81.2 line just tested, a deeper one near 79.9, and the major three-year floor near 74. Nothing in that panel has changed shape — the line above is still falling, the shelves below are still where they were. Only the candle at the bottom-right has moved.
The year-to-date panel is where the bounce reads most plainly. A steep downtrend line runs from the early-July high near 87.5, and Tuesday's close pushes price back up to touch that line rather than through it. That is the entire event in this window: a return to resistance-from-above, not a breakout past it. The one-year panel marks the same ~81.2 support, and mid-August is the only place in the whole twelve-month window where price has touched it.
The one-month panel is the narrowest and the clearest. It shows the 08-18 touch of 81.17 sitting directly on the line, and then the rest of August climbing away from it to close the month, so far, at its high of 83.47. Four different windows, one shared level, and all four still show a fund trading beneath its own 50-day and 200-day averages — which is the entire reason this read is contrarian rather than a call that anything has been fixed.
C — free account
The free C account unlocks the full Daily Pulse — every section of this read.
One tap with Google or one email — no password, no card. You are signed in until you sign out, on this browser, from then on.
Join the Look — freeAlready joined on this browser? The full edition shows automatically — if it doesn't, sign in again here. Looking for the archive, portfolios and realtime? That is C+.