—

First Trust NASDAQ-100 Ex-Technology Sector Index Fund (QQXT) — chart, structure and Closelooknet read

Pick a ticker to load its detail page.

The desk on QQXT

What this diary said about First Trust NASDAQ-100 Ex-Technology Sector Index Fund, what it holds and what would change its view — in its own words, dated. Investment diary, not advice.

What we said

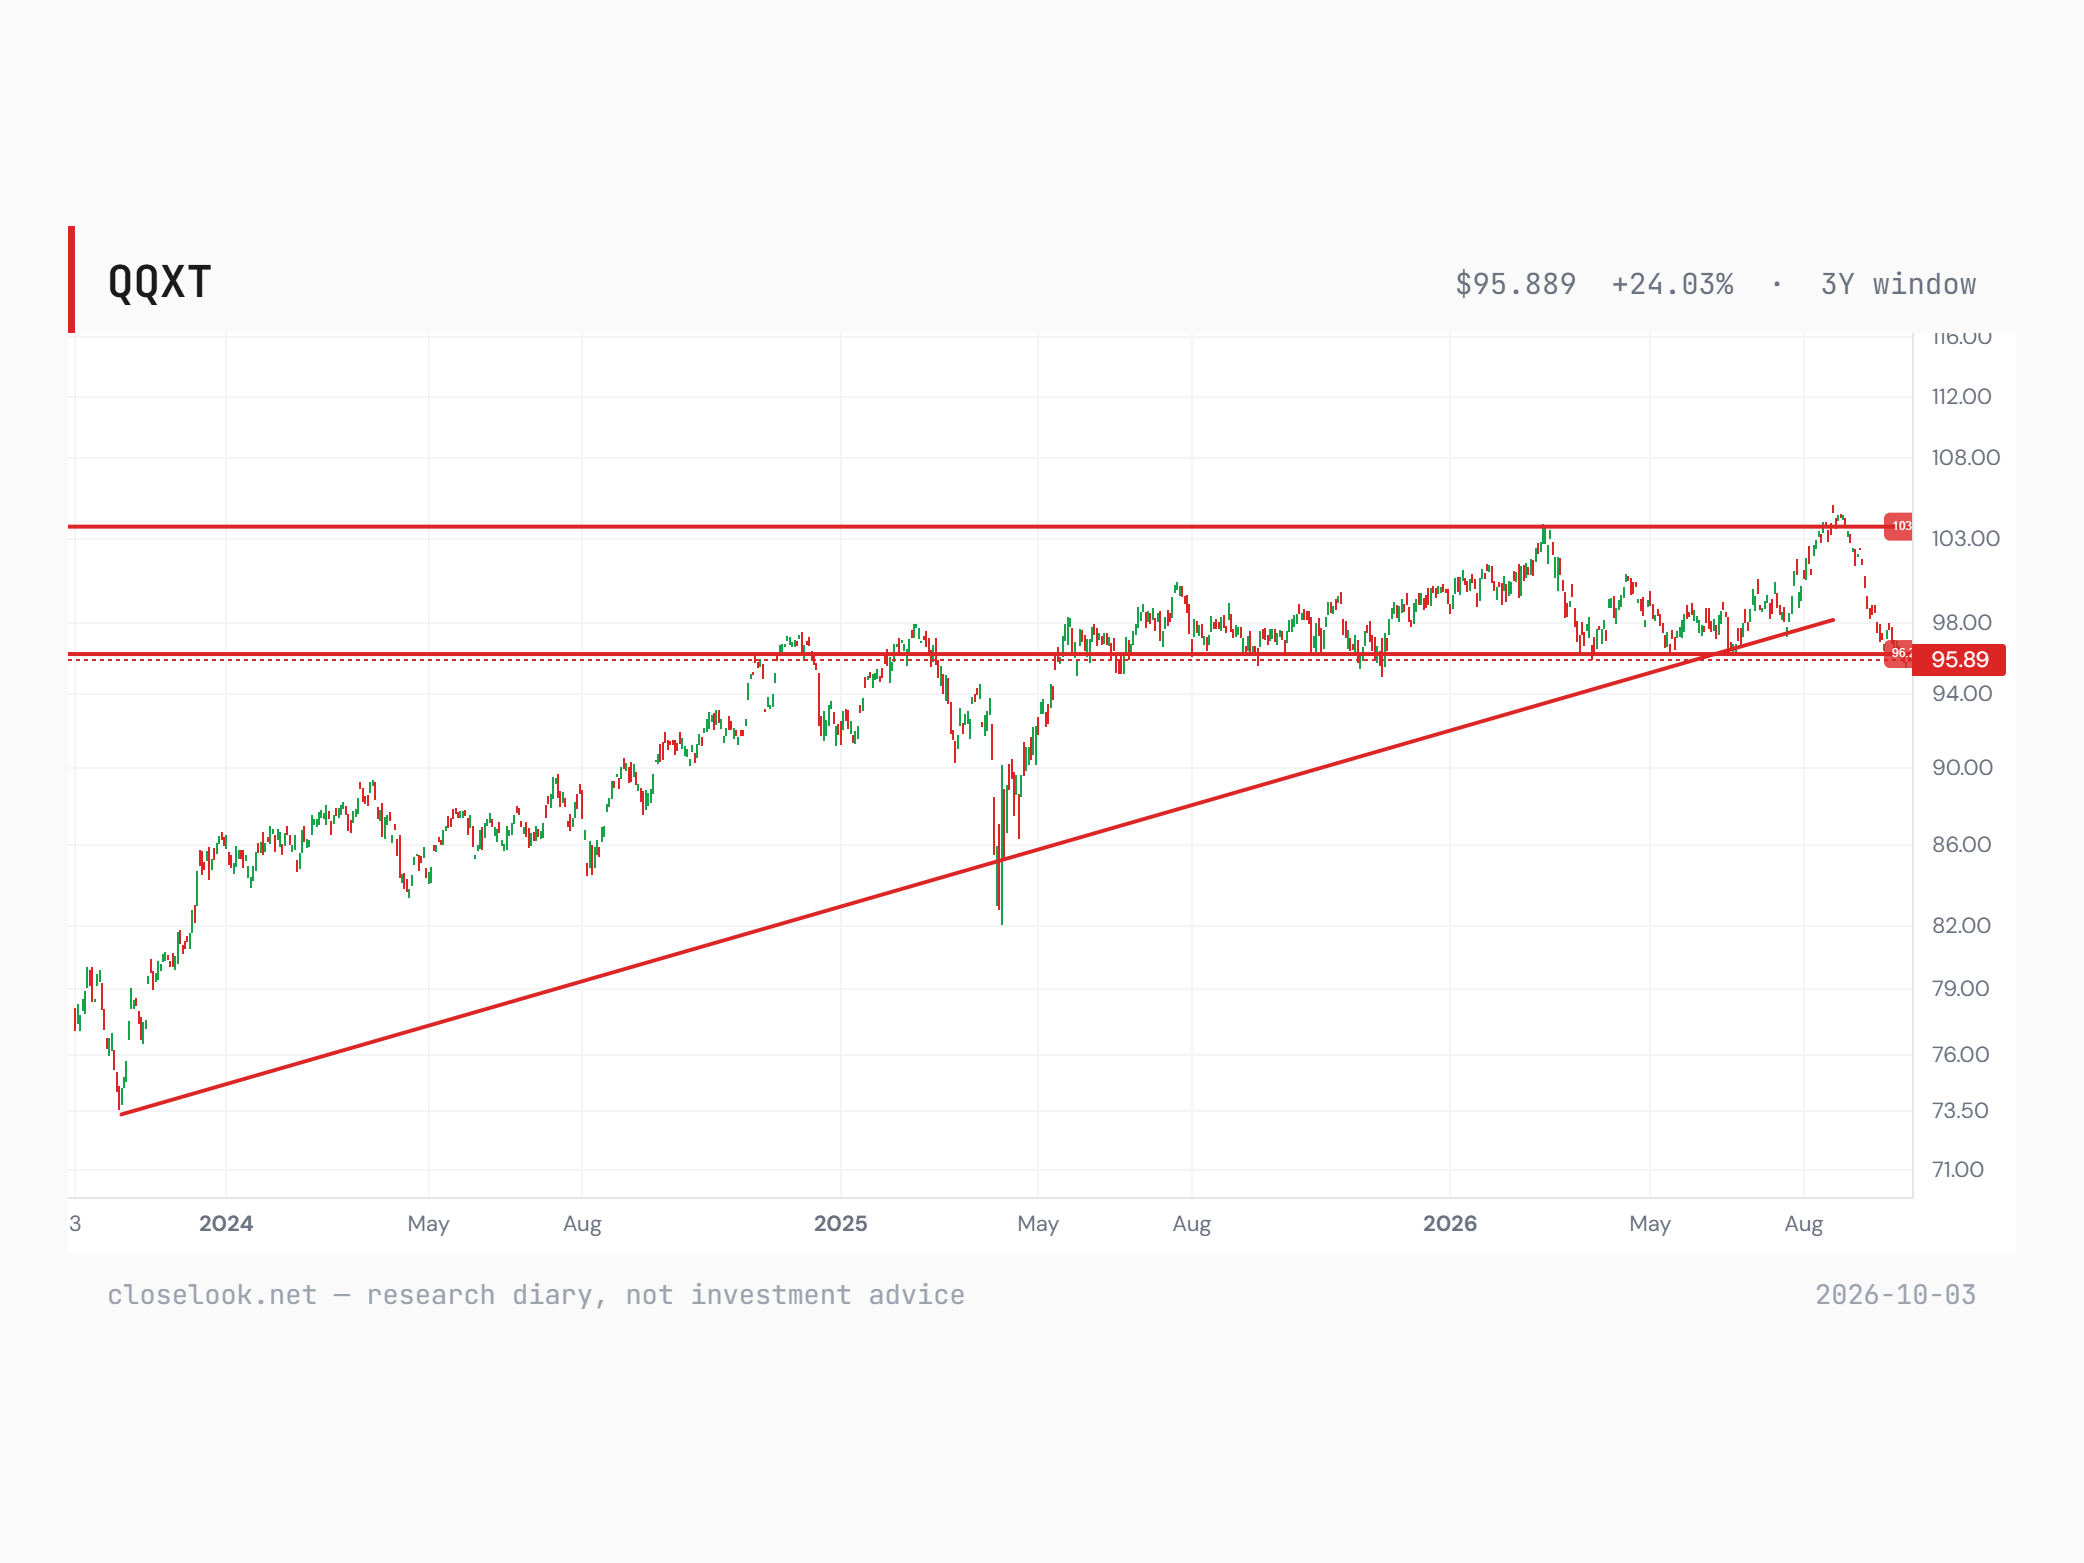
Charts from the desk on QQXT

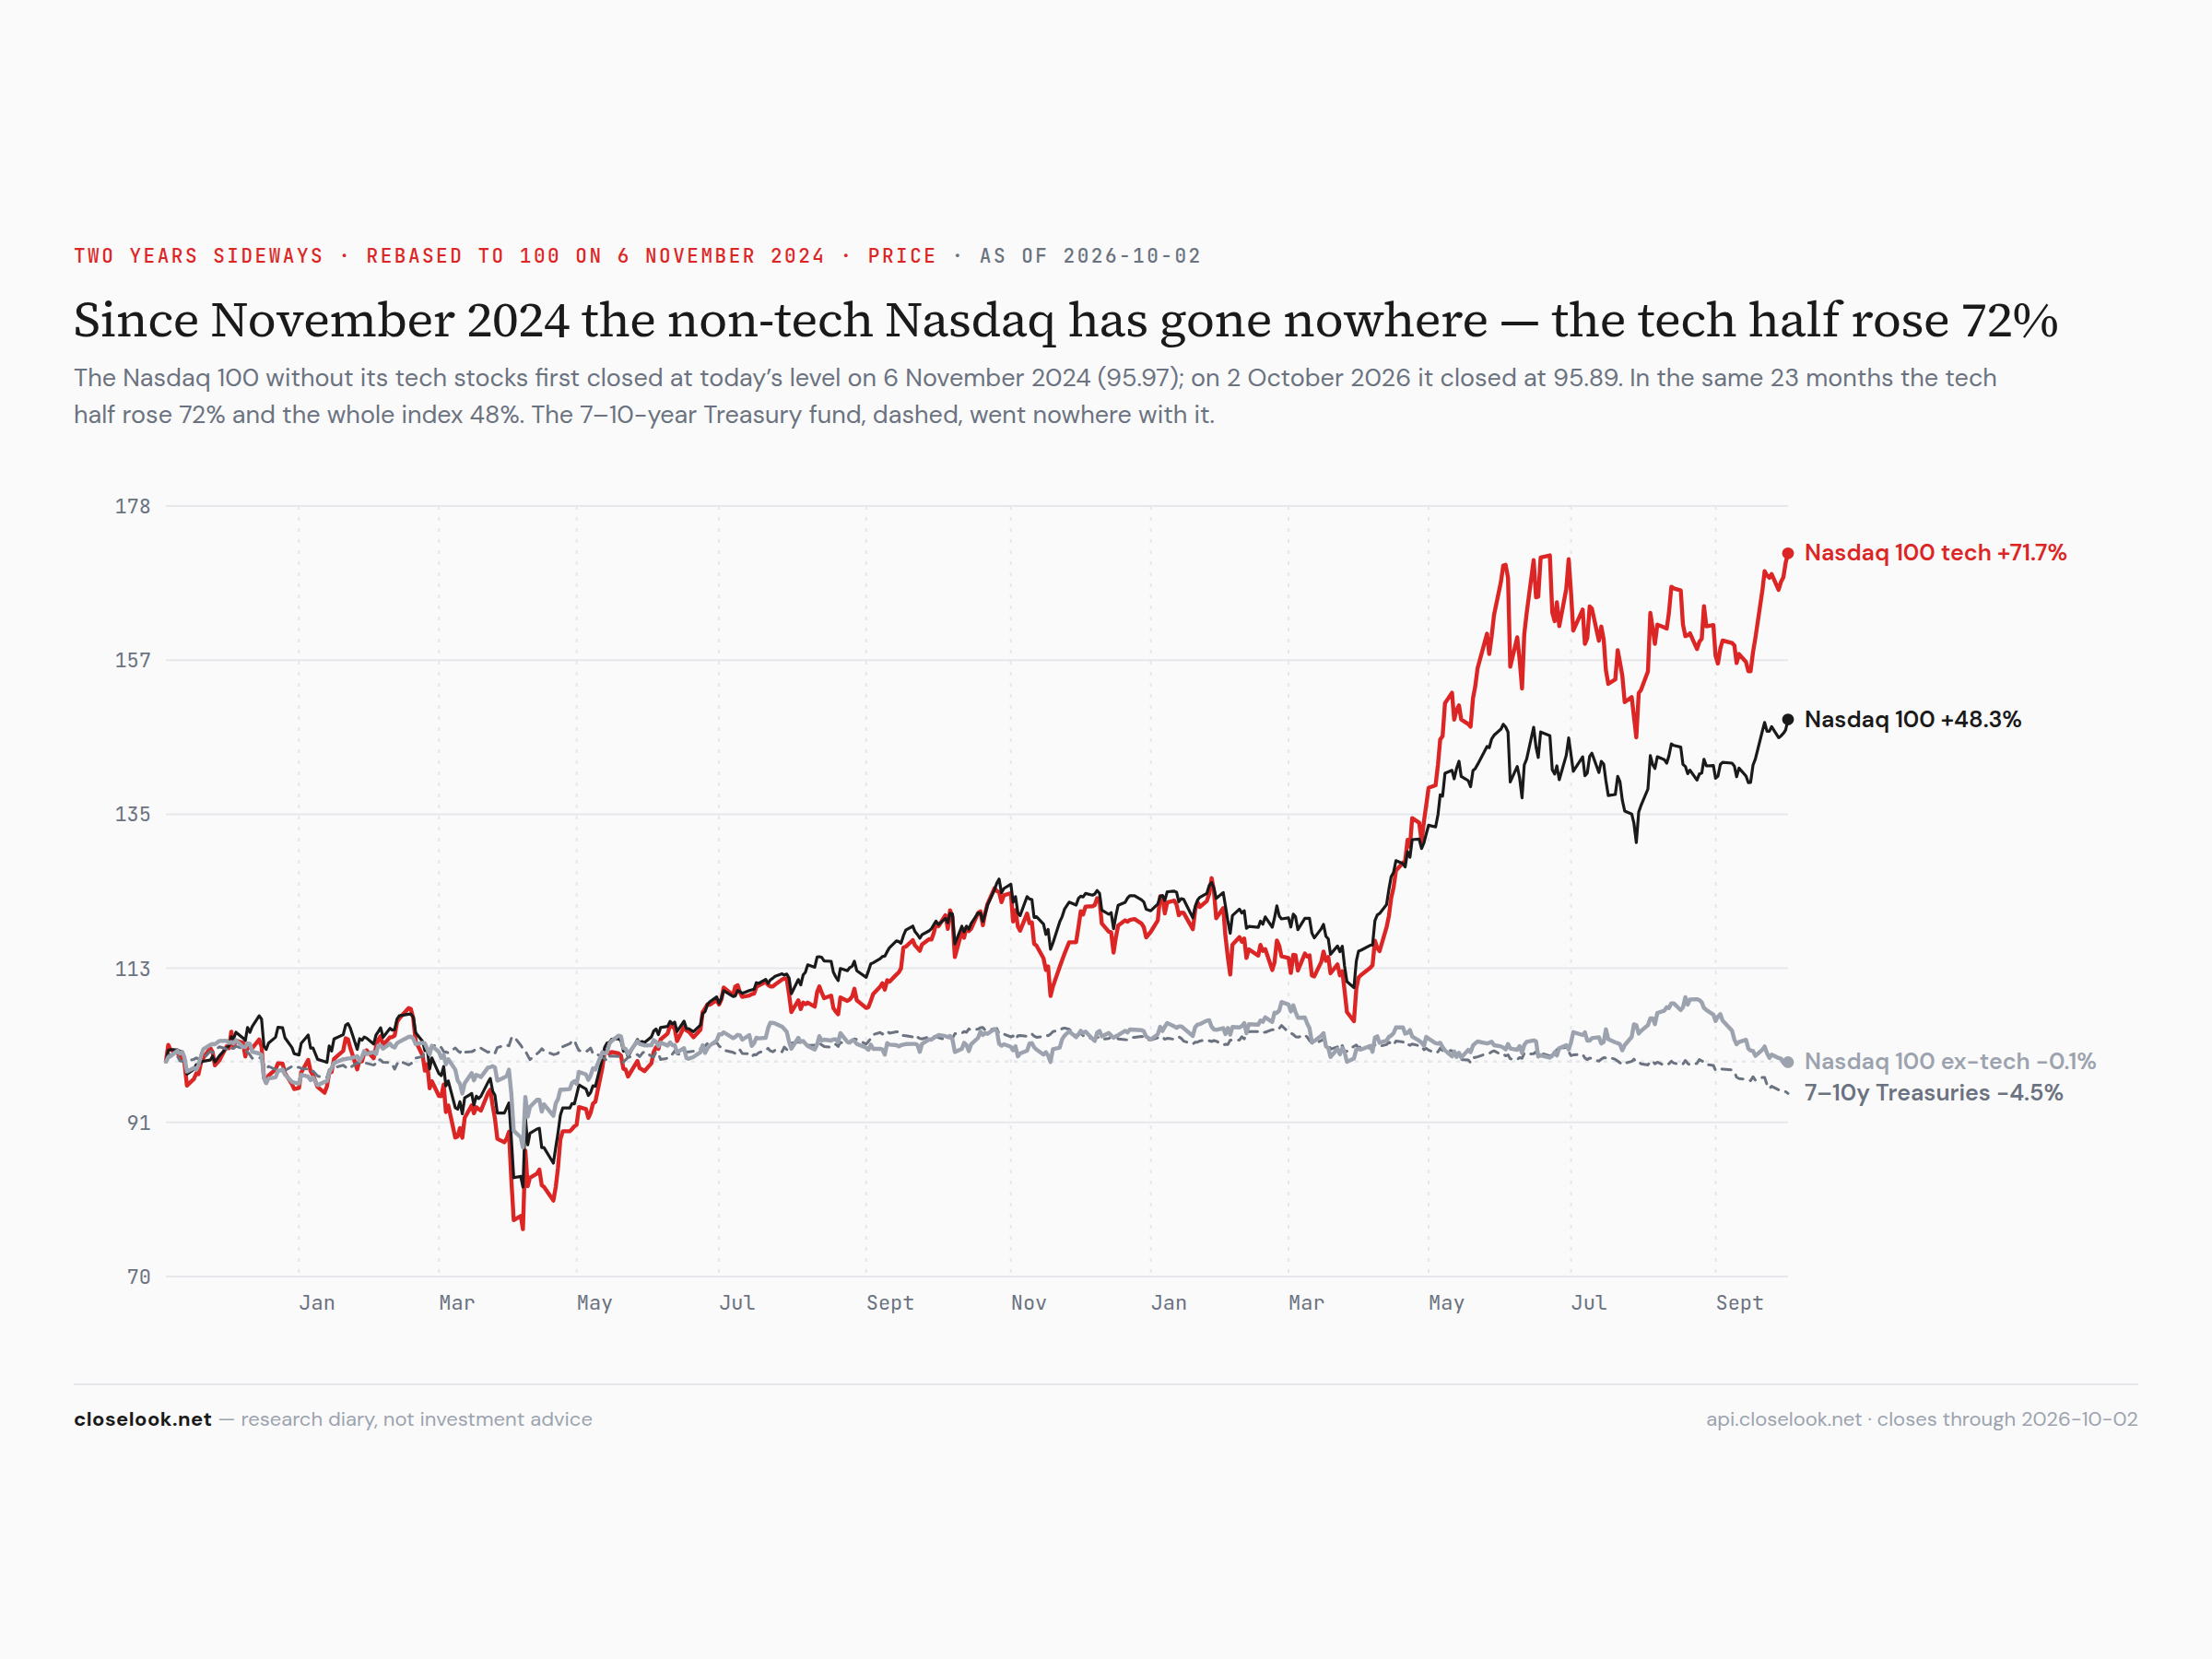
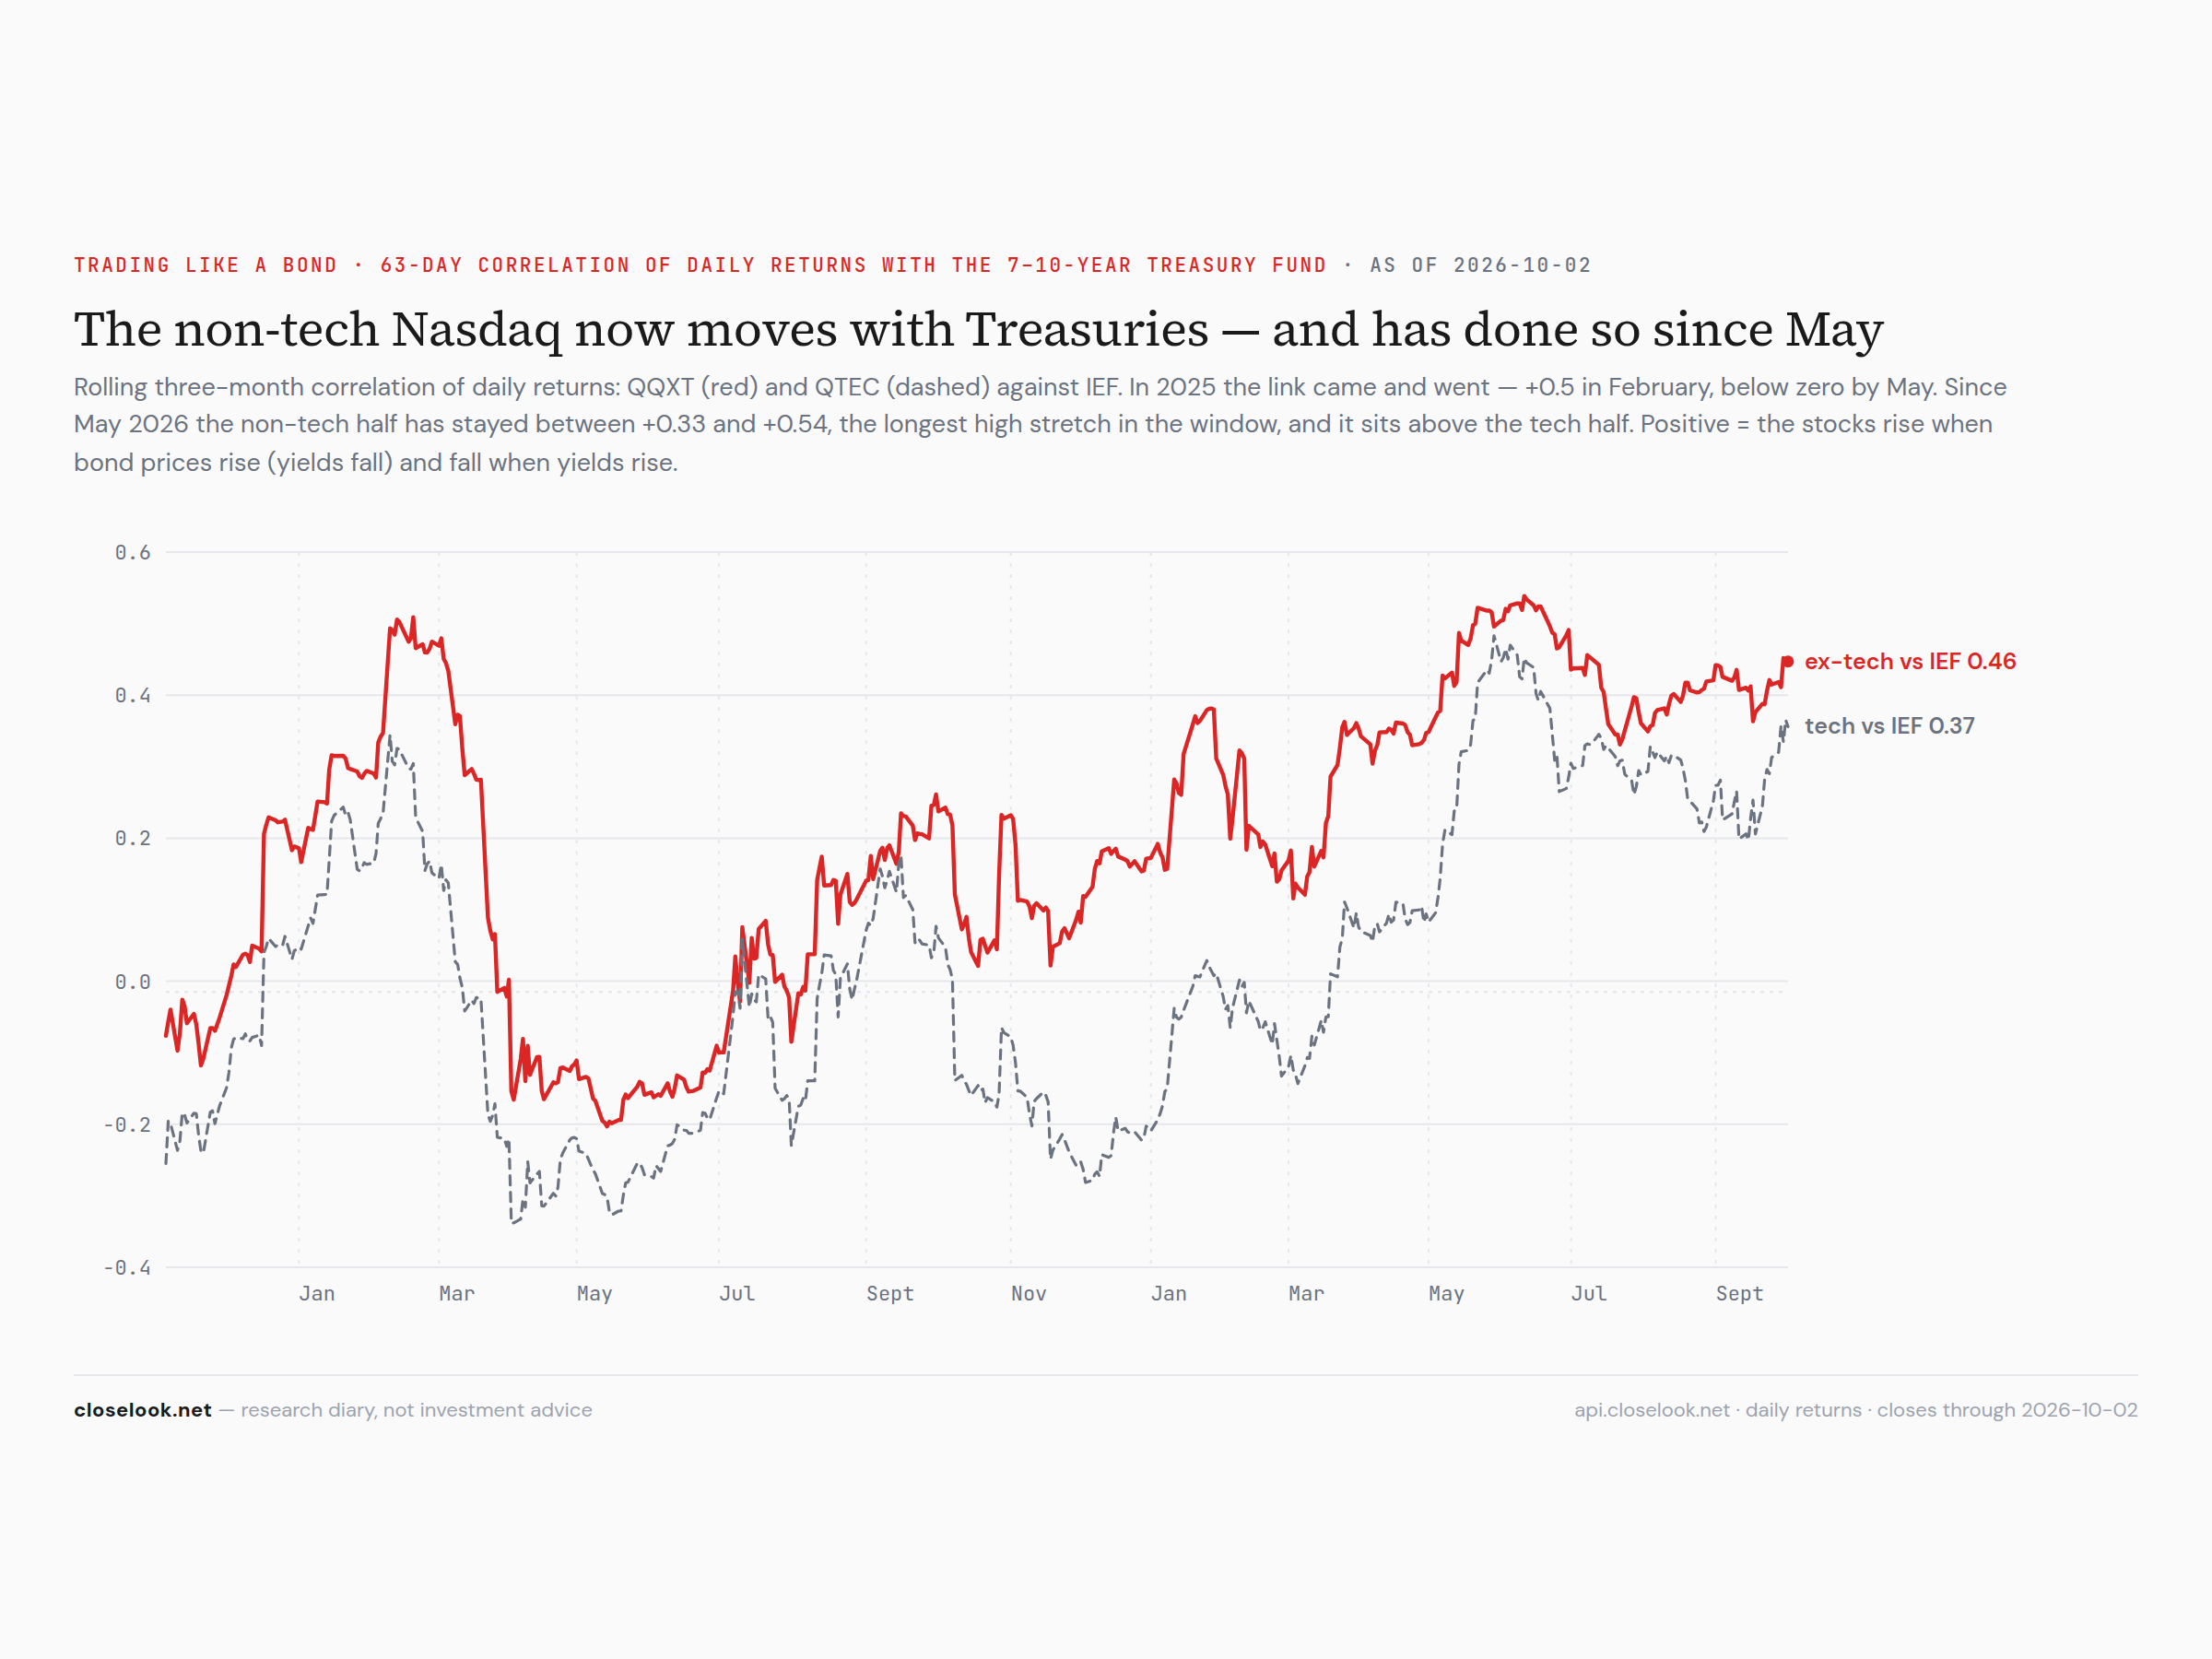
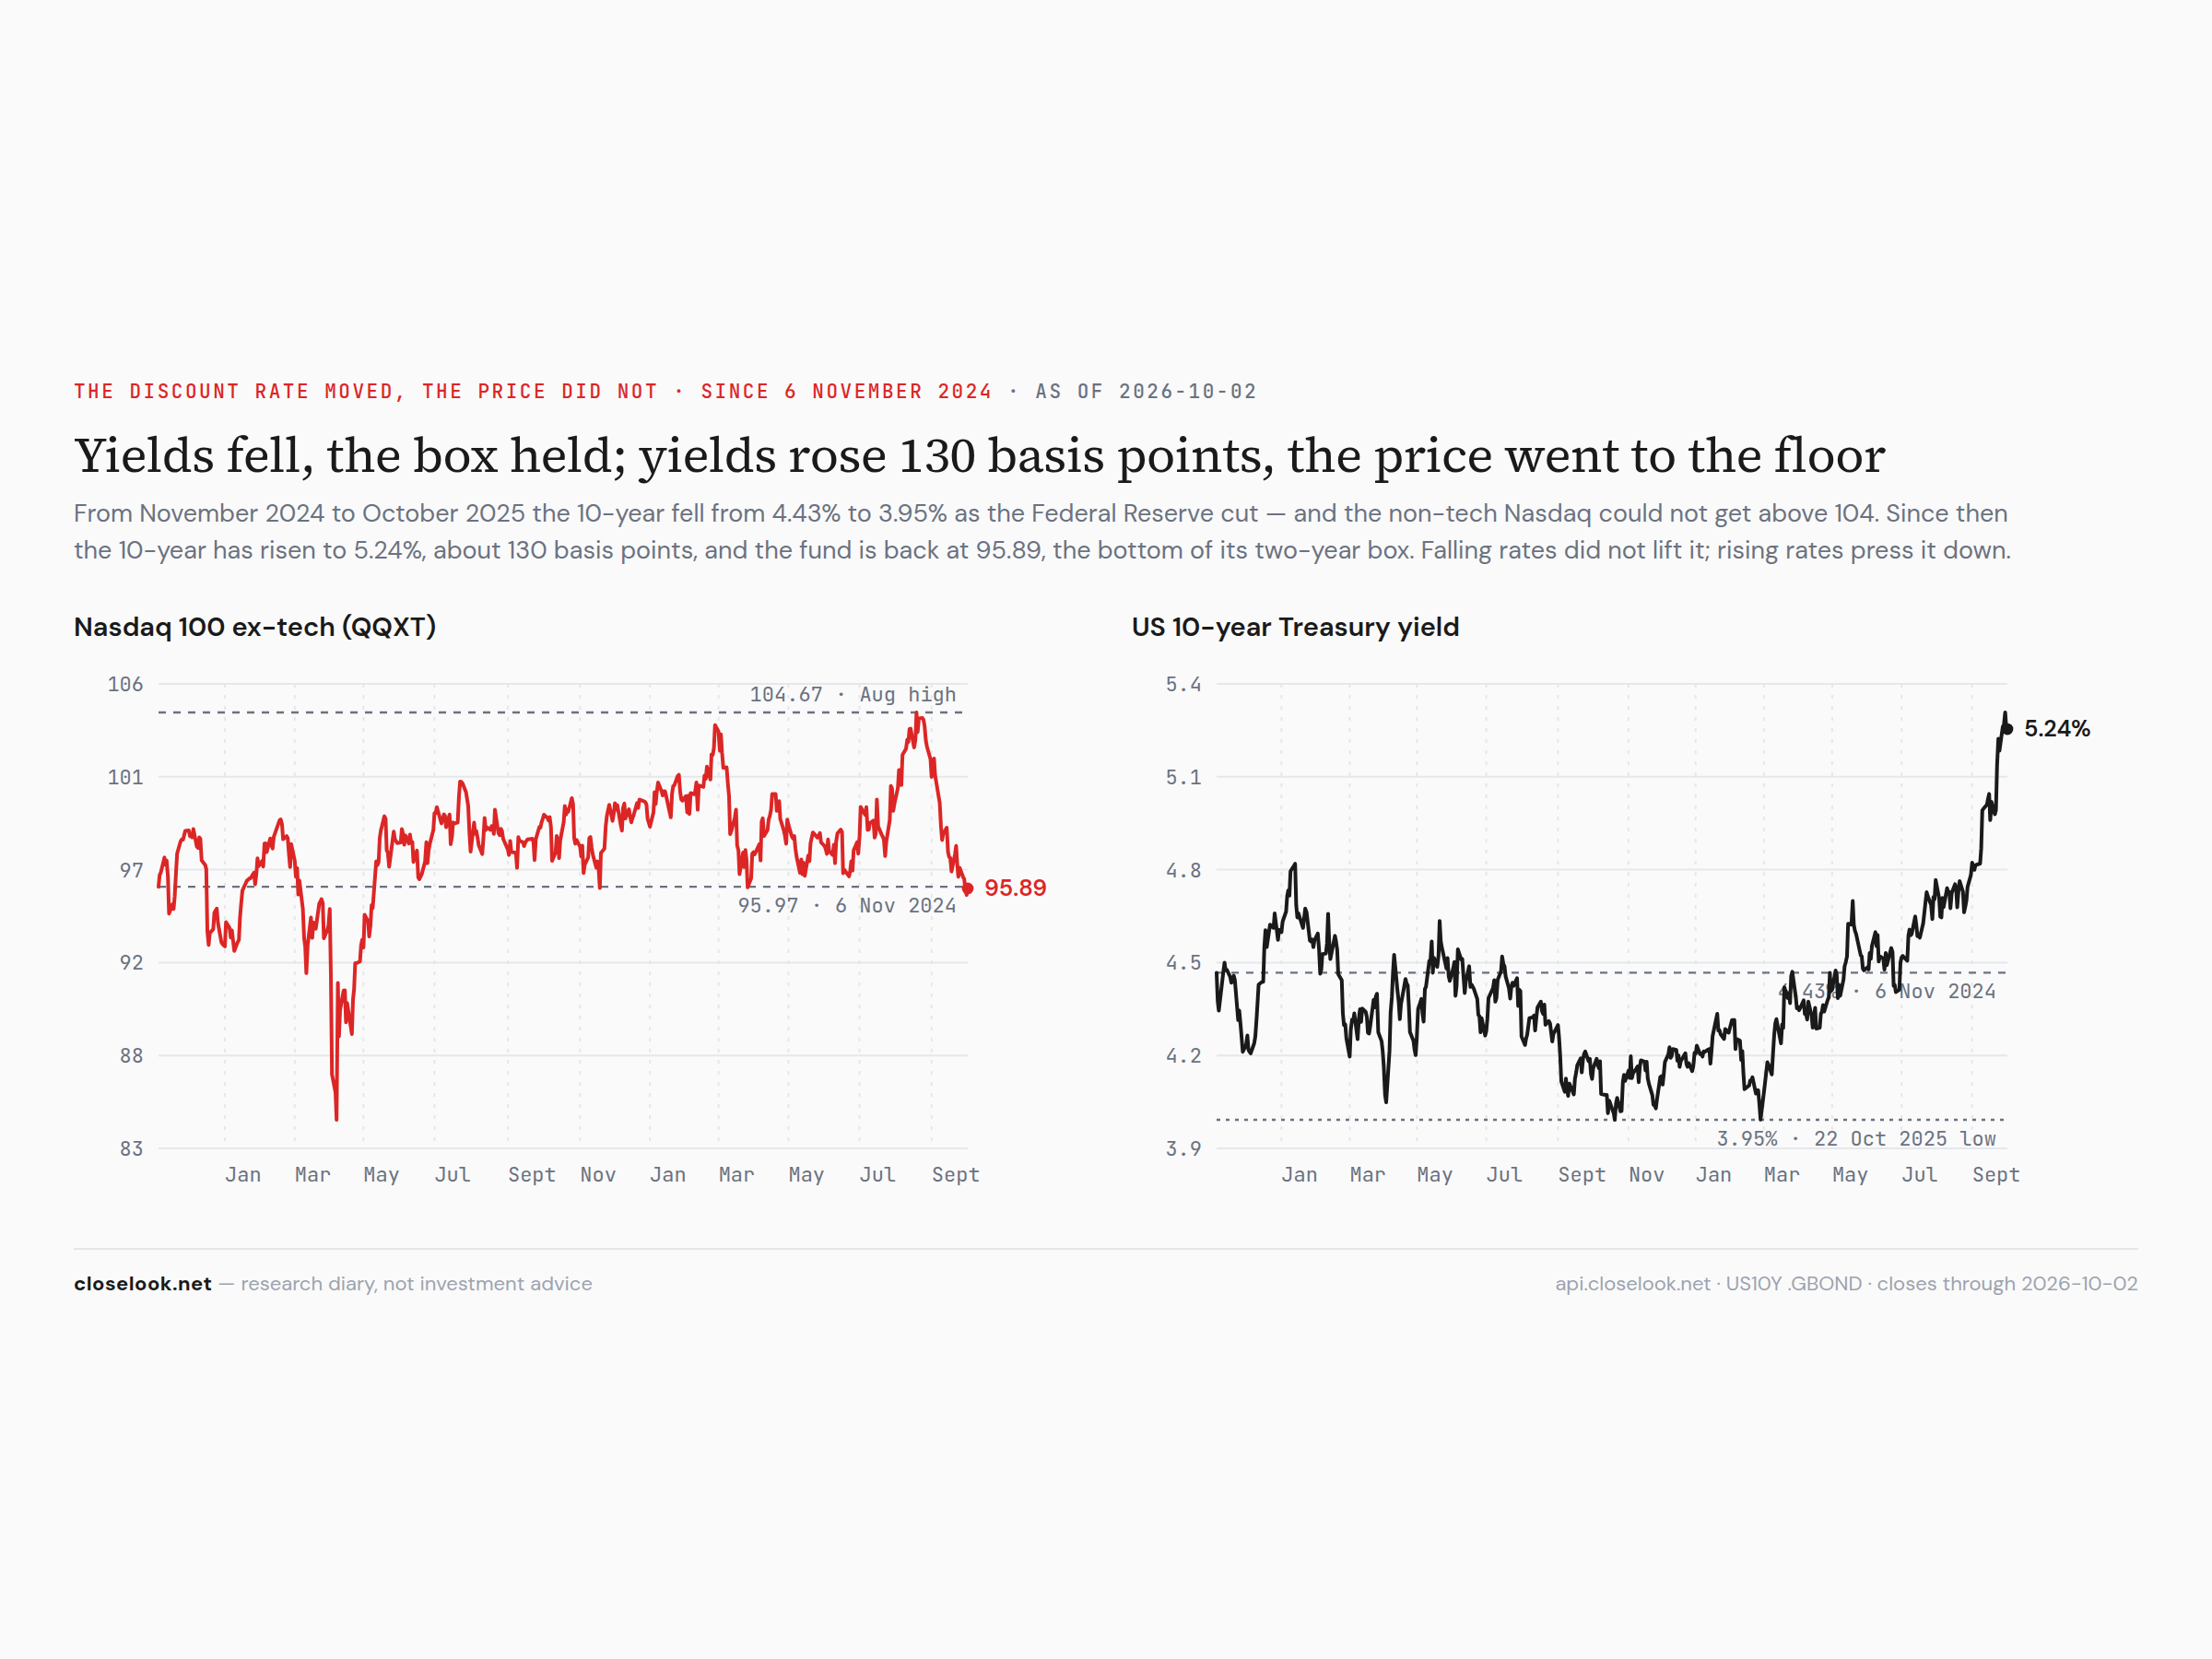
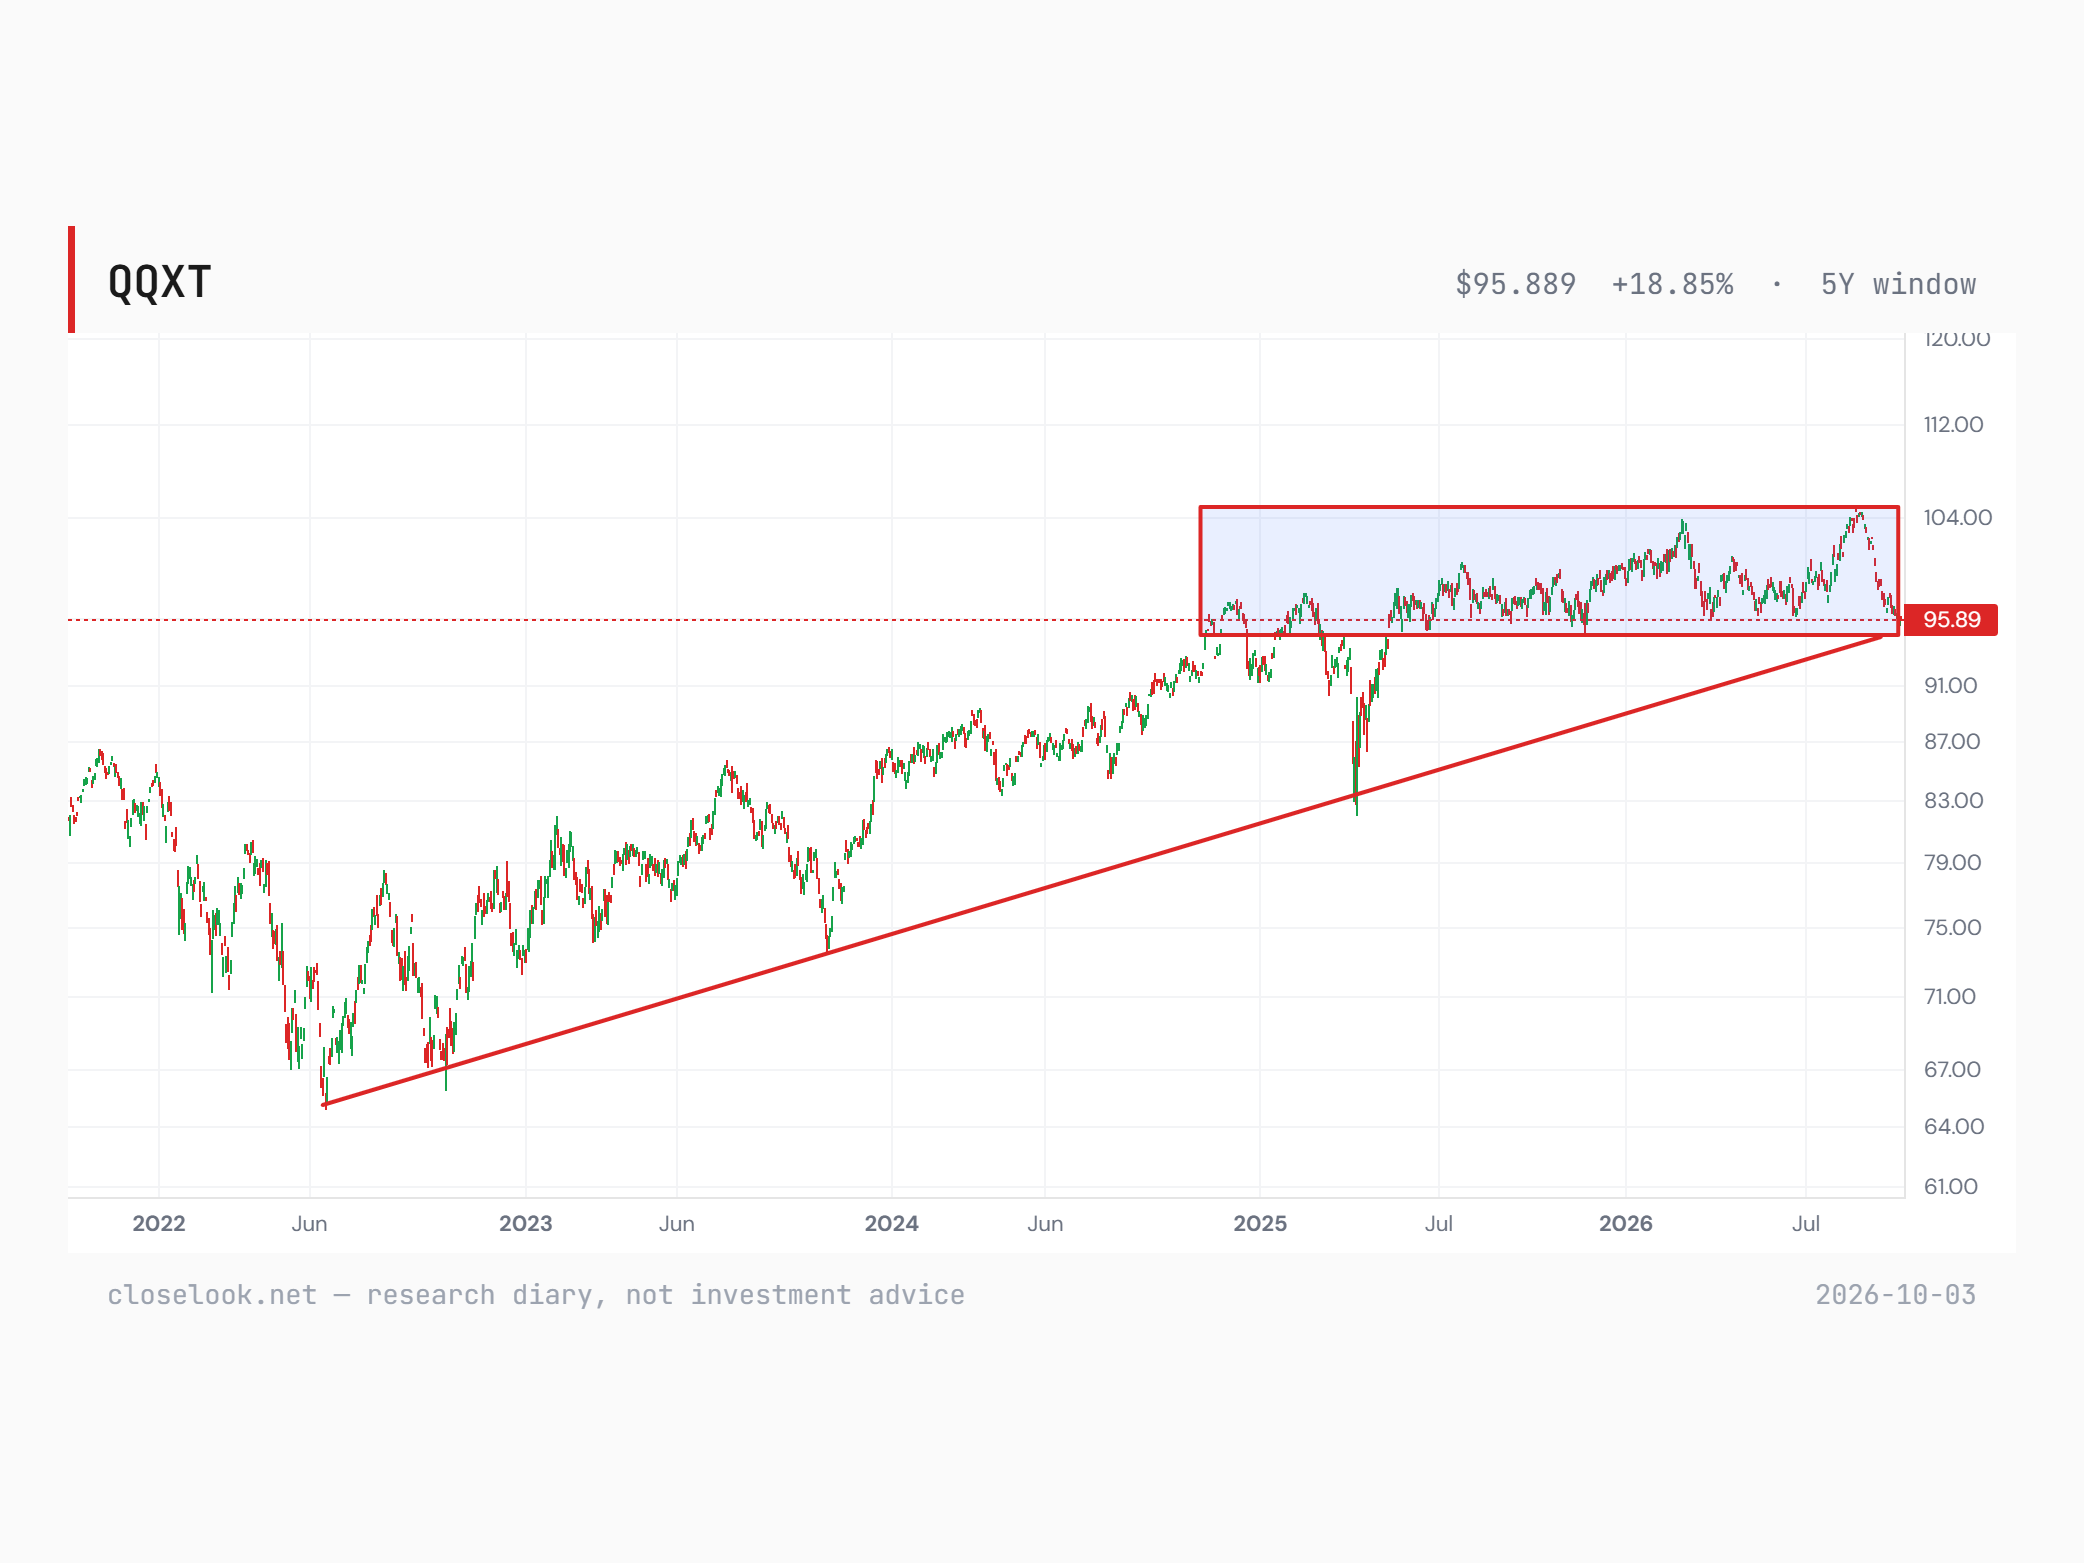
The charts this diary drew or picked on First Trust NASDAQ-100 Ex-Technology Sector Index Fund, as published — each dated and linked to the piece that explains it.

Signals for this name

Every Closelooknet reading that exists for QQXT, from the same nightly bakes the boards use. Research diary readings, not advice.

Closelooknet ETF read

Our dispersion engine · constituent internals

confirming down · Broad decline - breadth is falling with price. — last 21 sessions: price −6.8%, advance/decline −3.09 per name

WindowFundMedian holdingBeat / lag the fundUp / downDispersion
Day +0.5% +0.3% 21 / 35 35 / 20 1.6pp
Week +0.4% −0.3% 26 / 30 28 / 28 4.1pp
Month −6.8% −6.0% 33 / 23 8 / 48 7.8pp
Year to date −2.3% +2.7% 31 / 24 30 / 25 29.0pp

Drove the month TSLA +7.6% · ISRG +9.4% · WBD +7.3% · ALNY +7.1% · WMT +3.5%

Dragged the month AXON −29.2% · BKNG −21.5% · PAYX −18.8% · ODFL −13.0% · ABNB −16.3%

Computed by the Closelooknet dispersion engine from the full constituent roster (56 names, 100% of weight) · as of 2026-09-25 · full dispersion read → · methodology · descriptive, not advice.

Mentioned on Closelooknet 25 pieces · newest: Morning 10, “Nasdaq - a record close in the worst month of a midterm year, right after the bulls gave up” (2026-09-22)

Mentioned on Closelooknet

Where QQXT appears in the diary — 25 pieces, newest first. Every link is our own writing.

Long reads

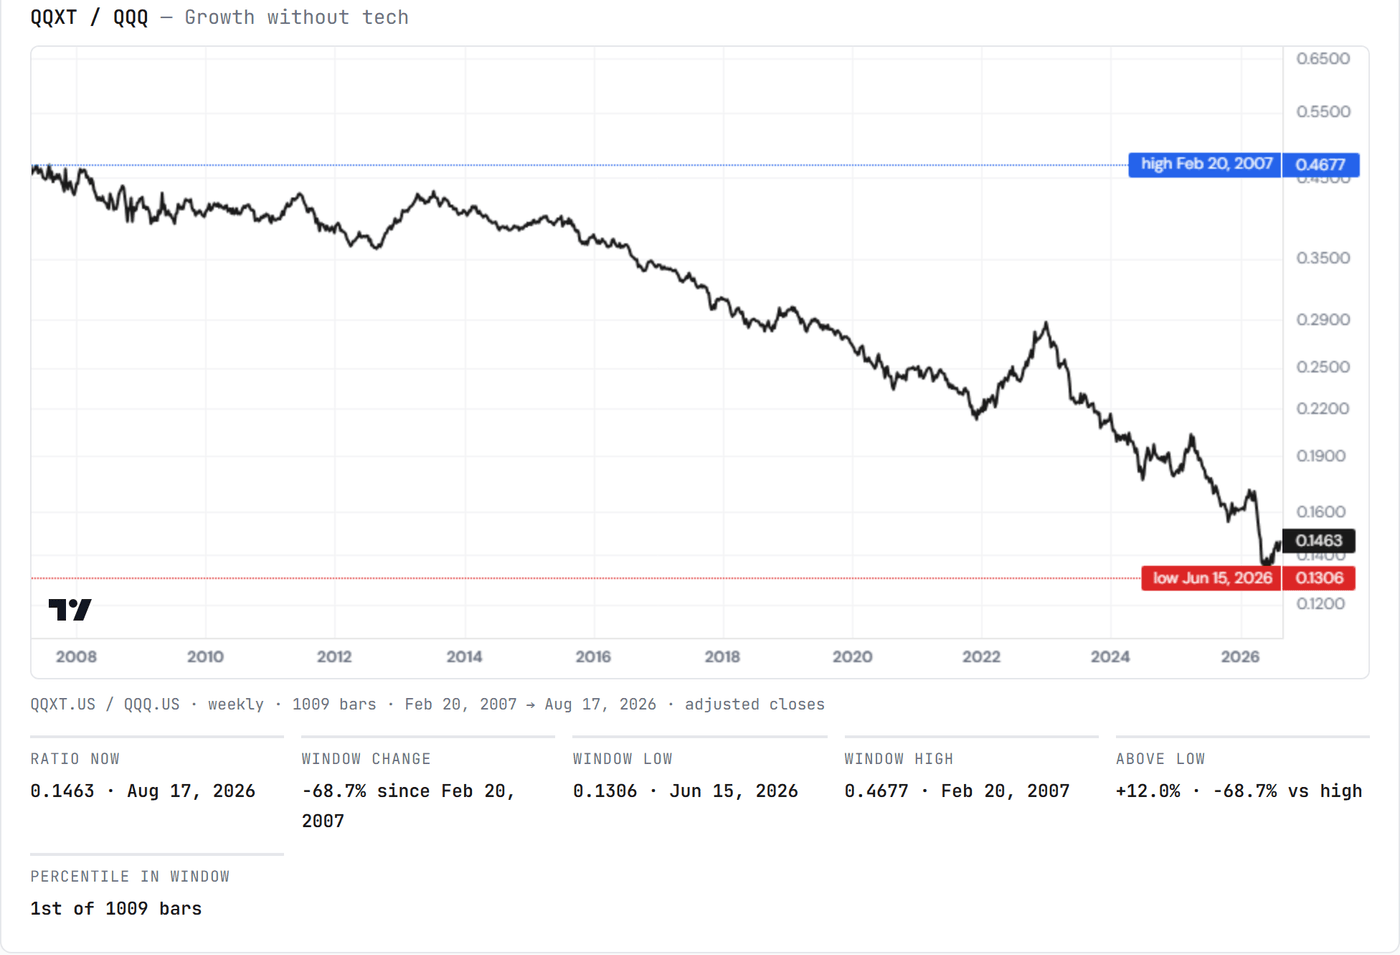
  • Software vs Semis — The Axis TurnedWeekly Signal · 23 Aug 2026Growth without tech, as one line: QQXT / QQQ weekly since 2007, log scale.
  • Software vs Semis — The Tape Split in TwoWeekly Signal · 5 Jul 2026The Nasdaq cuts we track sharpen it: Cut Week Top 20 US (TOPT) +2.6% N100 ex-Tech (QQXT) +2.2% N100 equal weight (QQQE) +1.2% N100 Top 30 (QTOP) +1.0% N100 Tech (QTEC) −0.4% Read it bottom-up: inside the Nasdaq-100, everything that is not…
  • Much More Than Semis — The Broadening Tech BullWeekly Signal · 4 May 2026QQXT · Nasdaq 100 Ex-Tech Sleeve · No Breakout QQXT — the ex-technology sleeve of the same index — sits at the upper boundary of its regression channel but has not broken out.

101 and glossary

  • Magnificent SevenGlossaryHow Closelooknet uses it The Mag Pulse board tracks the seven against a hand-set trendline; the ex-tech Nasdaq fund QQXT is the control group — the index without the leaders — and was negative on the year in September 2026 while the…

Dailies

Weather around the name 4 macro readings: Money Temperature, Factor regime, Region breadth …

The weather around this name

Macro readings that apply by membership — the regime, the factor tape, the sector cell, the funding backdrop.

  • Money Temperature Composite 62/100 · S&P 500 fund at 67, bullish alignedEight instruments scored on position, momentum, volume, volatility and fragility — the regime every name trades inside. Temperature lab → 2026-09-25
  • Factor regime Momentum leading — risk appetite buildingMomentum against low volatility (SPMO / SPLV): above its 50-day trend, 99th percentile of the window, +8.4% over 20 sessions. Factor regime → 2026-09-25
  • Region breadth US: 2 of 11 sectors up on the month · leading Technology +7.5%, lagging Utilities −8.5%The Sector Engine column for the market this fund tracks — how many of its eleven sectors are rising and which ones lead, the internals behind the fund's own move. Sector Engine → 2026-09-26
  • Sovereign pressure Index 0.61 · up 0.29 over 21 sessionsG7 long-end yields, 10s30s and the slope — the funding weather for every balance sheet on this site. Sovereign pressure → 2026-09-25
How it trades on rate days beta 0.39 to TLT · on the worst bond days it moved with the market

How it trades on rate days

How QQXT has moved when long-dated Treasury yields rise — measured against TLT, the 20+ year Treasury fund.

  • Beta to long bonds, 1 year 0.39 — tends to move with bonds for every 1% move in TLT (20+ year Treasuries), First Trust NASDAQ-100 Ex-Technology Sector Index Fund moved 0.39% on average · correlation 0.32 · higher than 39% of US names
  • Beta, last 3 months 0.52 about the same as over the year
  • On the 10 worst bond days −0.71% on average against −0.74% for the S&P 500 the 10 sessions of the past year in which TLT fell most, i.e. long yields rose most
  • Latest of those days −0.43% TLT −1.29% that day 2026-09-24

Daily total returns from the adjusted price series; a TLT down day is a day long yields rose. Beta = the average move of the name for a 1% move in TLT. Past sensitivity, not a forecast. An investment diary, not a recommendation.

Dividends and capital return trailing yield 1.47%, quarterly · last 0.19 USD on 2026-09-24

Dividends and capital return

What QQXT pays out and buys back — distributions read from the price series, money terms from the filings.

  • Trailing 12 months 1.42 USD per share · a 1.47% yield on the 2026-09-25 close 5 distributions, paid quarterly 2026-09-25
  • Change on the year +95.9% against the prior twelve months prior twelve months 0.73 USD per share
  • Last distribution 0.19 USD per share as the price series records it, within days of the ex-date 2026-09-24
  • By calendar year 2023: 0.40 USD (partial) · 2024: 0.91 USD · 2025: 1.20 USD · 2026: 0.58 USD to date first distribution recorded in the three-year window: 2023-12-22

Per-share amounts are derived from the adjusted price series in the listing currency, so dates sit within days of the ex-date; filing figures come from the fundamentals feed for the last reported fiscal year. An investment diary, not a recommendation.

About First Trust NASDAQ-100 Ex-Technology Sector Index Fund

First Trust NASDAQ-100 Ex-Technology Sector Index Fund (QQXT) is an exchange-traded fund that trades on US exchanges. Closelooknet tracks it as a benchmark: the dailies and the sector dispersion board quote it as a market reference, and the holdings card above matches its largest positions against the names with a Closelooknet page. It is a constituent of Closelooknet benchmark ETF set.

closelook.net is an investment research diary — market structure, index membership and scores are our own readings, not investment advice. Related: index compare · sector dispersion · scanner.

FAQ · from the current data · as of 2026-09-26

Quick answers

What is First Trust NASDAQ-100 Ex-Technology Sector Index Fund (QQXT)?

First Trust NASDAQ-100 Ex-Technology Sector Index Fund is an exchange-traded fund trading as QQXT on the US exchange (US) and is one of the benchmark ETFs Closelooknet tracks as a market reference, as of the registry build of 2026-09-26.

How does Closelooknet use QQXT?

As a benchmark: the daily editions, the sector dispersion board and the index dashboards quote First Trust NASDAQ-100 Ex-Technology Sector Index Fund as a market reference, and this page matches the fund's largest holdings against the names Closelooknet covers so a reader can move from the fund to the companies inside it.

Where does QQXT trade against its moving averages?

Mixed moving-average stack: Trades -3.7% vs the 50-day and -2.7% vs the 200-day average, 7.7% below the 52-week high and +2% off the 52-week low; a golden cross printed 31 sessions ago. Computed from daily closes. As of 2026-09-25 — a technical state from the nightly Closelooknet bake, not advice. The Technical tab carries the full row.

What does the Closelooknet dispersion engine say about QQXT?

Broad decline - breadth is falling with price. (confirming down, last 21 sessions). Over 21 sessions the fund moved −6.8% while the median holding moved −6.0%; 33 of 56 holdings beat the fund and 8 rose. Against the S&P 500 fund it is −7.5pp over the same window. The top ten holdings carry 21.6% of the weight (effective N 55.0). As of 2026-09-25, computed from the full constituent roster — the full dispersion read carries the series; a descriptive reading from Closelooknet's research diary, not advice.

How does First Trust NASDAQ-100 Ex-Technology Sector Index Fund trade when bond yields rise?

Over the past year First Trust NASDAQ-100 Ex-Technology Sector Index Fund had a beta of 0.39 to TLT, the long-dated Treasury fund — it tends to move with bonds, higher than 39% of US names. On the 10 sessions in which long bonds fell most it moved −0.71% on average, against −0.74% for the S&P 500. The "How it trades on rate days" block on this page carries the lines.

Where has Closelooknet written about First Trust NASDAQ-100 Ex-Technology Sector Index Fund?

First Trust NASDAQ-100 Ex-Technology Sector Index Fund appears in 25 Closelooknet pieces, most recently Morning 10: Nasdaq - a record close in the worst month of a midterm year, right after the bulls gave up (2026-09-22); Midday 10: Nasdaq — a record print at 27,272, chips extend, software sold from its highs; AMD joins the trillion club (2026-09-22); Midday 10: Chips and Crypto — Arm +14%, Intel +13% and bitcoin at 85,700, with bonds bid and gold sold (2026-09-21). What Closelooknet said most recently: QQXT, the Nasdaq 100 with technology stripped out, closed at $97.60 on Monday. (Morning 10, 2026-09-22). The "Mentioned on Closelooknet" block on this page lists the long reads, the reference entries and the dailies that name it.

Does First Trust NASDAQ-100 Ex-Technology Sector Index Fund pay a dividend?

First Trust NASDAQ-100 Ex-Technology Sector Index Fund has paid 1.42 USD per share over the last twelve months, paid quarterly, a trailing yield of 1.47% on the 2026-09-25 close; the last distribution recorded in the price series was 0.19 USD on 2026-09-24. The "Dividends and capital return" block on this page carries the lines.

What does this page show?

A live price chart with SMA overlays and drawing tools for QQXT, fund basics and the top holdings by weight with the Closelooknet names among them marked, the technical state where the data exists, and the research diary mentions — an investment research diary view, not investment advice.