—

Robinhood Markets Inc (HOOD) — chart, structure and Closelooknet read

The Closelooknet read

Robinhood runs a retail brokerage app that lets people trade stocks, ETFs and depositary receipts, often in fractional amounts or on margin. It adds crypto trading, options and futures, a cash card, a credit card and a retirement offering, plus in-app education content that explains investing basics to new users.

Detail below: the desk's view, the earnings record, peers and the company snapshot; daily prices on the price-history tab. Research diary readings, not advice.

Pick a ticker to load its detail page.

The desk on HOOD

What this diary said about Robinhood Markets Inc, what it holds and what would change its view — in its own words, dated. Investment diary, not advice.

What we hold

BookPositionSinceResult
AI Cycle 2030 (wikifolio) ↗ 25 shares · average entry €106.12 — —
Core and Conviction (wikifolio) ↗ 54 shares · average entry €106.11 — —
The Compound (wikifolio) ↗ 54 shares · average entry €83.75 — —

Model books as of the latest close; wikifolio positions from the official wikifolio data, entries in euros. Results are unrealised, before any exit. A record of what the diary does, not a recommendation to do the same.

What would change our view

12 months from now
Higher, in our view — driven by the bitcoin recovery feeding the transactional engine, the ongoing disruption of the financial industry across the fronts above, and continued market-share gains.
5 years from now
This could be one of the ten biggest and most important financial institutions — meaningfully higher, in our view. The super-app bundling, the tokenization rails and the retirement and private-markets fronts are the path; execution and regulation are the gates.

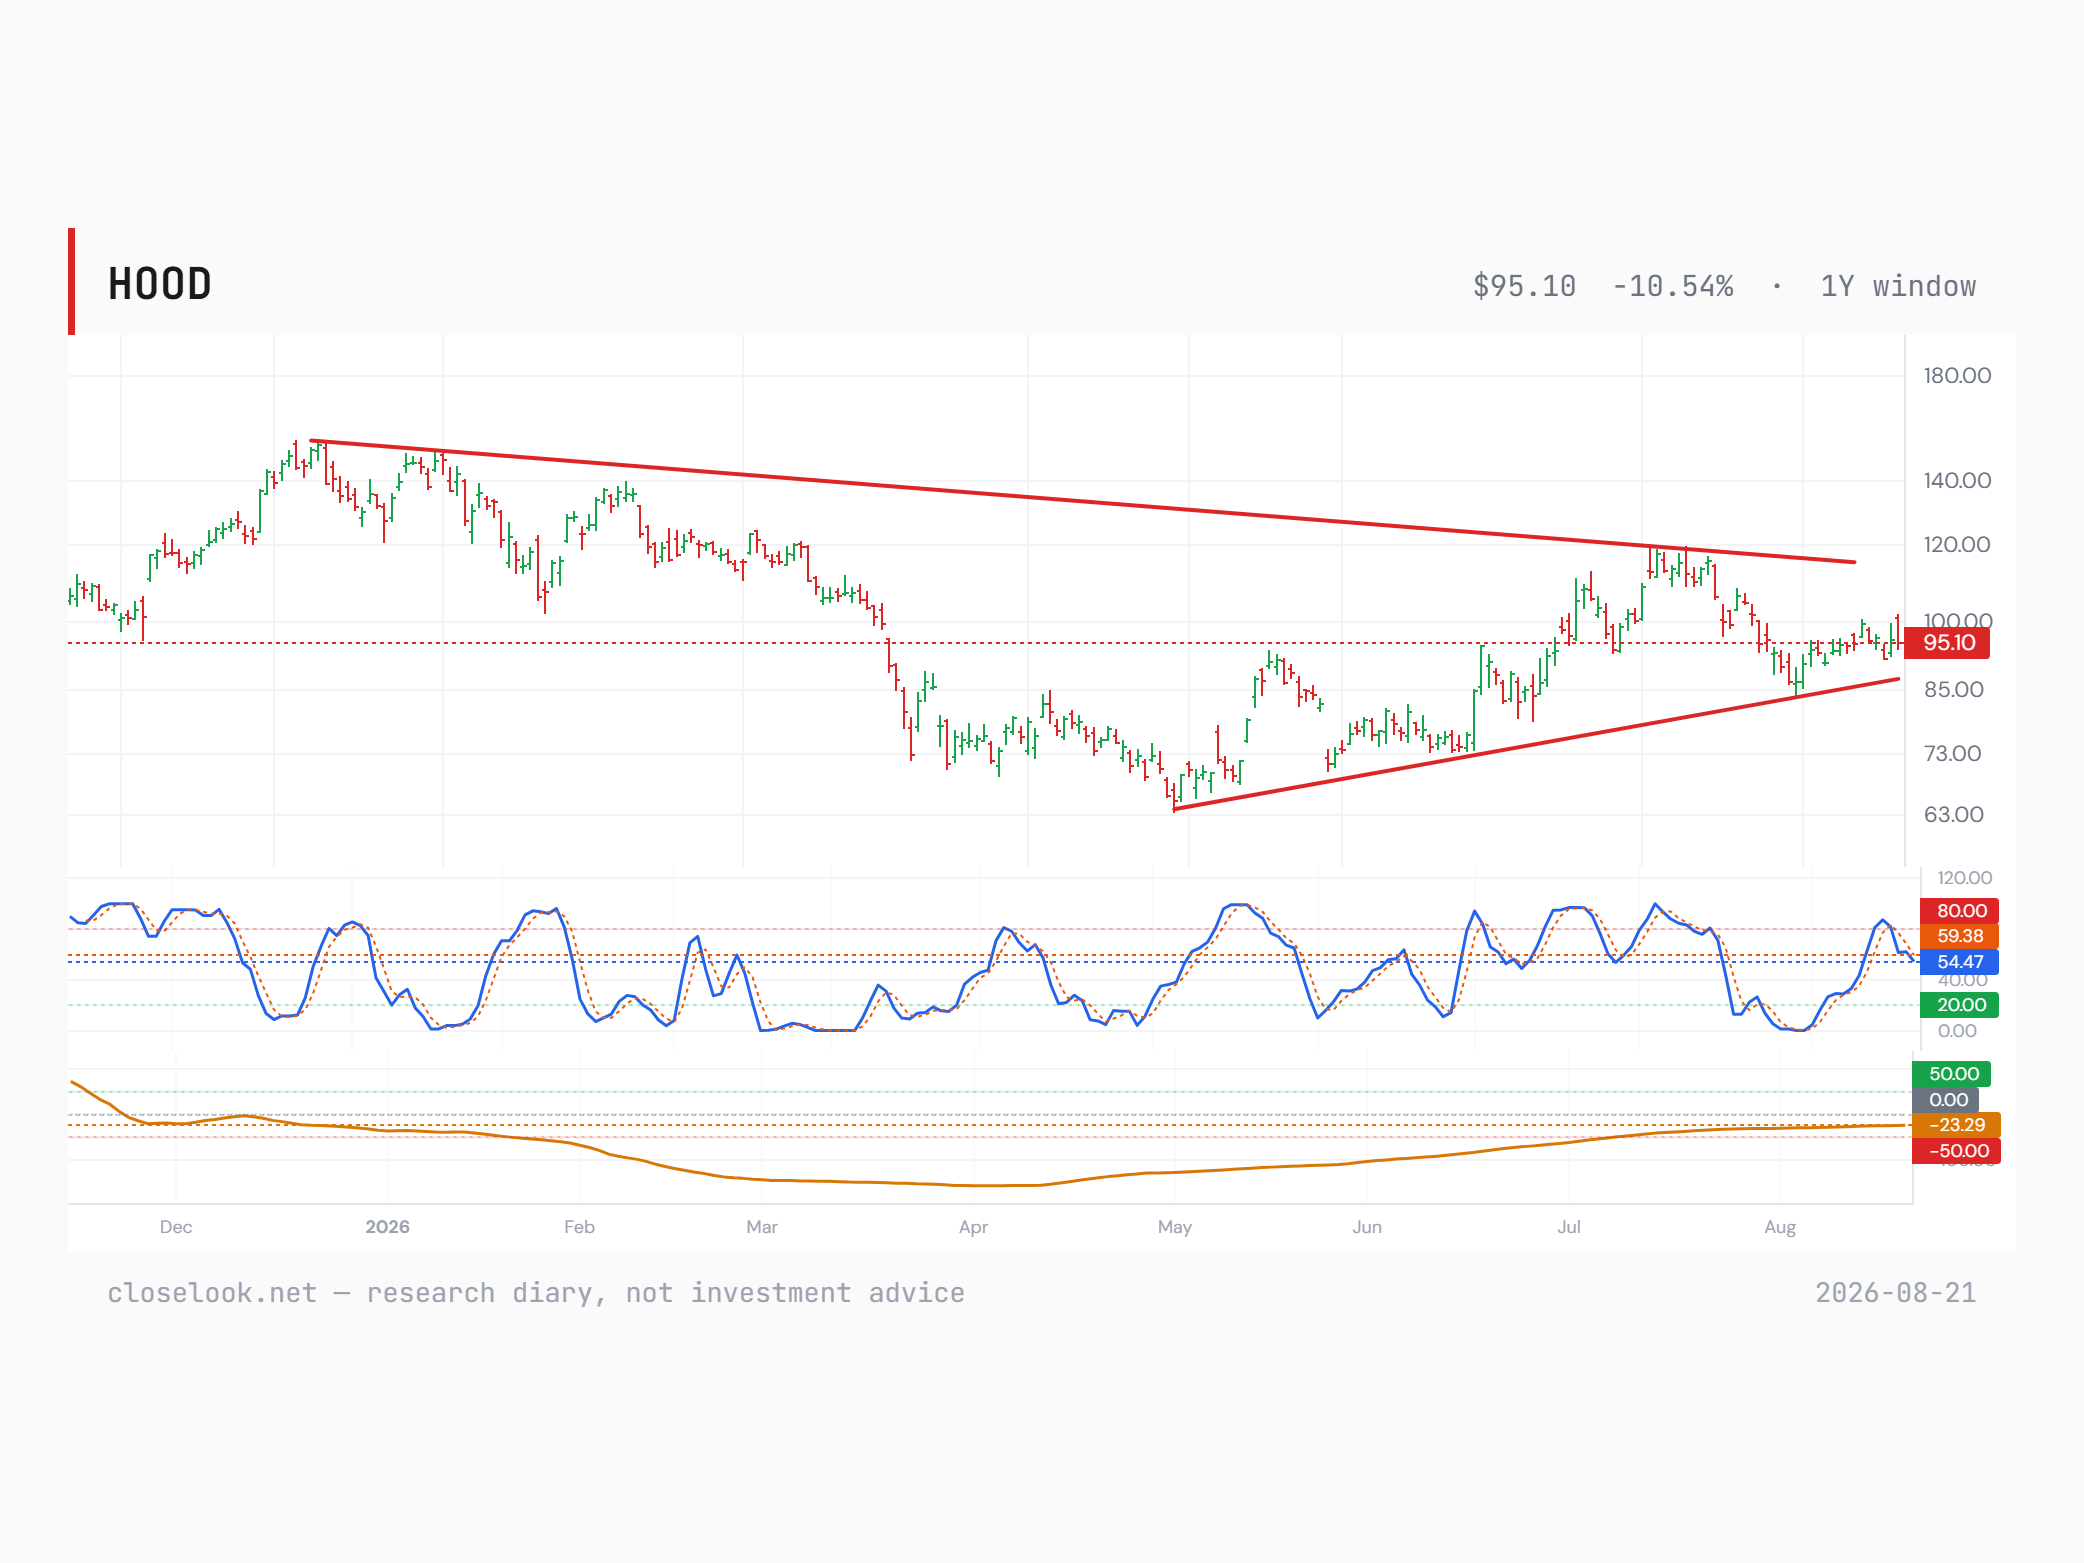
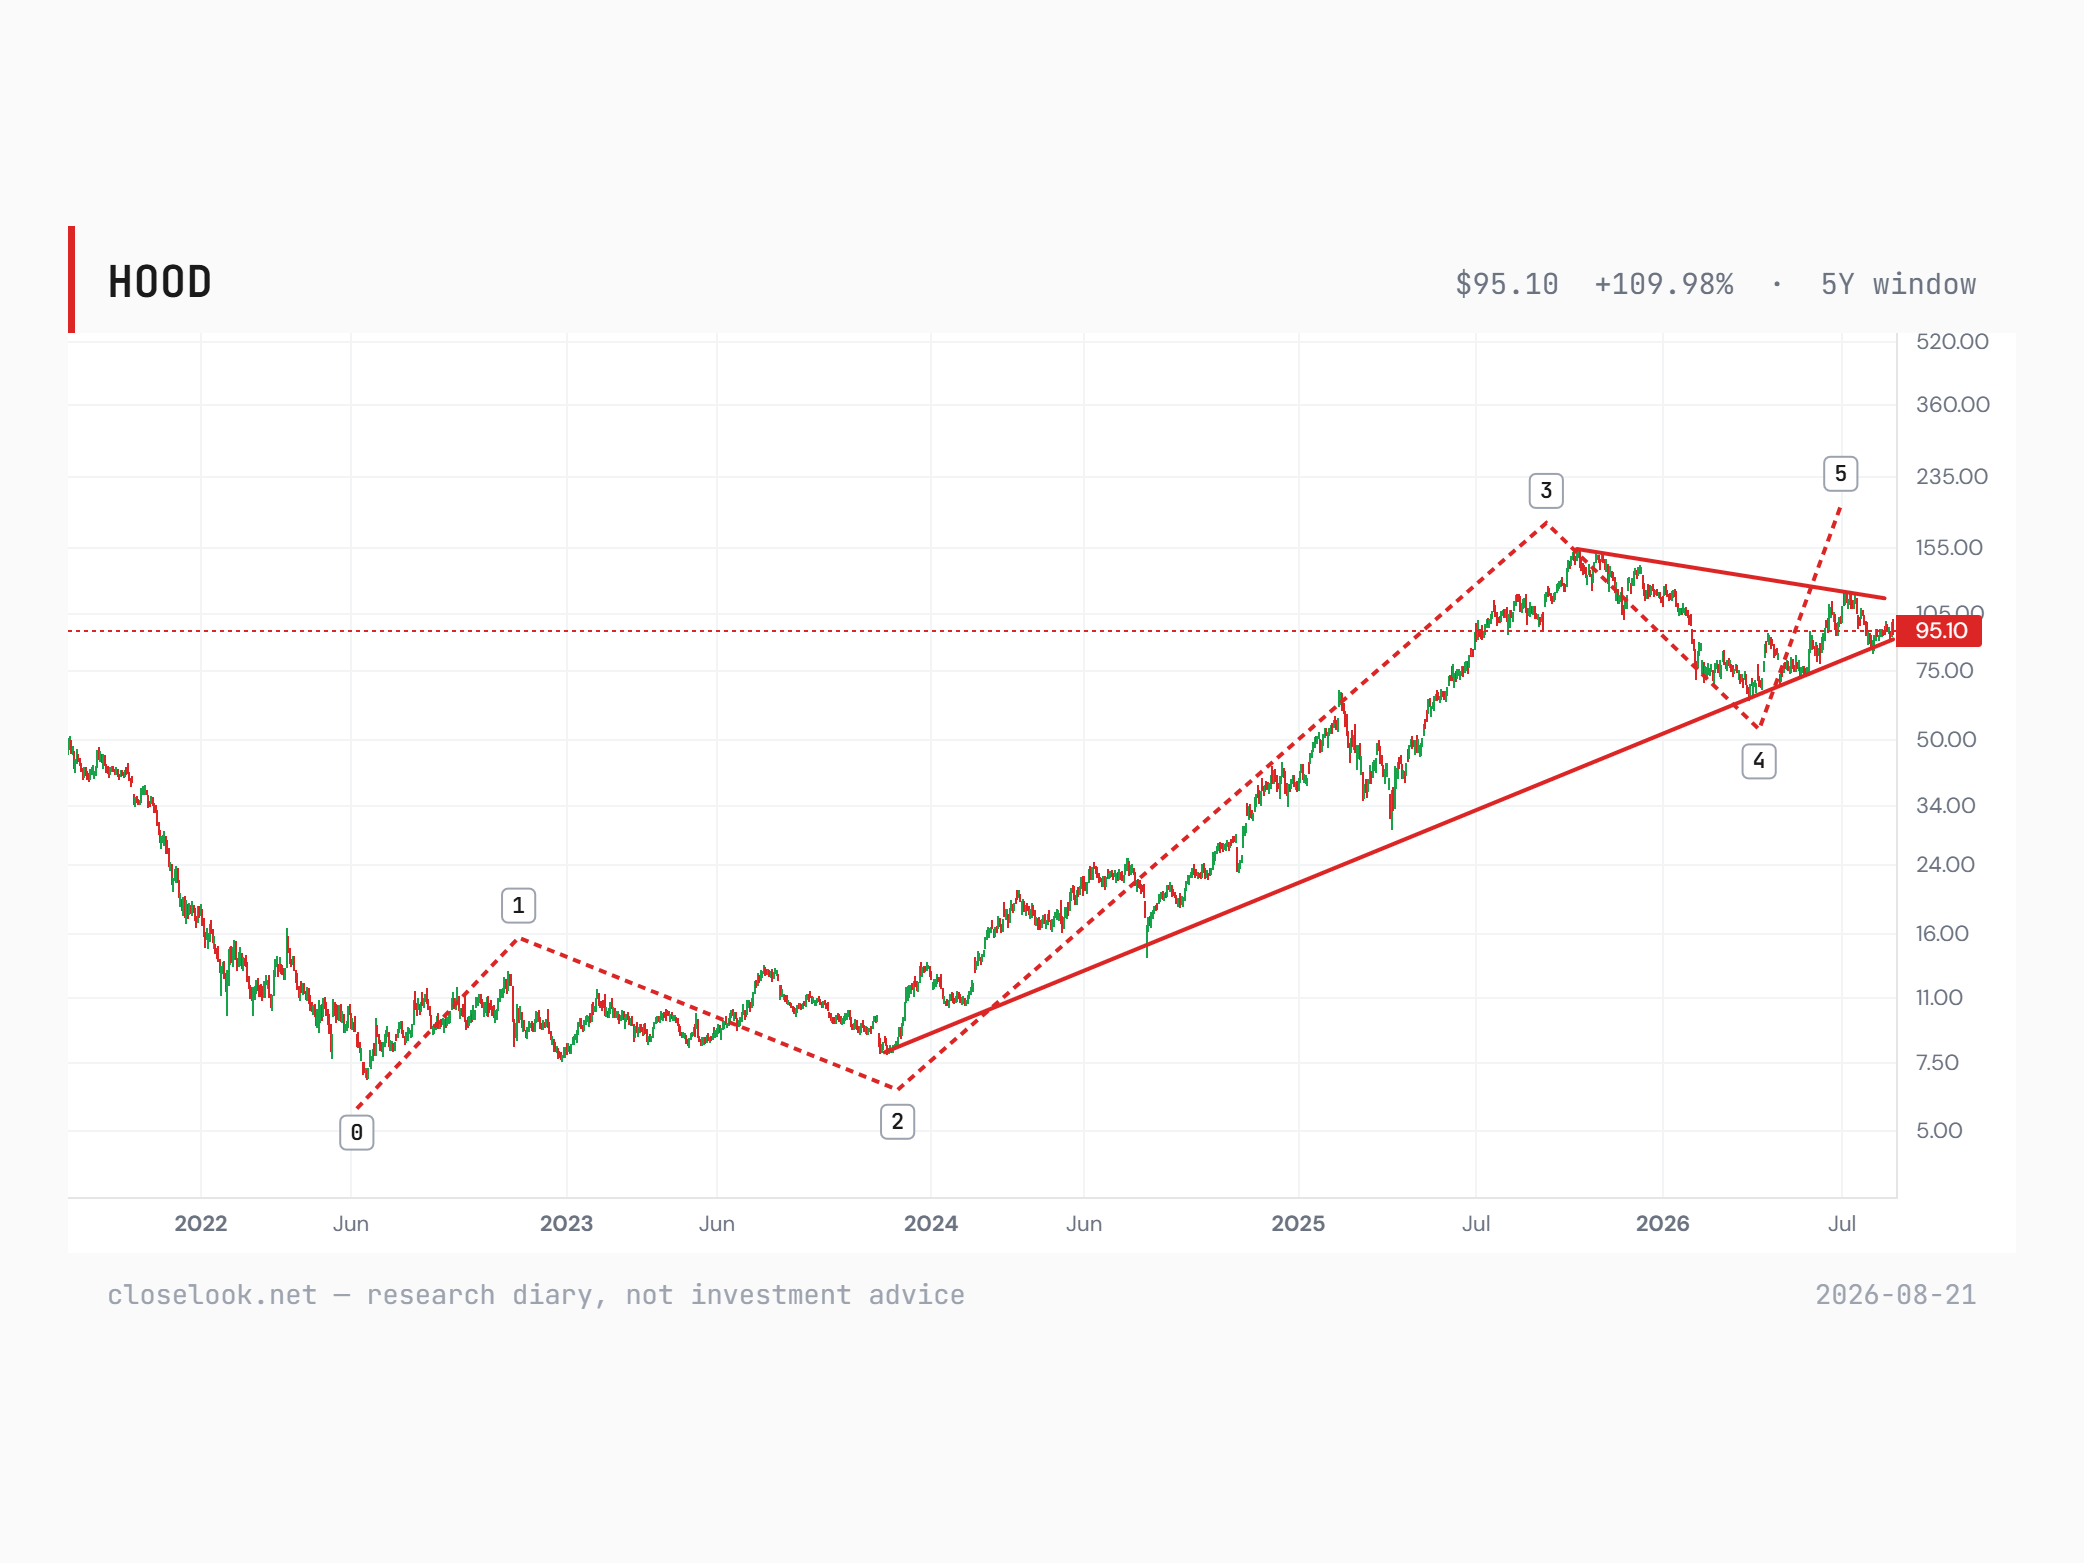
From the Chart Pick of 21 Aug 2026, scored publicly.

Our record on HOOD

Every scored call, pick and trade this diary has made on Robinhood Markets Inc, with the outcome where it is known.

Charts from the desk on HOOD

The charts this diary drew or picked on Robinhood Markets Inc, as published — each dated and linked to the piece that explains it.

Signals for this name

Every Closelooknet reading that exists for HOOD, from the same nightly bakes the boards use. Research diary readings, not advice.

Mentioned on Closelooknet 10 pieces · newest: Daily Pulse, “Bitcoin and Gold — The Has-Been Breaks Out, the Darling Rolls Over” (2026-09-21)

Mentioned on Closelooknet

Where HOOD appears in the diary — 10 pieces, newest first. Every link is our own writing.

Dailies

Weather around the name 3 macro readings: Money Temperature, Factor regime, Sovereign pressure

The weather around this name

Macro readings that apply by membership — the regime, the factor tape, the sector cell, the funding backdrop.

  • Money Temperature Composite 46/100 · S&P 500 fund at 49, above its 200-day averageEight instruments scored on position, momentum, volume, volatility and fragility — the regime every name trades inside. Temperature lab → 2026-10-30
  • Factor regime Defensive rotation — low-vol leading, regime-change watchMomentum against low volatility (SPMO / SPLV): below its 50-day trend, 81th percentile of the window, -13.7% over 20 sessions. Factor regime → 2026-10-29
  • Sovereign pressure Index -1.66 · down 2.24 over 21 sessionsG7 long-end yields, 10s30s and the slope — the funding weather for every balance sheet on this site. Sovereign pressure → 2026-10-30
How it trades on rate days beta 1.19 to TLT · on the worst bond days it fell more than the market

How it trades on rate days

How HOOD has moved when long-dated Treasury yields rise — measured against TLT, the 20+ year Treasury fund.

  • Beta to long bonds, 1 year 1.19 — moves strongly with bonds for every 1% move in TLT (20+ year Treasuries), Robinhood Markets Inc moved 1.19% on average · correlation 0.16 · higher than 89% of US names
  • Beta, last 3 months 0.80 less rate-sensitive lately than over the year
  • On the 10 worst bond days −2.46% on average against −0.74% for the S&P 500 the 10 sessions of the past year in which TLT fell most, i.e. long yields rose most
  • Latest of those days −1.53% TLT −1.29% that day 2026-09-24

Daily total returns from the adjusted price series; a TLT down day is a day long yields rose. Beta = the average move of the name for a 1% move in TLT. Past sensitivity, not a forecast. An investment diary, not a recommendation.

Who it is priced against Capital Markets · 8 names with week and year-to-date

Peer group

Capital Markets

This name carries no Closelooknet score, so its cohort ranks on trend state — distance to the 50- and 200-day averages — never on a score it does not have.

Compared against HOOD on the nightly bakes; the Peers tab ranks the cohort on the Closelooknet scores where it exists.

Company snapshot — Robinhood Markets Inc

HOOD in five paragraphs: what it makes and sells, where it sits in the Closelooknet stack, who it is priced against, why we track it, what we watch. Research diary, not advice.

What it does
Robinhood runs a retail brokerage app that lets people trade stocks, ETFs and depositary receipts, often in fractional amounts or on margin. It adds crypto trading, options and futures, a cash card, a credit card and a retirement offering, plus in-app education content that explains investing basics to new users. It listed in 2021 and is based in Menlo Park, California.
Where it sits in the stack
Robinhood carries no Closelooknet index seat; it sits in our Financial Services universe, in the Capital Markets sleeve alongside other retail-facing brokerages. It is not a constraint or customer inside the AI build-out stack; its business is trading access, not chips, tools or data-centre infrastructure.
Who it is priced against
No peer group is set for this name in the diary; the comparison the market draws is with other retail brokerages such as Charles Schwab and Interactive Brokers.
Why Closelooknet tracks it
It holds no seat in our indices, so it is not scored on any module the diary tracks; one quote references a Chart Pick edition, but that score is still being built rather than confirmed. It appears in the diary's quotes when crypto moves swing its trading volumes.
What the diary watches
Whether swings in bitcoin and other crypto prices keep driving the stock's day-to-day moves, since its crypto trading revenue tracks that volatility closely.

Robinhood Markets Inc (HOOD) trades on US exchanges.

Written from the company’s public profile and Closelooknet’s own readings, 2026-09-17. Descriptive, refreshed with the registry; corrections welcome via the imprint. closelook.net is an investment research diary — market structure, index membership and scores are our own readings, not investment advice. Related: index compare · sector dispersion · scanner.

The Street on this name 17 analyst actions on the wire · latest: price target by Truist Securities, 2026-10-30

The Street on this name

Analyst actions and the latest print for HOOD from the Closelooknet wires — third-party opinions on the record, not our readings.

  • Price target Truist Securities — target 123 Target set to $123 (+34.3% to spot) 2026-10-30
  • Price target KeyBanc — target 135 from 140 Target cut to $135 from $140 (+46.8% to spot) 2026-10-28
  • Price target Scotiabank — target 124 Target set to $124 (+31.1% to spot) 2026-10-28

17 actions on the analyst wire since 2026-08-13: 1 downgrade, 16 target changes. Analyst wire → · Earnings wire →

FAQ · from the current data · as of 2026-10-31

Quick answers

What is Robinhood Markets Inc (HOOD)?

Robinhood Markets Inc trades as HOOD on the US exchange in the Closelooknet research universe, as of the registry build of 2026-10-31.

Is HOOD in a Closelooknet index?

Not currently — Robinhood Markets Inc is tracked in the Closelooknet research universe but is not a constituent of a Closelooknet functional index as of 2026-10-31.

Where does HOOD trade against its moving averages?

Robinhood Markets Inc trades 21.7% below its 50-day and 8.2% below its 200-day moving average (15.8% below its 20-day). As of 2026-10-30 — a technical state from the nightly Closelooknet bake, not advice. The Technical tab carries the full row.

How does Robinhood Markets Inc compare with its peers?

Against its peer group (Capital Markets), Robinhood Markets Inc (HOOD) sits 43.5% below its 52-week high, 21.7% below its 50-day average; Futu Holdings Ltd (FUTU) is 50.6% below, PJT Partners Inc (PJT) is 23.1% below, Compagnie Financiere Tradition (CFT.SW) is 26.6% below, as of 2026-10-30. Put any of them next to HOOD in the chart grid (2×1 or 2×2) and the page lays the companies side by side: performance, trend, valuation, margins and our money-flow reading.

How does Robinhood Markets Inc trade when bond yields rise?

Over the past year Robinhood Markets Inc had a beta of 1.19 to TLT, the long-dated Treasury fund — it moves strongly with bonds, higher than 89% of US names. On the 10 sessions in which long bonds fell most it moved −2.46% on average, against −0.74% for the S&P 500. As of 2026-10-30; The "How it trades on rate days" block on this page carries the lines.

Where has Closelooknet written about Robinhood Markets Inc?

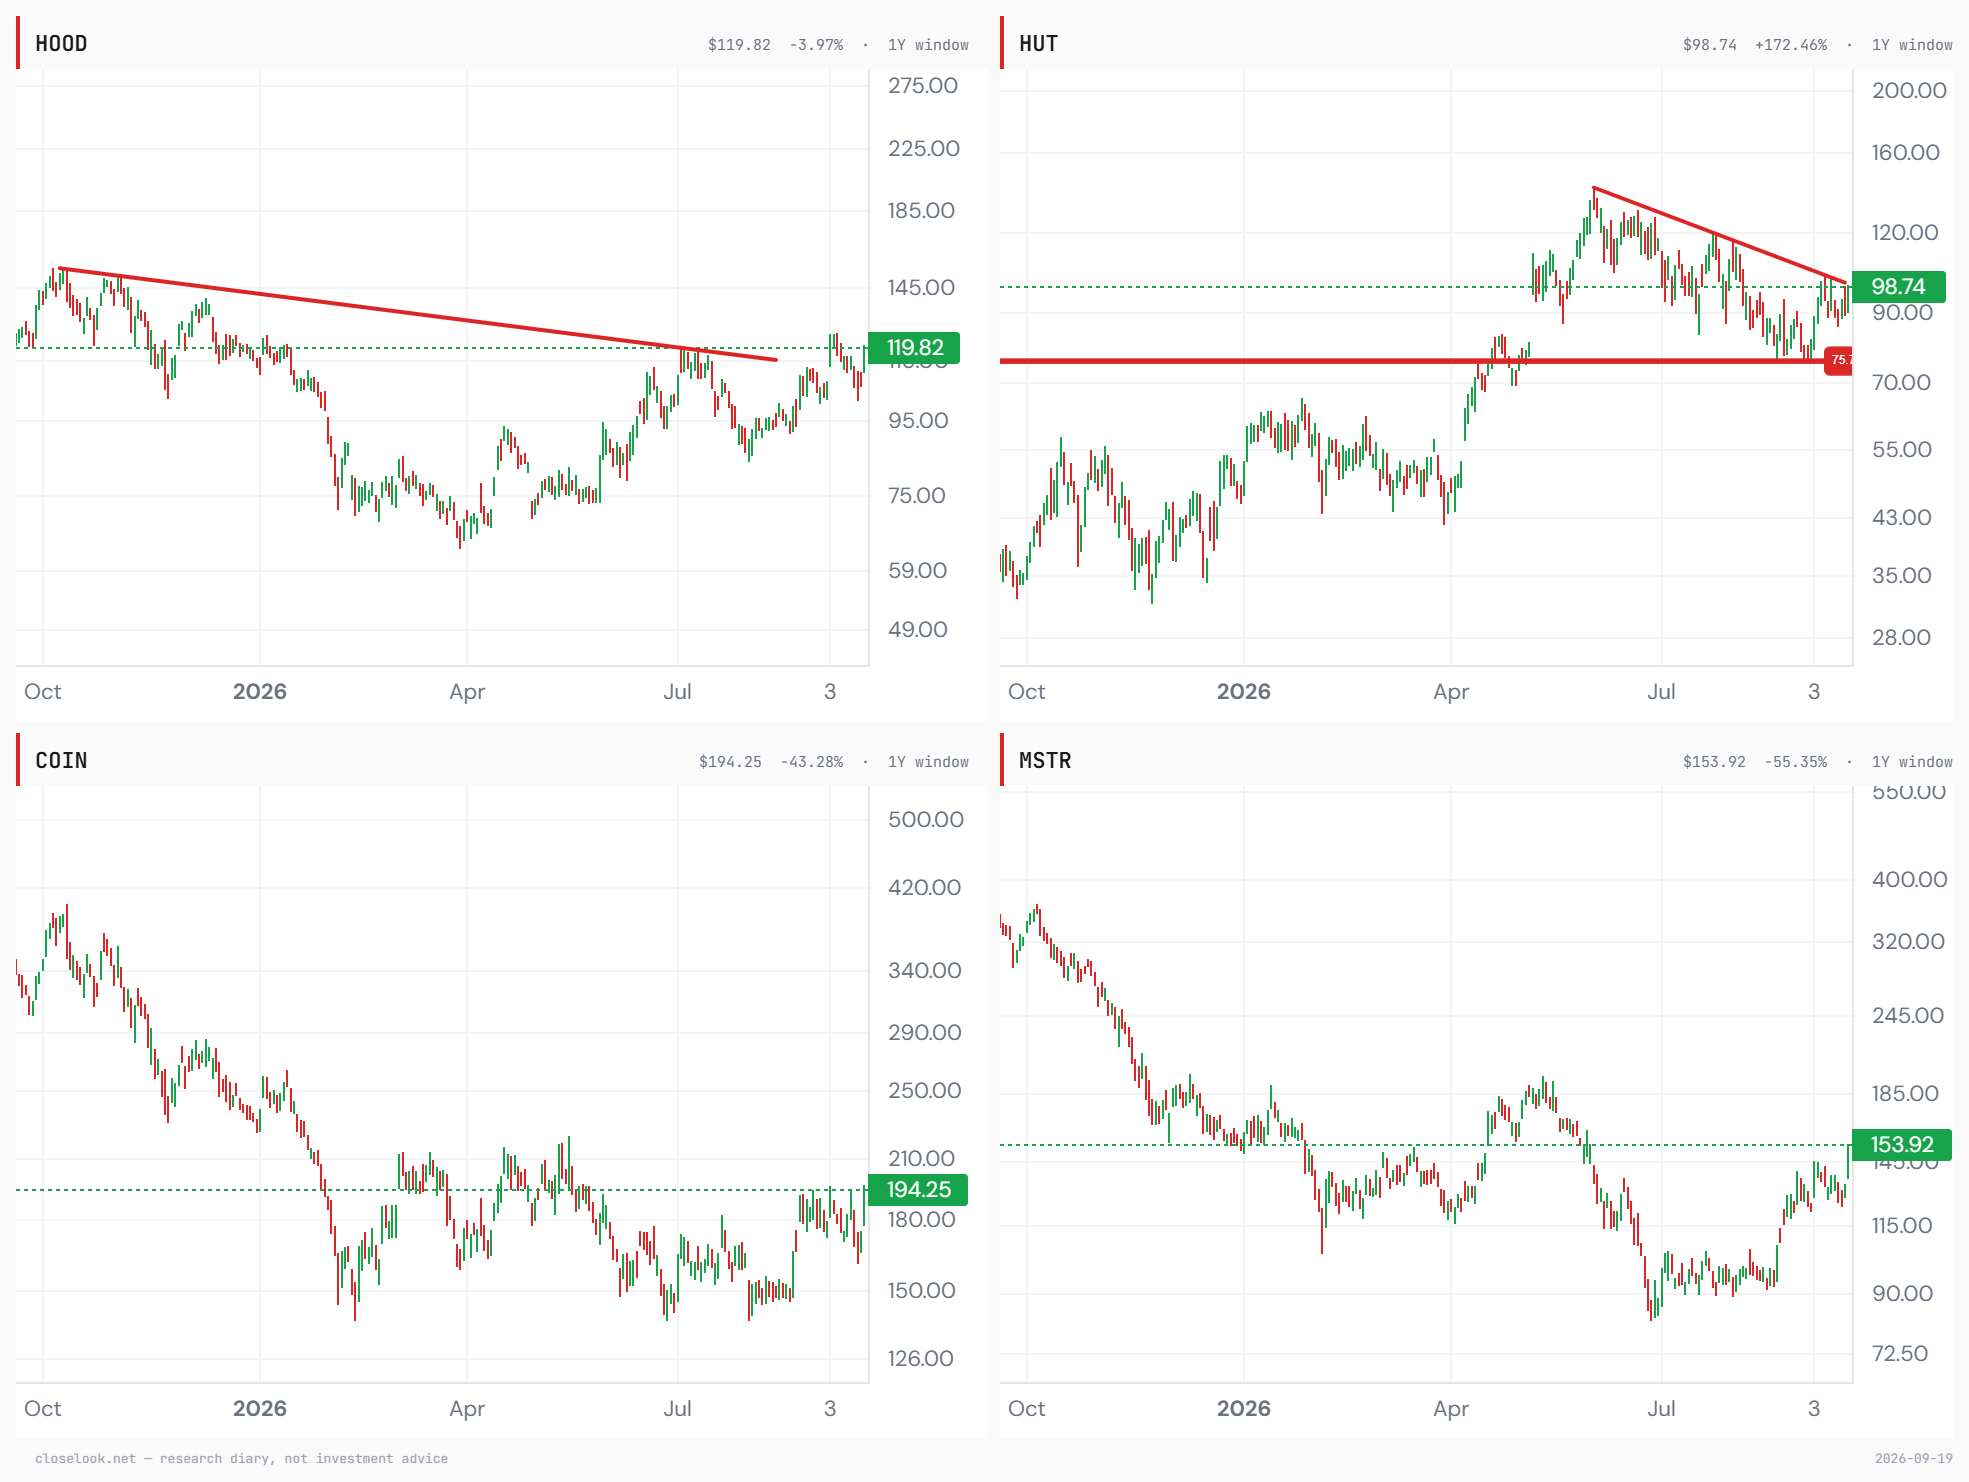
Robinhood Markets Inc appears in 10 Closelooknet pieces as of 2026-10-31, most recently Daily Pulse: Bitcoin and Gold — The Has-Been Breaks Out, the Darling Rolls Over (2026-09-21); Midday 10: Chips and Crypto — Arm +14%, Intel +13% and bitcoin at 85,700, with bonds bid and gold sold (2026-09-21); Weekly Signal: Bitcoin — New Life for the Coins and the Stocks (2026-09-20). What Closelooknet said most recently: Friday's closes from the Closelook data lake: Table as text Name Friday close Friday Strategy (MSTR) 153.92 +16.4% Marathon (MARA) 13.24 +13.8% Coinbase (COIN) 194.25 +11.7% Robinhood (HOOD) 119.82 +9.1% Riot (RIOT) 23.75 +8.6% Hut 8… (Daily Pulse, 2026-09-21). The "Mentioned on Closelooknet" block on this page lists the long reads, the reference entries and the dailies that name it.

Does Closelooknet hold Robinhood Markets Inc?

Yes — AI Cycle 2030 (wikifolio): 25 shares · average entry €106.12 (book of 2026-10-30); Core and Conviction (wikifolio): 54 shares · average entry €106.11 (book of 2026-10-30); The Compound (wikifolio): 54 shares · average entry €83.75 (book of 2026-10-30). A record of what the diary does, not a recommendation to do the same.

What would change Closelooknet's view on Robinhood Markets Inc?

12 months from now: Higher, in our view — driven by the bitcoin recovery feeding the transactional engine, the ongoing disruption of the financial industry across the fronts above, and continued market-share gains. 5 years from now: This could be one of the ten biggest and most important financial institutions — meaningfully higher, in our view. The super-app bundling, the tokenization rails and the retirement and private-markets fronts are the path; execution and regulation are the gates. From the Chart Pick of 2026-08-21, scored publicly.

What does Robinhood Markets Inc do?

Robinhood runs a retail brokerage app that lets people trade stocks, ETFs and depositary receipts, often in fractional amounts or on margin. It adds crypto trading, options and futures, a cash card, a credit card and a retirement offering, plus in-app education content that explains investing basics to new users. It listed in 2021 and is based in Menlo Park, California. No peer group is set for this name in the diary; the comparison the market draws is with other retail brokerages such as Charles Schwab and Interactive Brokers. (Company snapshot of 2026-09-17.)

Where does Robinhood Markets Inc sit in the AI build-out?

Robinhood carries no Closelooknet index seat; it sits in our Financial Services universe, in the Capital Markets sleeve alongside other retail-facing brokerages. It is not a constraint or customer inside the AI build-out stack; its business is trading access, not chips, tools or data-centre infrastructure. It holds no seat in our indices, so it is not scored on any module the diary tracks; one quote references a Chart Pick edition, but that score is still being built rather than confirmed. It appears in the diary's quotes when crypto moves swing its trading volumes. (Company snapshot of 2026-09-17.)

What has Wall Street done on Robinhood Markets Inc recently?

The most recent analyst action on Robinhood Markets Inc on the Closelooknet wire is a price target by Truist Securities on 2026-10-30 (target 123). 17 actions on the analyst wire since 2026-08-13: 1 downgrade, 16 target changes. Analyst actions are third-party opinions recorded by the wire, not Closelooknet readings. The “The Street on this name” block on this page lists the moves; the full feeds are the analyst wire and the earnings wire.

What does this page show?

A live price chart with SMA overlays and drawing tools for HOOD, performance metrics, index-membership context and the Closelooknet structure read — an investment research diary view, not investment advice.
How to use this chart

Toolbar

  • Range — 1M to MAX on daily closes. 1D/5D switch a US stock cell to 5-minute intraday bars; index and foreign cells fall back to 1M daily with a note.
  • Grid — 1×1 up to 2×2. Cells are synchronized: pan or zoom one and the others follow the same dates; the crosshair tracks across all of them. 4 INDICES loads Rubin · HALO · AEI · AW40 side by side.
  • Type / Scale — OHLC, line or area; linear or log price axis.

Picking a series

  • Tap the box in a cell's header to browse every Closelooknet series — headline indices, sub-indices, sectors, layers of all six families — plus the constituents.
  • Or type any ticker (NVDA, 7203.T, ASML.AS …) and press Enter — it charts in the cell straight from our data lake.

Studies

  • Overlays / Oscillators rows toggle the standard set (SMA, Bollinger, RSI, MACD …) per cell.
  • Levels (stock cells) draws the structure engine's support lines — regression bands, pivot cluster, SMA-200, the active fib zone.

Drawing

  • Tap a tool (Trend, Ray, H-Line, Fib, Channel, Rect, Note), then tap the chart once per point — the shape follows your finger or cursor between taps. The chart stops panning while a tool is armed; tap the tool again to release.
  • Drawings save per symbol in this browser and travel between the terminal and the asset page.
  • Delete key removes the selected drawing · Escape cancels a half-placed one · Clear wipes the symbol.

Wave counts

  • Wave places an Elliott count: tap the origin, then each wave end. Press Enter to stop early (inside wave 3 is fine) — dotted ghost targets sketch the remaining waves at guideline ratios.
  • On stocks the scanner's machine count appears automatically in grey — it is fully editable: drag any point, double-tap a label to remove it, Delete to dismiss it for good, Adopt to bring the machine's proposal back.
  • The sequence picker switches 1-5 / A-B-C / A-E / W-X-Y-Z; 1 2 3 cycles the degree; Subdiv starts a one-degree-smaller child count inside a wave.

Sharing

  • Card exports the cell as a branded PNG — chart, drawings and levels exactly as shown.

Related in the Closelooknet universe

then Capital Markets. Scored names rank on their Closelooknet score; names without one rank on trend state — above or below their 50- and 200-day averages — never on a score they do not carry.