Weekly Chart Pick · 2026-08-21
This company printed a record quarter with its crypto revenue down 38%. Now the complex it belongs to has broken a year-long downtrend — and the count reads wave 5 unfolding out of a coil
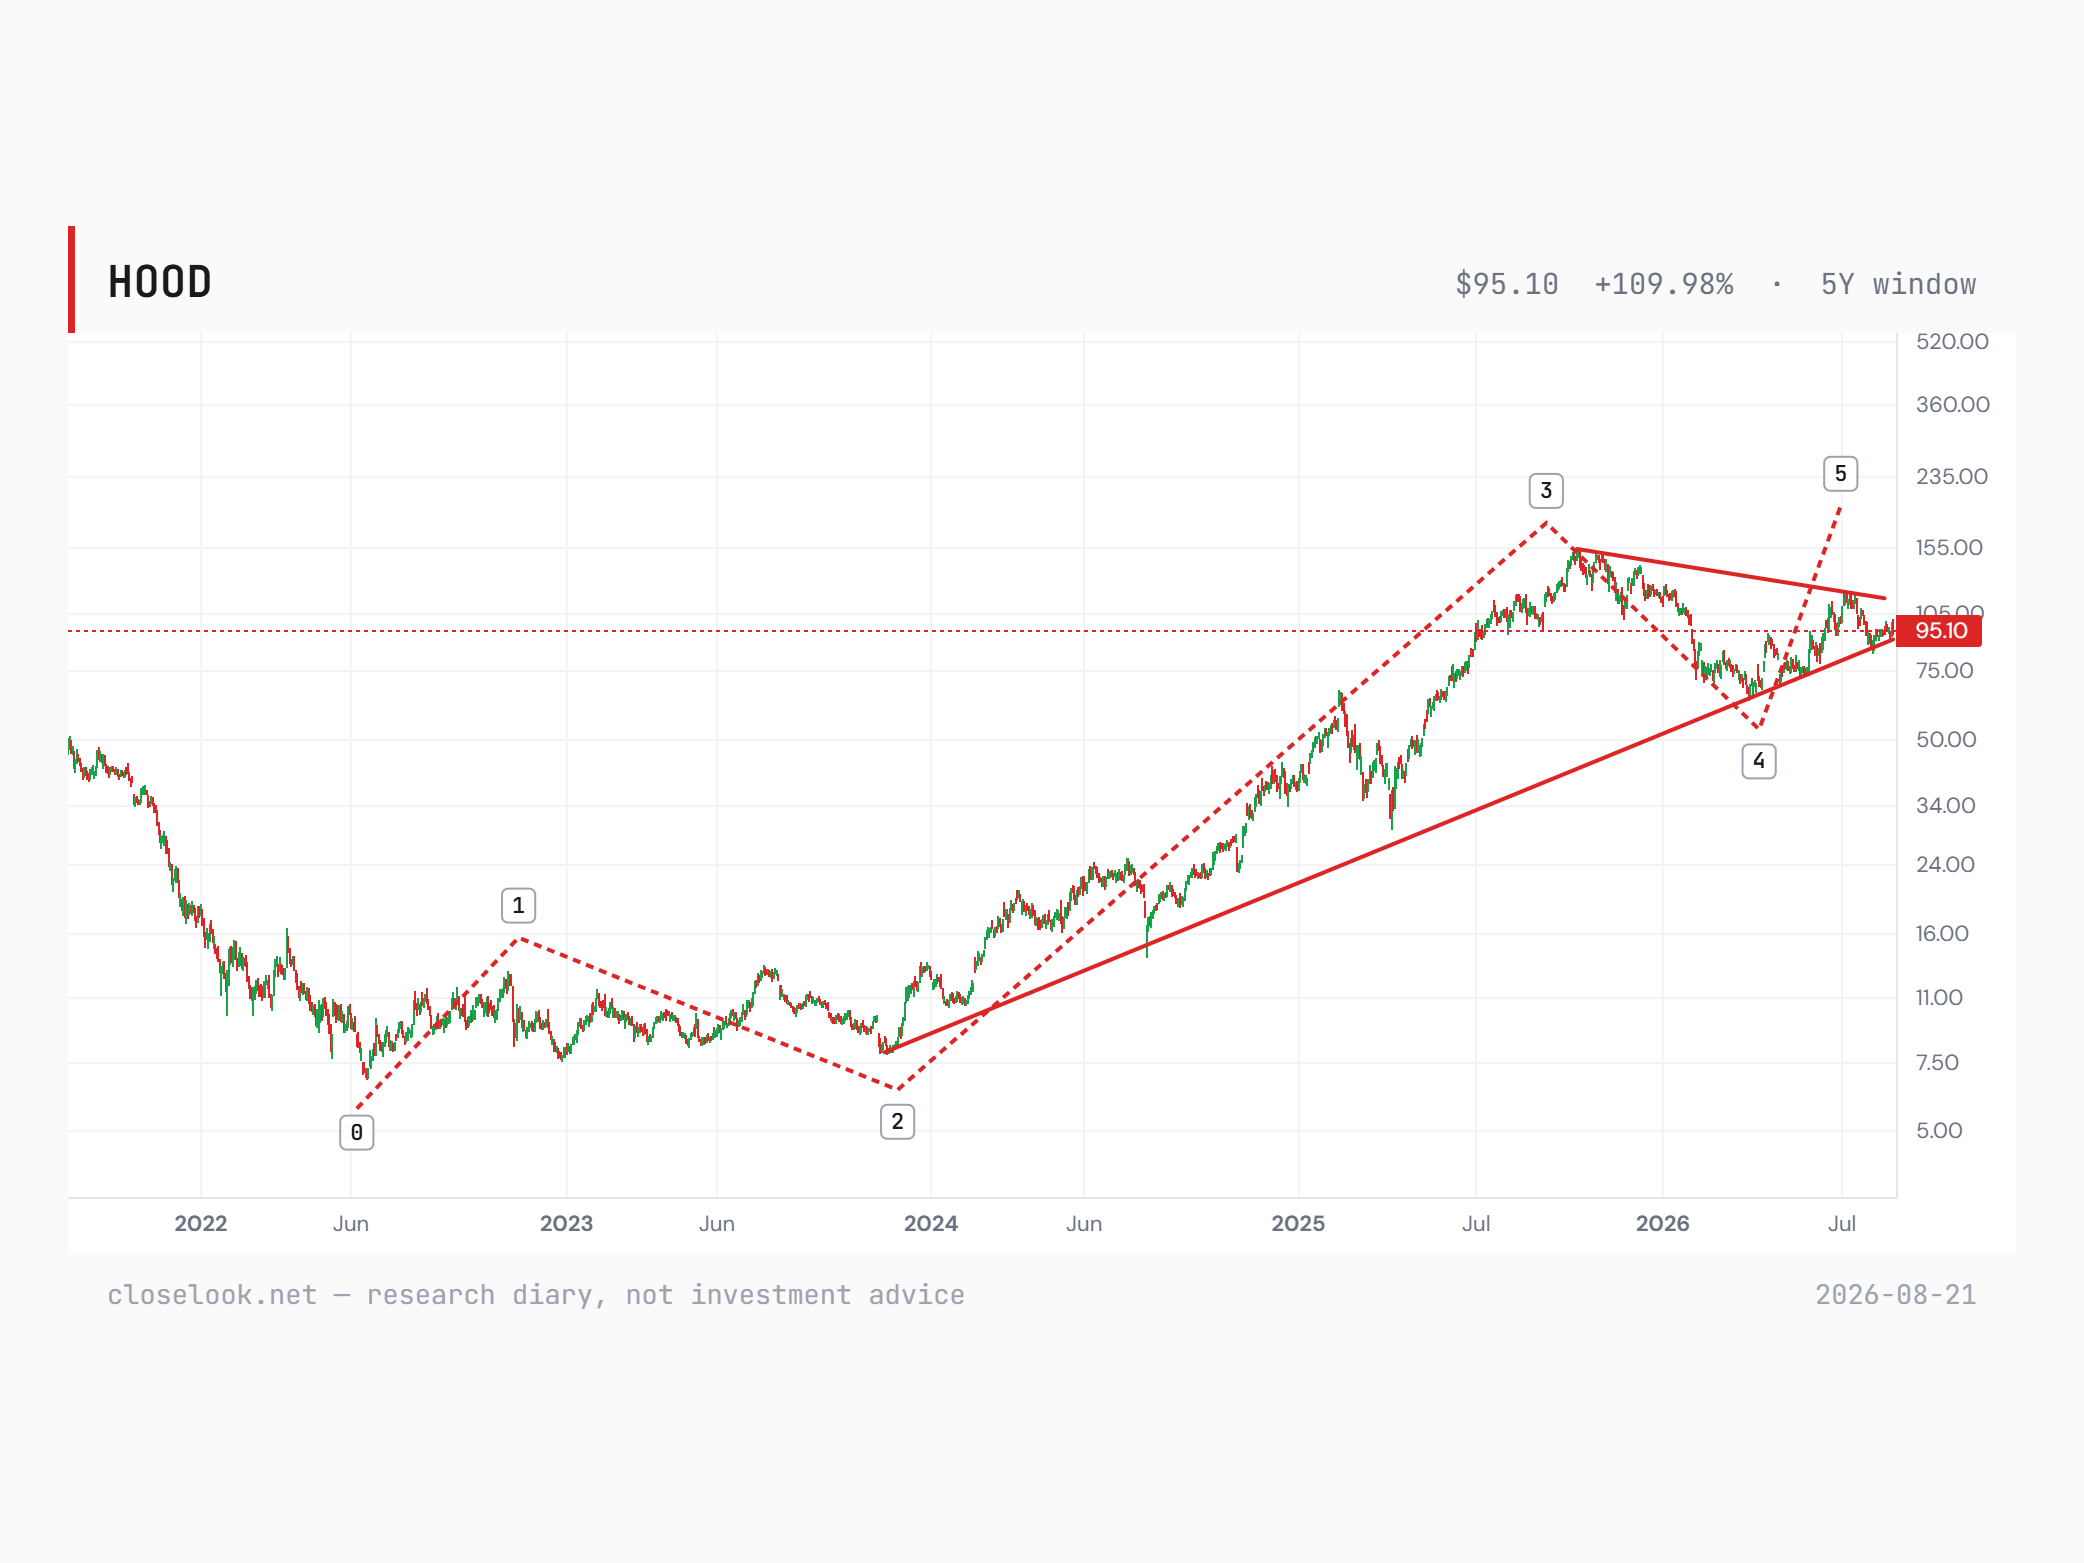
The last quarter was a record — revenue $1.31 billion, up 32% year over year — printed while the crypto engine ran in reverse, that line down 38%. This week bitcoin ran through 75,000, the ten-asset index fund broke a year-long falling wedge and the spot vehicle confirmed its channel break; the listed crypto equities ran with it and this broker closed lower, the laggard of its own complex. The chart reads a five-wave advance from 2022 with wave 5 unfolding, and price sits on the multi-year uptrend line inside a twelve-month triangle that has to break one way or the other.
- The count from the mid-2022 low reads 0-1-2-3-4 complete with wave 5 unfolding: 3 at the October-2025 high of 152.46, 4 at the 30 March low of 65.16, and price now sitting on a multi-year uptrend line that has held under both corrective lows since 2023.
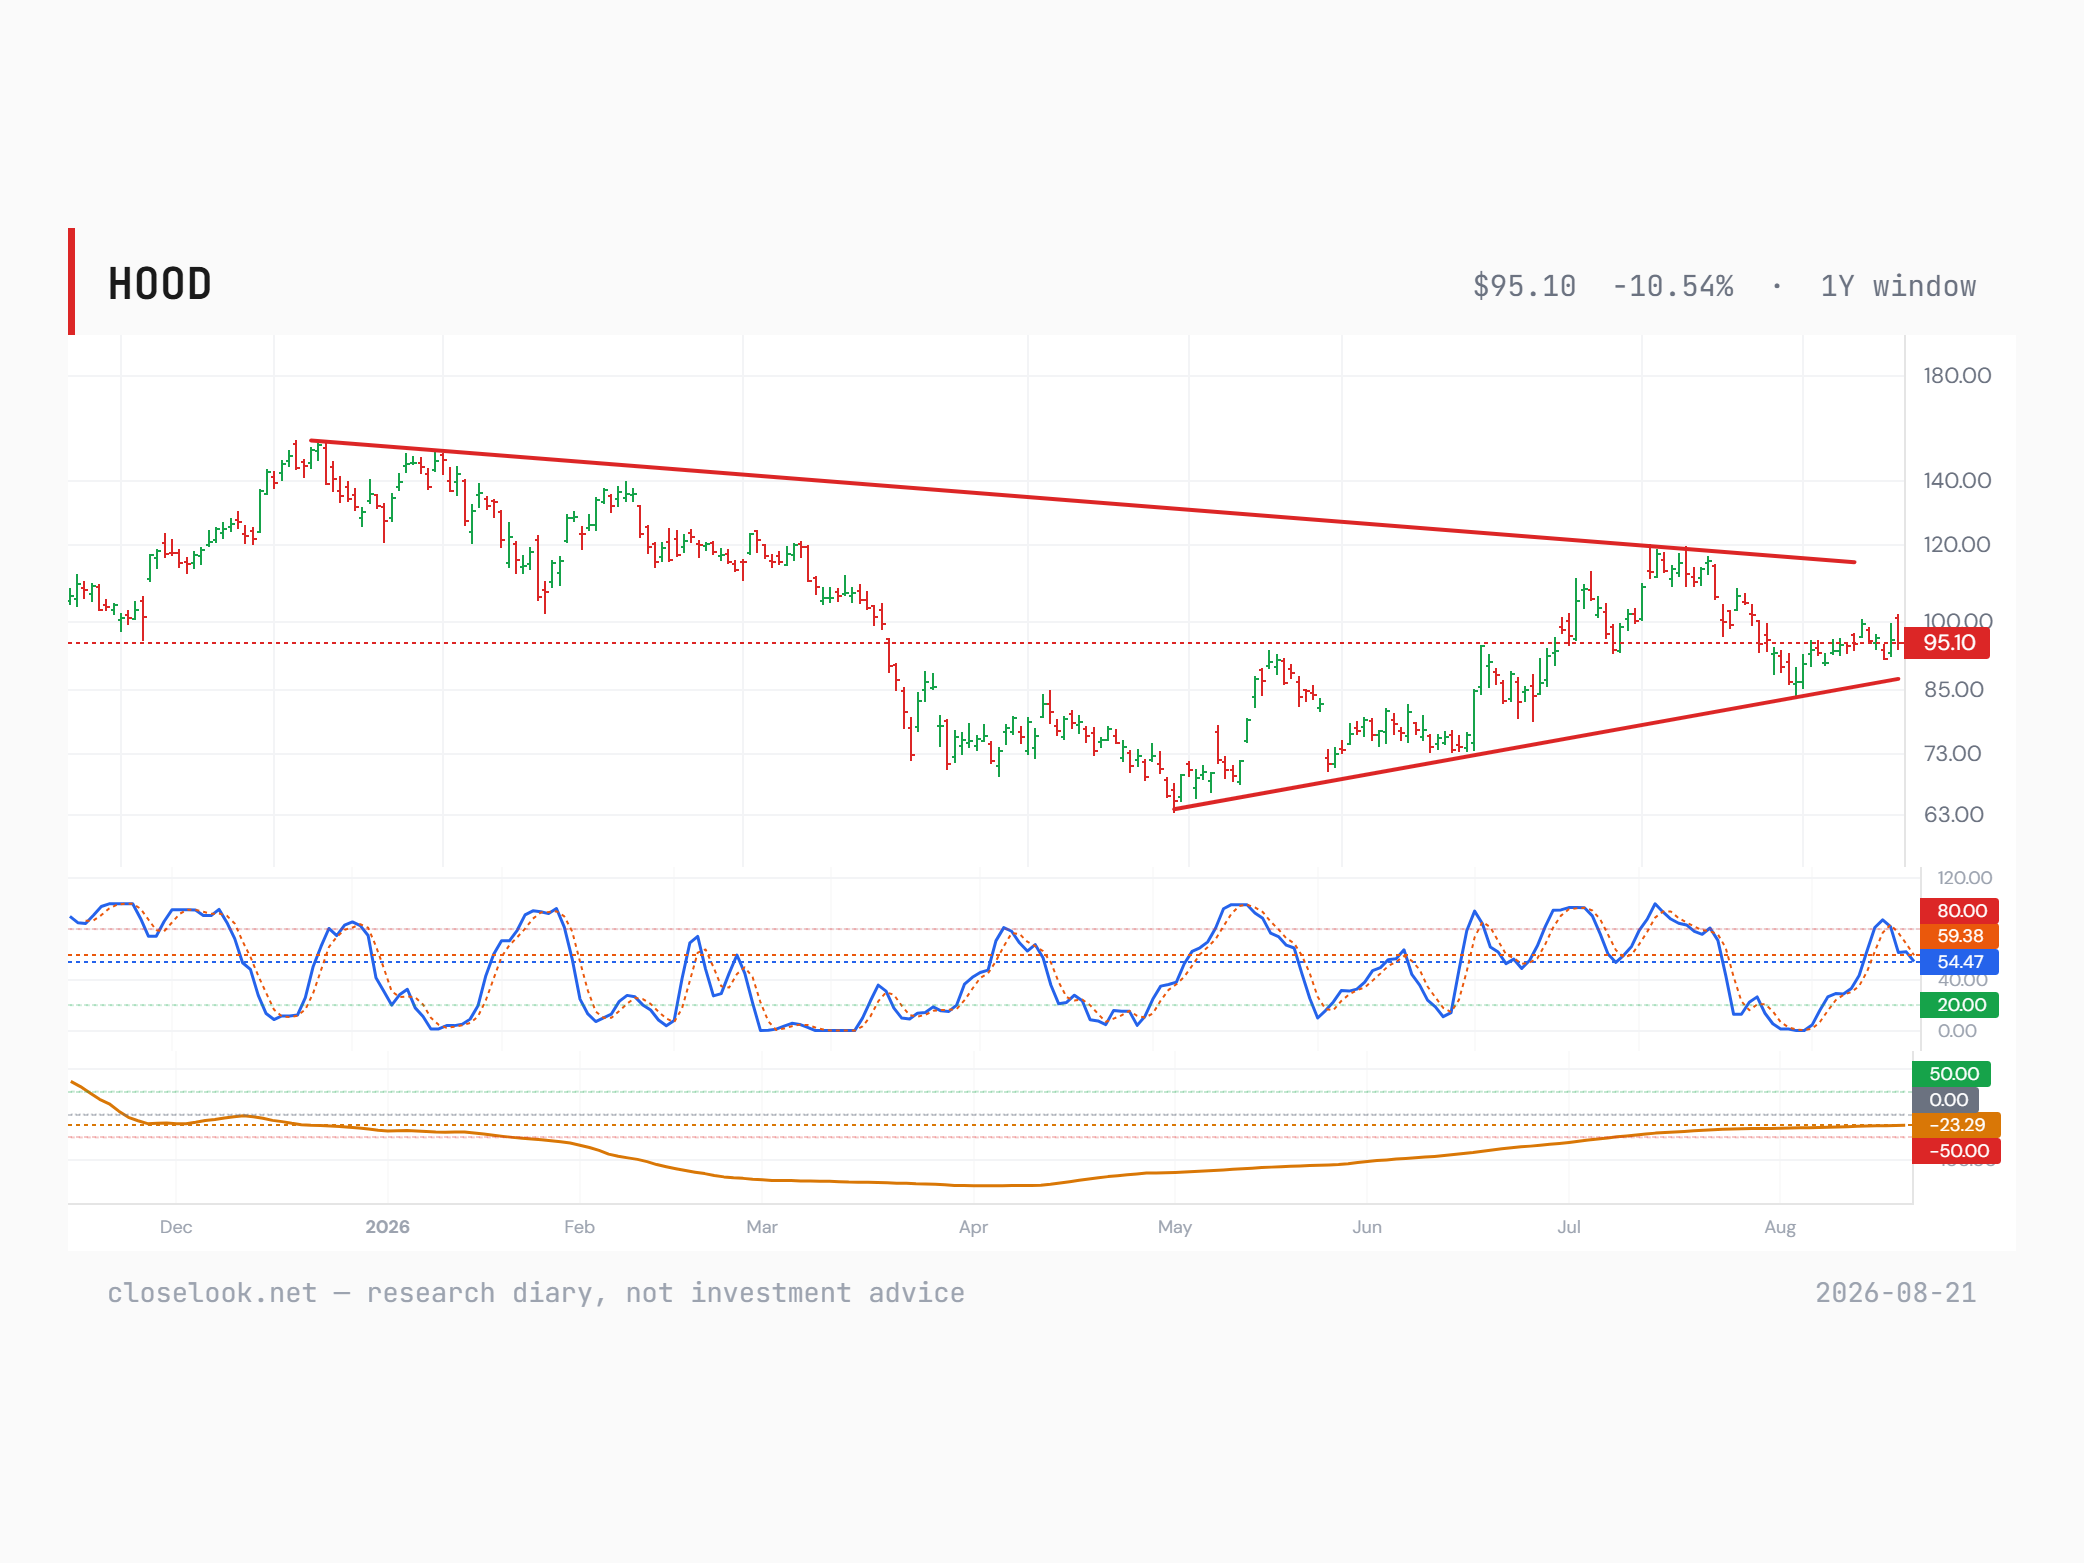
- That wave-4 family is still coiling — a year-long symmetrical triangle, falling boundary near 115, rising floor near 87, price mid-structure at 95.10. The compression is direction-neutral and we say so: a daily close under the floor puts the count on probation, and below 65.16 it is dead.
- The last quarter was the record: EPS $0.62 against roughly $0.43 consensus, revenue $1.31 billion, up 32% year over year — with prediction and event contracts up roughly tenfold to $156 million while crypto trading revenue fell 38% to $100 million.
- That is the mechanism — and the engine's own reading agrees on the timing: our Directional Flow, run by hand for this name, has climbed from −71 in May to −24 now, the reversing-up quadrant. The fast side shows the swift improvement; the level says the repair is not finished.
- The calendar is dense and dated: international crypto rails went live 10 August, a $200 million retail venture fund priced mid-month, the CEO pushed regulators on tokenised stocks on 19 August, a two-day product event lands 29–30 September and the next print is 4 November. Two of those sit inside the scoring window.
- Scored publicly from today at 1w / 1m / 3m / 6m / 12m — the record, not the single call, is the product.
HOOD Robinhood Markets last close 95.1 (2026-08-20)
The Setup
The crypto complex broke its year-long downtrend this week at every level except one. Bitcoin ran through 75,000 overnight — a high of 75,740, roughly +20% on the week, on pace for its biggest weekly gain since March 2024 if it holds. BITW, the ten-asset crypto index fund, closed Thursday at 47.35, +6.91% on the day and +17.0% on the week, breaking a falling wedge that had contained it for a year; IBIT confirmed its own channel break at 41.20, +6.24%, after roughly $517 million of spot-ETF inflows on Wednesday.
On that exact confirmation day the listed crypto equities moved with the asset. Coinbase closed +7.58% at 172.35 and MicroStrategy +7.81% at 112.39. Robinhood closed −0.70% at 95.10 — the laggard of its own complex, on the day the structure it belongs to broke.
The reason we read that gap as a lag rather than a verdict is the shape of the exposure. Coinbase and MicroStrategy carry crypto through holdings and balance sheet, and a structural break in the asset re-rates a balance sheet the same session it happens. Robinhood's crypto exposure is transactional — trading volumes and the revenue that follows them — and volumes arrive after the break, not with it.
What makes this more than a timing argument is what the last quarter already proved. The June quarter was a record — $1.31 billion of revenue, up 32% year over year — and it was printed with crypto trading revenue at $100 million, down 38% year over year. The company did well while its crypto engine ran in reverse. If and when the crypto headwind fades, acceleration in profits is due, and the complex chose this week to break out while the stock still trades as the laggard.
The immediate event fits the same mechanism: more than $3 billion of crypto shorts were liquidated in the overnight move, roughly $1.7 billion of it in bitcoin itself. Liquidation cascades of that size are not background noise for a retail brokerage; they are the revenue line, and the kernel of this pick is exactly that — the name may show a swift improvement given bitcoin.
There is a policy layer underneath it as circumstantial support. At an August 19 White House meeting the president hosted executives from Coinbase, Ripple, Robinhood, Kraken and Intercontinental Exchange, and called on Congress to pass a "fair version" of the CLARITY Act, the digital-asset market-structure bill. We treat that as context, not as a catalyst with a date.
What the market does have is a calendar, and it is unusually dense. UK crypto trading went live on 10 August, through Bitstamp UK — international rails standing up in the same fortnight the asset broke out. Robinhood Ventures Fund II priced and launched mid-August: a $200 million closed-end venture fund at $25 a share, distribution backed by Goldman Sachs and JPMorgan. On 19 August — the same day as the White House meeting — the CEO publicly called on US regulators to approve tokenised stocks domestically, describing a global tokenisation supercycle with record on-chain equity volumes. Two policy touchpoints in one day.
Ahead of it sit two more dates: the company's two-day product event on 29–30 September, and the 4 November print. That is a calendar the market has to price while the chart is still coiling, and it is the reason we are willing to publish this pick before the triangle resolves rather than after.
In the Closelooknet readings
No index membership on this one, and we say so plainly: Robinhood is not a constituent of Rubin, HALO, Euro-AI, the Agentic Ecosystem or Agentic Winners, and it sits outside the scanner universes — so for this edition we ran the Directional Flow engine's own math by hand on the lake series. The reading: −23.6 on the raw scale, up from −71.4 in May — a delta of +47.8 over three months and +15.0 over one — the engine's reversing-up quadrant: the fast side improving swiftly while the level itself is still below zero. This pick is the hand chart, the structure of the complex around it, the fundamentals — and that hand-run engine read; the machine layer grades the outcome either way.
52-week range (closes): 65.16 – 152.46
The latest print
The second quarter printed on 29 July 2026 and it is the reason this pick exists. EPS came in at $0.62 against roughly $0.43 consensus — a beat of more than 40% — on record revenue of $1.31 billion, up 32% year over year from $989 million in the same quarter of 2025.
The split is the story. Prediction and event contracts grew roughly tenfold to $156 million. Options contributed $342 million and equities trading $129 million. Crypto trading revenue was $100 million — down 38% year over year, in the middle of the digital-asset slump.
Read that combination plainly: the record quarter was printed with the crypto engine running backwards. The segment most people price this company on subtracted from the result and the result was still a record, which means the rest of the business carried it. If and when the crypto headwind fades, acceleration in profits is due — and the complex broke out this week.
The first quarter, printed 28 April 2026, shows the same relationship from the other side. Revenue came in at $1.067 billion against $1.14 billion expected — a miss — with EPS $0.38 against $0.39, and the 52-week low at 65.16 printed on 30 March, weeks before that report landed.
The next print is 4 November 2026, with consensus at $0.47 EPS on $1.348 billion of revenue. It is the first quarter that would carry any of this week's breakout, and it falls inside the three-month scoring window for this pick.
The fundamentals
The other half of the case is that this is no longer a trading app. The business has been bundling the personal finance stack into one account — a financial super-app — and the fronts it is opening each point at a different incumbent.
Credit and banking. A flat 3% cash-back card sits against the mainstream 1.5–2% standard, a premium travel card sits against the established elite cards, and uninvested cash earns an elevated yield. That set of products is aimed at retail banks and card issuers, not at brokers.
Trading. Beyond equities and options there are now prediction and event contracts — the segment that grew roughly tenfold to $156 million in the June quarter — plus a desktop platform carrying index options, futures and short selling, IPO access, and an advisor integration. This front is aimed at the discount brokerages and, increasingly, at the exchanges themselves.
Tokenization and Web3. A native chain, tokenized real-world assets, and agentic AI-driven trading. More than 190 US stocks are tokenized on that chain, available in over 120 countries, trading around the clock, backed 1:1 and usable as collateral in DeFi lending. On 19 August the CEO called on US regulators to approve tokenized stocks domestically. This front is aimed at the crypto exchanges and, further out, at the market infrastructure itself; it has the least revenue history behind it and we treat it as optionality, not as a line item. UK crypto trading going live on 10 August, through Bitstamp UK, is the same expansion in its plainer form.
Retirement. A 3% IRA match where the incumbents offer none, aimed squarely at the wealth managers and the large retirement platforms.
Private markets. Robinhood Ventures Fund II priced and launched in mid-August: a $200 million closed-end venture fund at $25 a share, giving retail investors exposure to early and growth-stage startups backed by Y Combinator, with distribution backed by Goldman Sachs and JPMorgan. That is a fifth incumbent — the private-equity and venture gatekeepers — and the first of these fronts where the distribution partners are the institutions being disintermediated.
What makes this section relevant to a chart pick rather than a company profile is the sequencing. These fronts are usually described as a roadmap; in the June quarter, one of them stopped being a roadmap. Prediction contracts showed up in the revenue mix at $156 million, and they did it in the same quarter crypto revenue fell 38%. That is what a diversifying revenue base looks like before the market has finished repricing it. The two-day product event on 29–30 September — a chief-executive keynote on active-trader tools, the social-trading feature leaving beta, a wider AI-assistant rollout — is where the next set of these fronts gets shown, and it lands inside this pick's scoring window.
The chart, read by hand
Trend: Two readings, and they have to be held together. The long-term uptrend is intact: a multi-year line drawn from the 2023 base runs under both corrective lows and price is sitting on it right now. Inside that, we see a triangle — a compressing price range that should lead to a bigger move, either up or down, soon. The falling boundary runs from the 52-week closing high of 152.46 set on 6 October 2025 — the same week the whole crypto complex topped — and converges with a rising line off the spring low of 65.16 close, 63.5 intraday, set on 30 March 2026. Price at 95.10 sits mid-structure, roughly 87 below and roughly 115 above. The structure itself is direction-neutral; the count and the catalyst lean up.
Oscillators: The stochastic sits mid-range near 59/54, falling back from an early-August tag of 80 — neither pinned overbought nor washed out, which is what a triangle's interior usually looks like. The long momentum line in the lower pane is our Directional Flow oscillator: it spent the winter deep below zero and has climbed back to roughly −23. Run by hand through the engine's full math the reading is −23.6 with a three-month delta of +47.8 — the reversing-up quadrant, a year-long momentum base repairing swiftly on the fast side but still under the zero line. Nothing in either panel resolves the triangle's direction; both are consistent with a break either way.
Elliott Wave count: 0 at the mid-2022 low (~6.8) → wave 1 into late 2022 (~15) → wave 2 at the late-2023 low (~7.5) → wave 3 at the October-2025 high (152.46, 6 October 2025) → wave 4 at the spring-2026 low (65.16, 30 March 2026) → wave 5 unfolding, projected up out of the triangle that the wave-4 family is still coiling in. The count goes on probation on a daily close under the triangle floor near 87 and is invalidated outright below the wave-4 low at 65.16. We mark the count, not a target.
Key levels: ~115 and falling — the year-long descending line; a daily close above it resolves the triangle upward · 100 — the round-number shelf that capped August · ~87 and rising — the triangle floor; losing it resolves the structure down, puts the count on probation and falsifies the pick · 63.5–65 — the spring low that anchors the rising line and the wave-4 low; below it the count is finished
What the machines say
Technical snapshot (as of 2026-08-20) — vs 20d +2.0% · vs 50d -4.8% · vs 200d -1.2% · off 52w-high -38.2% · stochastic K 59.9 / D 63.2
Directional Flow — engine math, run by hand for this edition (computed 2026-08-21) — directional-flow -24, neutral, reversing up (5d +4.0%, 21d +15.0%, 63d +47.8%)
Machine blocks render only where our engines actually cover the name — nothing is padded.
The risks, equal billing
The triangle can resolve down. This is the honest centre of the risk section: a symmetrical triangle is direction-neutral, and the compression says a bigger move is coming without saying which way. A daily close under the rising floor near 87 falsifies this pick outright and puts the wave-5 read on probation; a break of the wave-4 low at 65.16 ends the count. Publishing before the structure resolves is a deliberate choice — the point of the format is to be on the record before the answer is known — but it is a choice with a cost, and this is where the cost sits.
The thesis leans on bitcoin's break being real. Our own Pulse names the falsifiers: IBIT slipping back inside its old channel would undo the confirmation this pick is built on, and USDJPY through 159.69 — one tripwire at 158.5 is already live — would pressure the entire hard-asset tape, this name included.
The laggard can simply stay a laggard. Thursday was one session. If the complex keeps running and this name still does not respond, the volumes-to-revenue mechanism is being repriced somewhere else — competition, fee compression, or a market that has decided transactional crypto exposure is worth less than it used to be. Persistent non-participation is evidence against the thesis, not a deeper discount.
The diversification cuts both ways. The June quarter was carried by options, equities and prediction contracts while crypto fell 38%, which is the strength of the case — but a tenfold jump in one young segment is a hard base to grow from, and event contracts sit in the part of the market where the rules are least settled. What diversifies the revenue also widens the surface for regulation.
A scheduled catalyst is also a scheduled disappointment. The product event on 29–30 September sits inside the one-to-three-month scoring window, and we are counting it as a reason the market has something to price. It cuts both ways with equal force: a keynote and a feature launch that land flat give the tape a dated excuse to sell, and product events have a habit of being bought into and sold on the day. The same is true of the 19 August regulatory push — a call on regulators is not a decision by regulators.
The 4 November print lands inside the three-month window. Consensus is $0.47 on $1.348 billion. The first quarter of 2026 already showed what a weak crypto tape does to this revenue line, and a print that misses cuts through the acceleration argument directly.
Policy is the softest leg. The CLARITY Act push can stall in Congress like every market-structure bill before it, and a White House meeting is circumstantial evidence, not a passed law. We include it as context and we do not lean on it.
Our forecasts
12 months from now: Higher, in our view — driven by the bitcoin recovery feeding the transactional engine, the ongoing disruption of the financial industry across the fronts above, and continued market-share gains.
5 years from now: This could be one of the ten biggest and most important financial institutions — meaningfully higher, in our view. The super-app bundling, the tokenization rails and the retirement and private-markets fronts are the path; execution and regulation are the gates.
Diary views, not advice — held publicly alongside the scored record.
Why publish this name? Because our Directional Flow readings are what let us say it: stocks with this or a similar setup have often — historically — done well over the following twelve months. That is the engine's backtested observation about the past, not a forecast; past performance may not be an indication of future performance. Which is exactly why every pick is scored publicly against the tape from today, at one week, one month, three, six and twelve. First checkpoint, one week (28 August close): +9.6% — 104.26 against the 95.10 reference close. The mark stood +15.4% at Thursday’s close before Friday’s −5.0% session, a prices-first Fed day that sold risk broadly, trimmed it. Next checkpoint: one month.
Closelooknet publishes an investment research diary, not investment advice. Every pick is scored publicly against the tape at 1w/1m/3m/6m/12m from publication — the record, not the single call, is the product.
Open the live HOOD terminal → All picks & the running record →
A note from the editor: the Weekly Chart Pick is free. Its price is one click — add Closelooknet as a preferred source on Google, and you support this work in Google Discover and Search every time you read.
Google opened in a new tab. Add Closelooknet there, then come back to this tab — the Chart Pick unlocks the moment you return.
The preferred-source setting lives in your Google account — if Google asks you to sign in first, you will land on the selection page right after. Google does not tell us whether you saved the selection. Clicking “Done” unlocks the Weekly Chart Pick on this device for 12 months.