Daily Pulse · · 17:25 CET · 7 min read · market

Pattern alerts
- SPY up-for-the-year-on-10-nov-rose-into-year-end-in-47-of-55-years BULLISH
- SOXX chip-index-20-percent-under-its-high-on-10-nov-rose-in-2-of-9-years WARNING
- QQQ nasdaq-100-10-percent-under-its-high-on-10-nov-rose-in-3-of-9-years WARNING
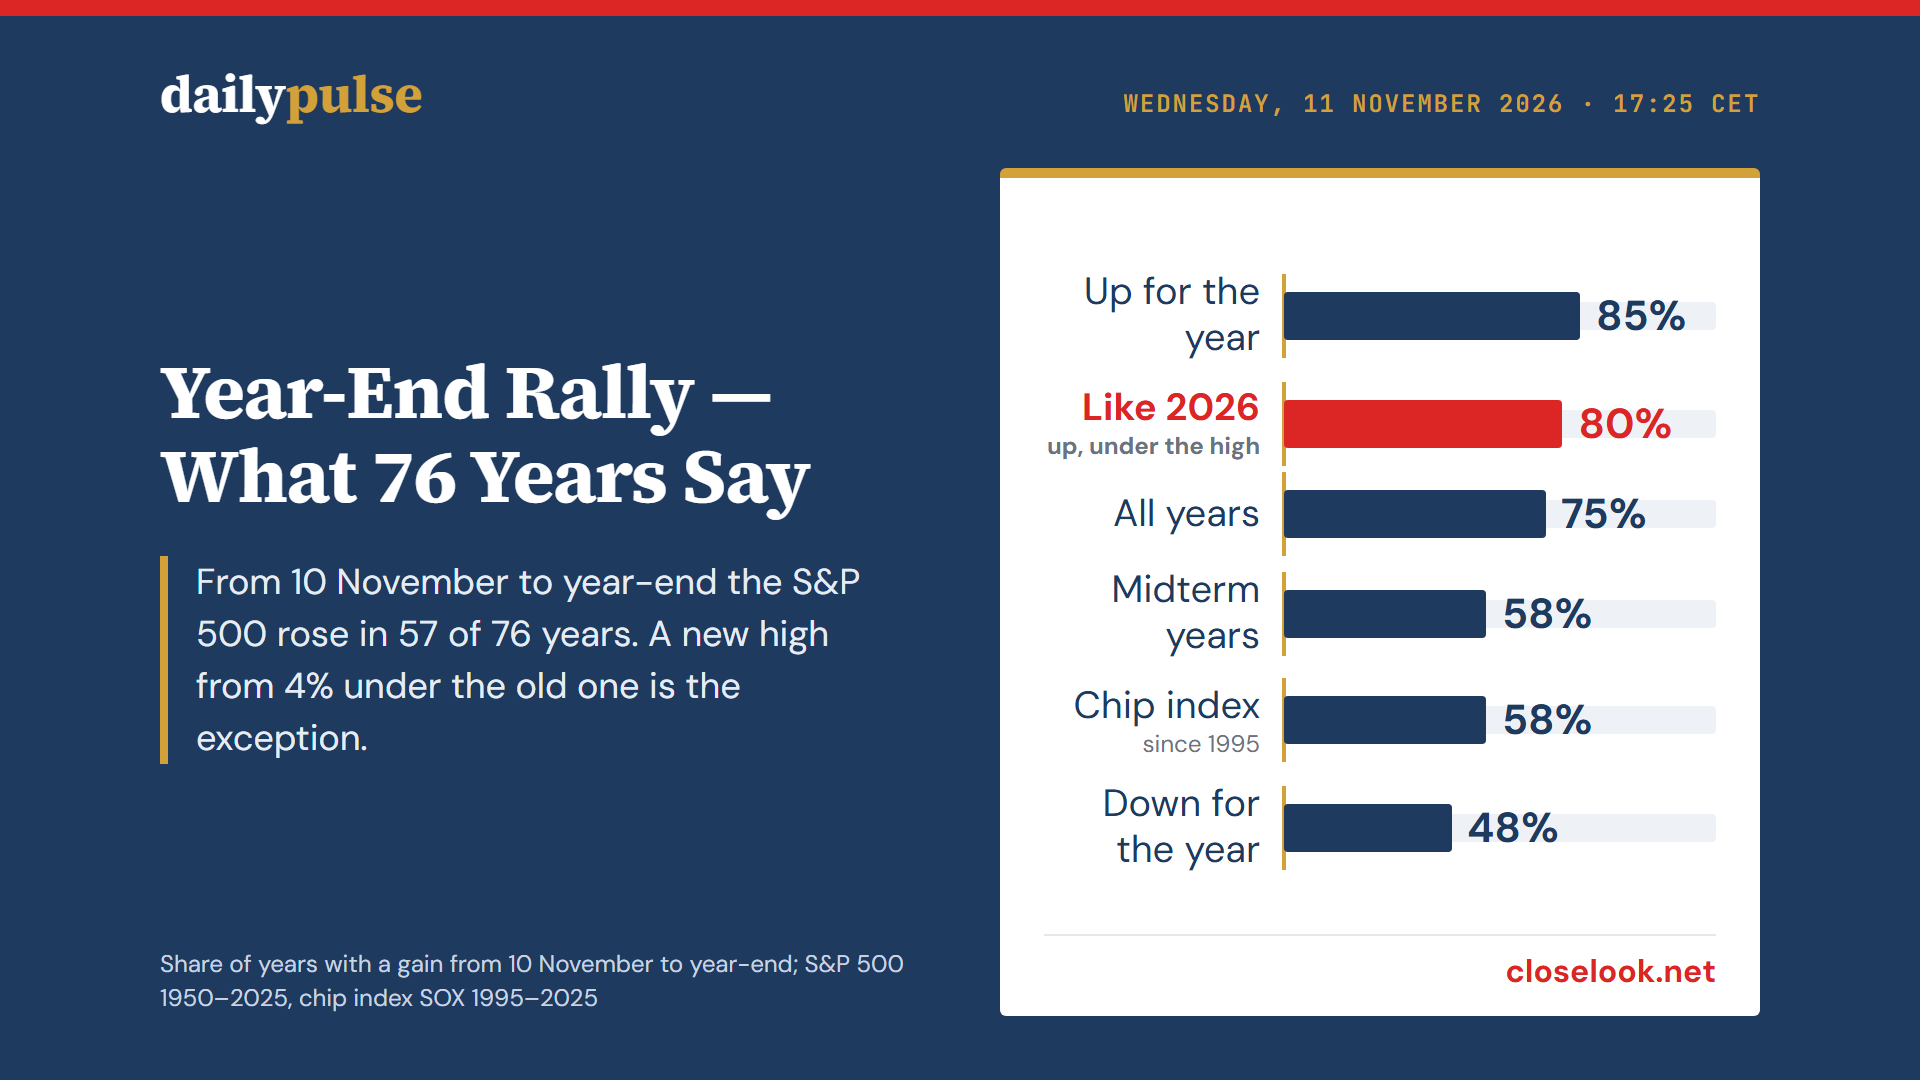
Chip stocks are rising again, and the S&P 500 stands 9.9% higher for the year with seven weeks to go. Is this the start of a year-end rally? We went back to 1950 and measured every stretch from 10 November to the last trading day of December. The S&P 500 rose in 57 of 76 years, by 2.2% on average. That is the comfortable part. The less comfortable parts: midterm election years are the weakest group, a rally that reaches a new high from where the index stands now is the exception, and the one year that resembles 2026 most closely, 2018, was the worst of all.
The record since 1950
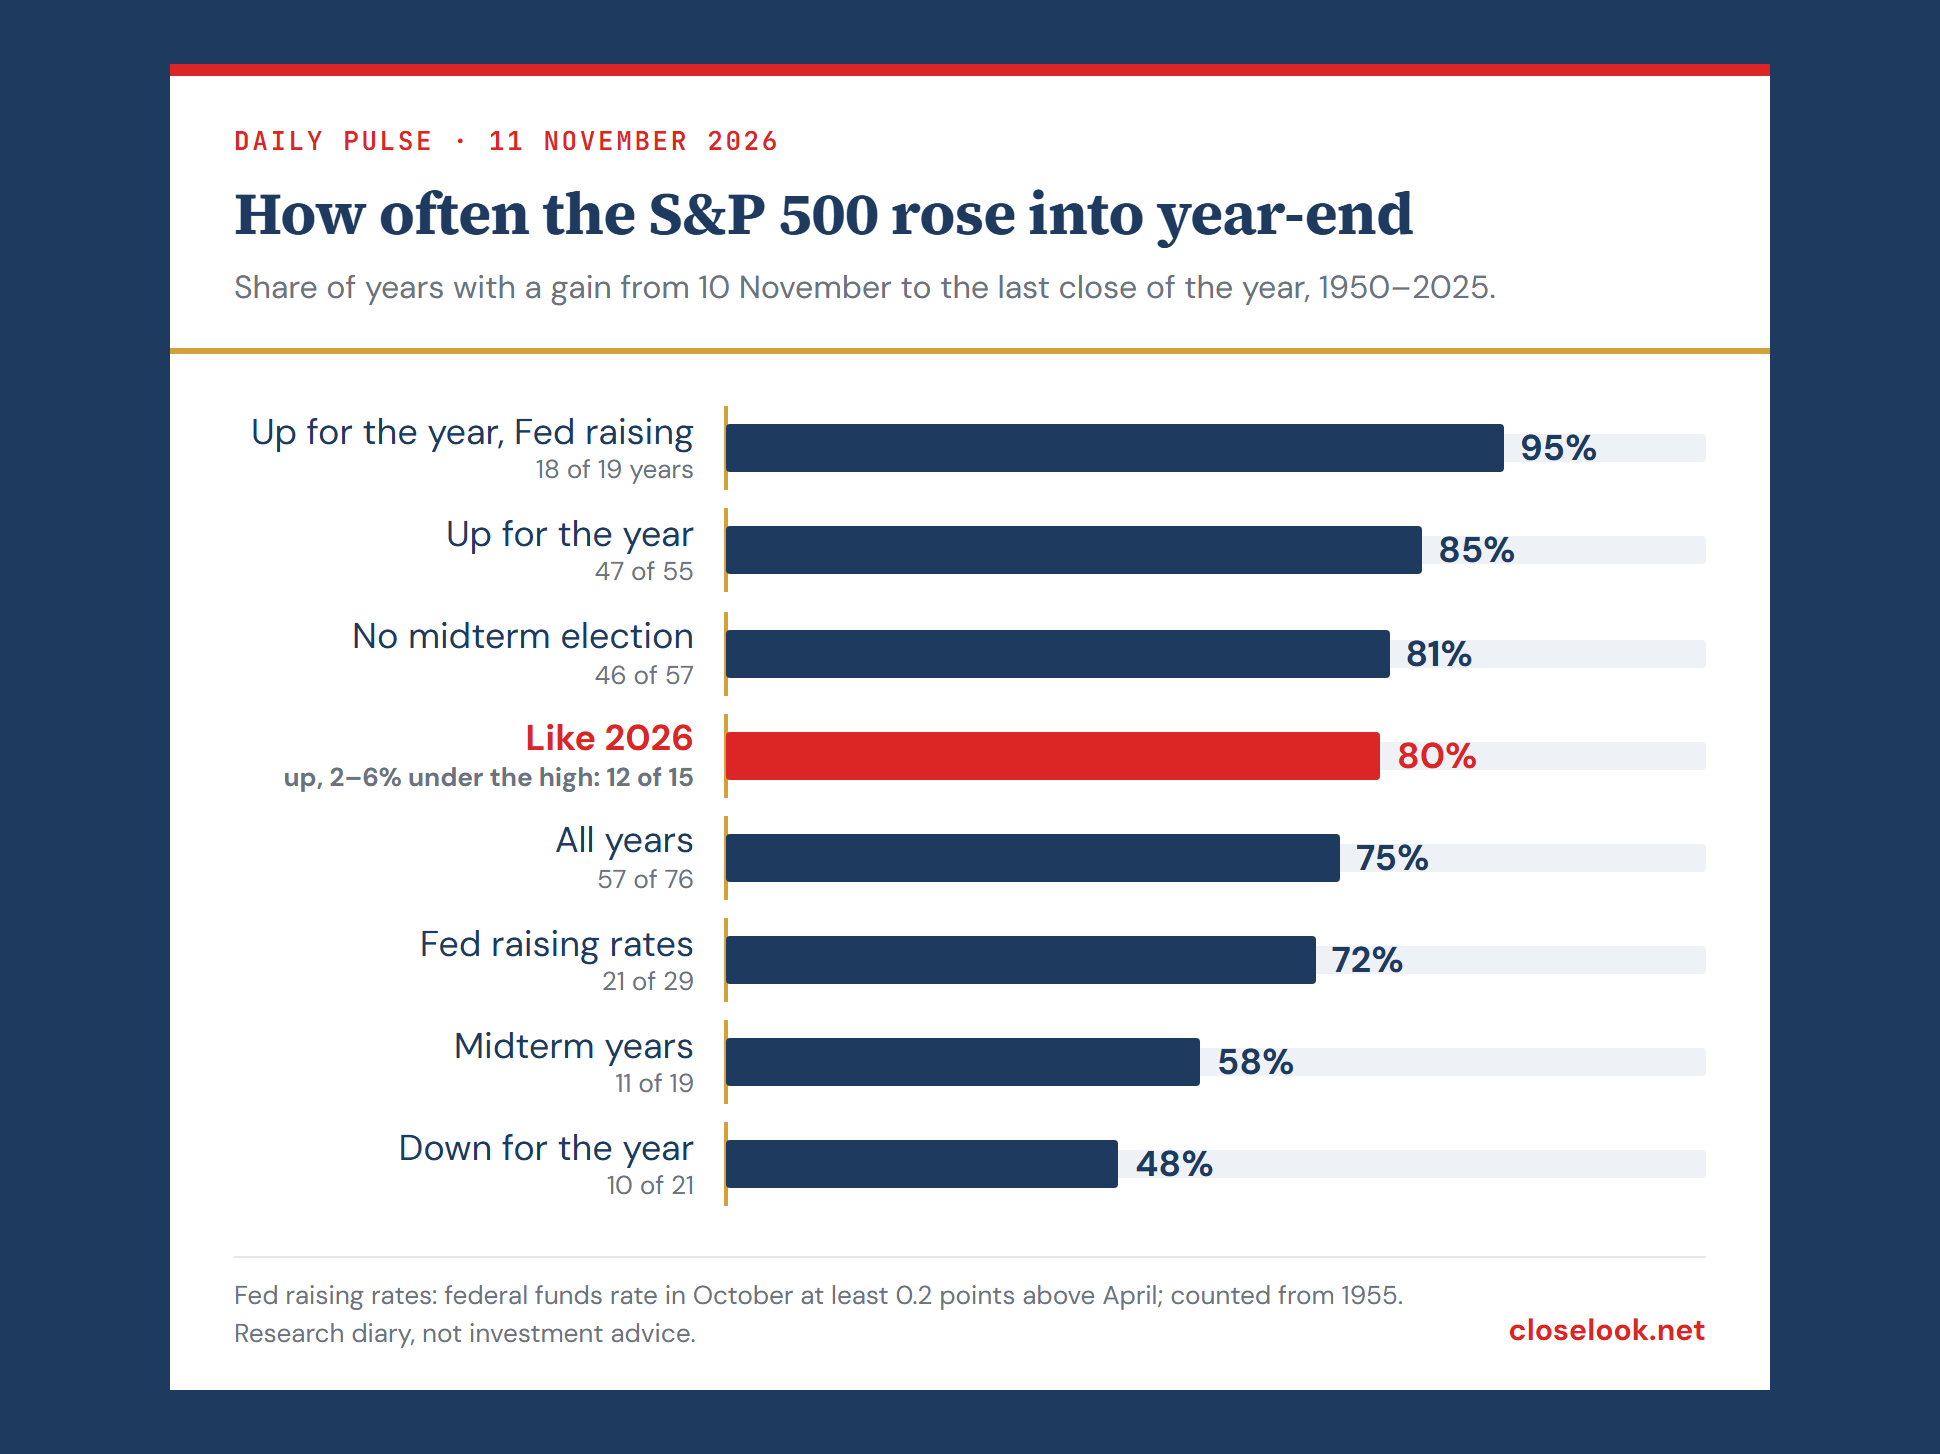
For each year we take the last close on or before 10 November and compare it with the last close of the year. This year the starting point is Tuesday's close of 7,520.93. The table sorts the 76 years by what was true on the starting day.
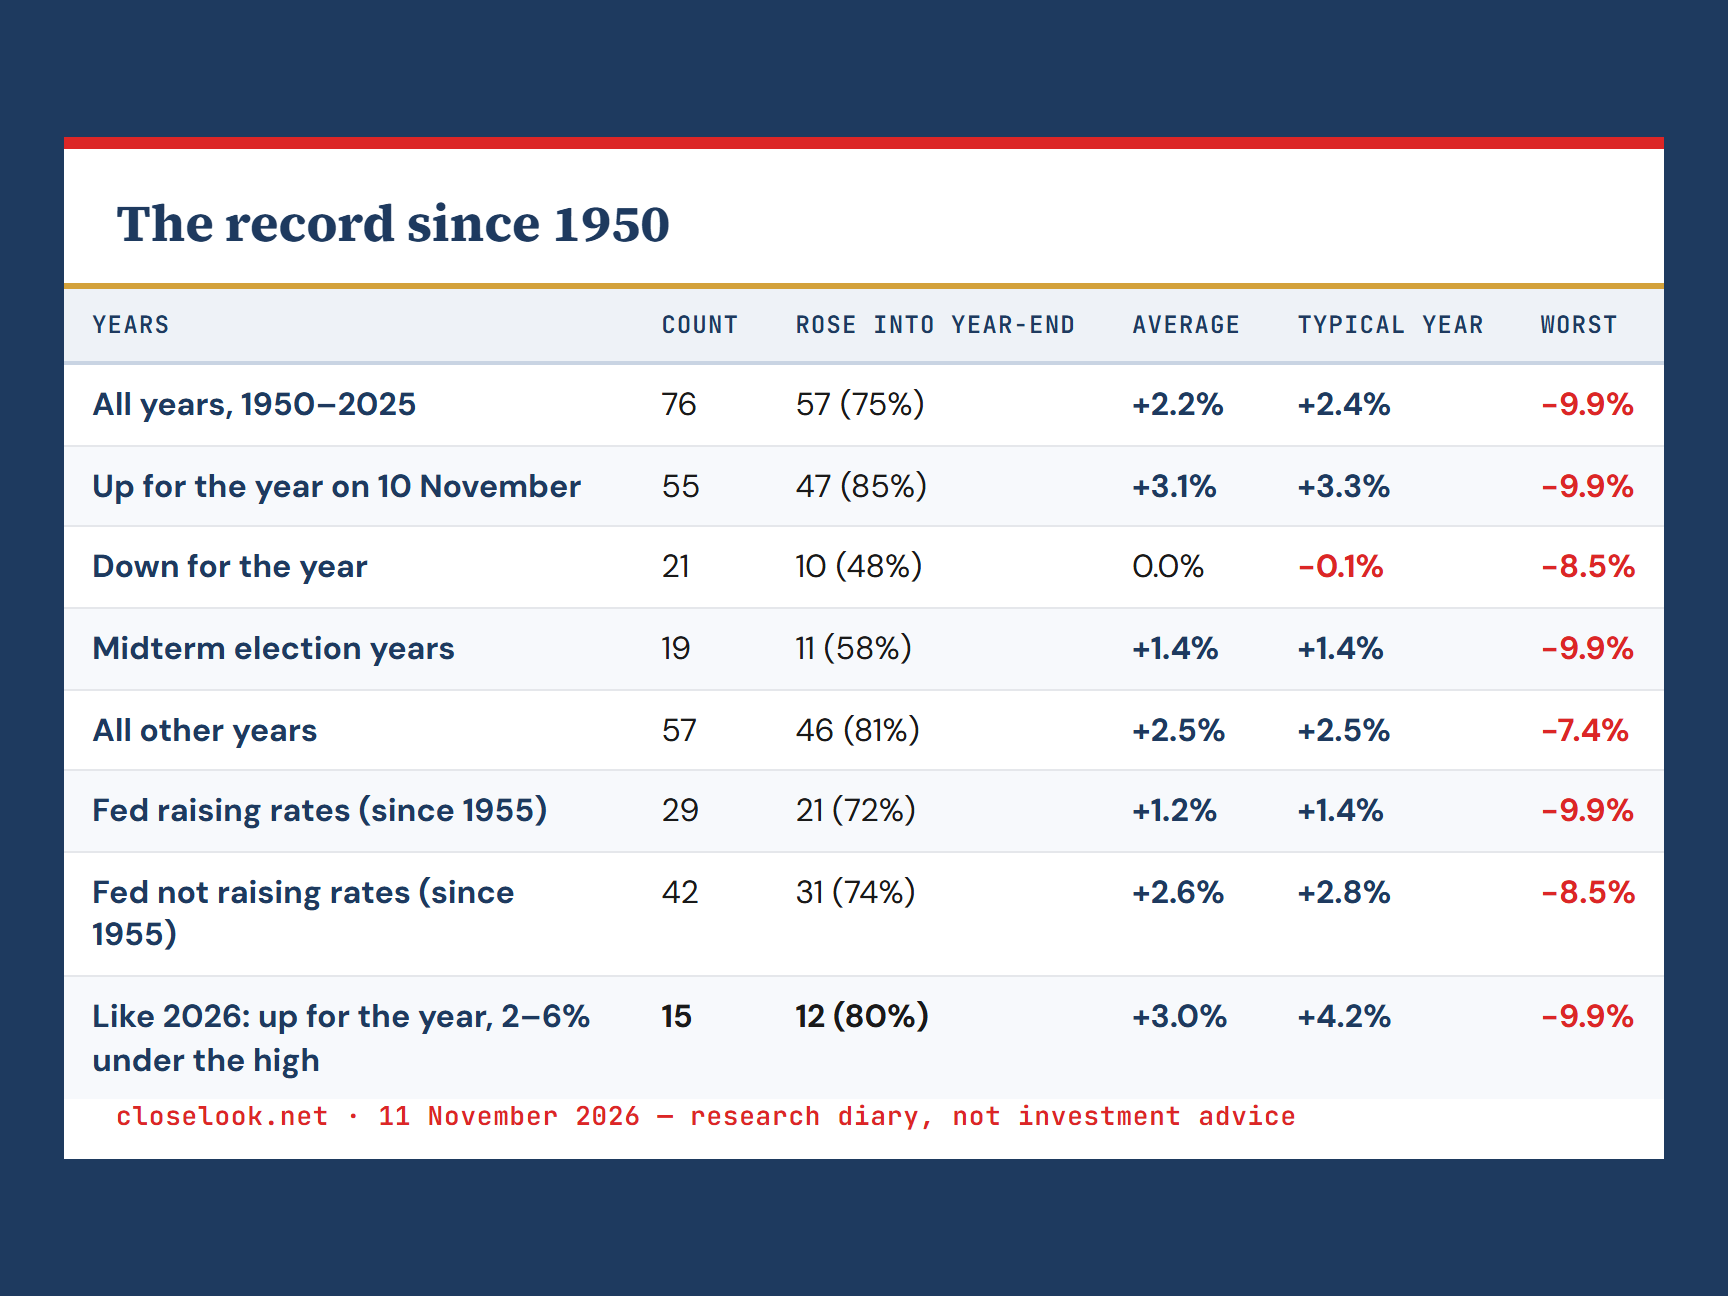
Table as text
| Years | Count | Rose into year-end | Average | Typical year | Worst |
|---|---|---|---|---|---|
| All years, 1950–2025 | 76 | 57 (75%) | +2.2% | +2.4% | −9.9% |
| Up for the year on 10 November | 55 | 47 (85%) | +3.1% | +3.3% | −9.9% |
| Down for the year | 21 | 10 (48%) | 0.0% | −0.1% | −8.5% |
| Midterm election years | 19 | 11 (58%) | +1.4% | +1.4% | −9.9% |
| All other years | 57 | 46 (81%) | +2.5% | +2.5% | −7.4% |
| Fed raising rates (since 1955) | 29 | 21 (72%) | +1.2% | +1.4% | −9.9% |
| Fed not raising rates (since 1955) | 42 | 31 (74%) | +2.6% | +2.8% | −8.5% |
| Like 2026: up for the year, 2–6% under the high | 15 | 12 (80%) | +3.0% | +4.2% | −9.9% |
The typical year is the middle one when the years of a group are sorted by their result. The worst result in the record, −9.9%, is 2018; the best, +9.3%, is 1971.
The strongest signal is the simplest one. When the index was up for the year on 10 November, it rose into year-end in 47 of 55 years, by 3.1% on average. When it was down for the year, it rose in 10 of 21, and the average is zero. Year-end strength mostly continues what the year had already done.
The S&P 500 was 9.9% higher for the year on Tuesday, so 2026 sits in the favourable group. The path is rarely smooth, though. In 24 of the 76 years the index stood more than 3% under its 10 November close at some point before the year ended. In a typical year the deepest dip was 1.9%.
C — free account
The free C account unlocks the full Daily Pulse — every section of this read.
One tap with Google or one email — no password, no card. You are signed in until you sign out, on this browser, from then on.
Join the Look — freeAlready joined on this browser? The full edition shows automatically — if it doesn't, sign in again here. Looking for the archive, portfolios and realtime? That is C+.
One more block on our desk — tomorrow's levels and what we're watching into the next session. Join the Look — it’s free.