—

Bitwise 10 Crypto Index ETF (BITW) — chart, structure and Closelooknet read

The Closelooknet read

Detail below: the desk's view, the earnings record, peers and the company snapshot; daily prices on the price-history tab. Research diary readings, not advice.

Pick a ticker to load its detail page.

Charts from the desk on BITW

The charts this diary drew or picked on Bitwise 10 Crypto Index ETF, as published — each dated and linked to the piece that explains it.

Signals for this name

Every Closelooknet reading that exists for BITW, from the same nightly bakes the boards use. Research diary readings, not advice.

Mentioned on Closelooknet 6 pieces · newest: Daily Pulse, “Bitcoin and Gold — The Has-Been Breaks Out, the Darling Rolls Over” (2026-09-21)

Mentioned on Closelooknet

Where BITW appears in the diary — 6 pieces, newest first. Every link is our own writing.

Long reads

Dailies

Weather around the name 3 macro readings: Money Temperature, Factor regime, Sovereign pressure

The weather around this name

Macro readings that apply by membership — the regime, the factor tape, the sector cell, the funding backdrop.

  • Money Temperature Composite 46/100 · S&P 500 fund at 49, above its 200-day averageEight instruments scored on position, momentum, volume, volatility and fragility — the regime every name trades inside. Temperature lab → 2026-10-30
  • Factor regime Defensive rotation — low-vol leading, regime-change watchMomentum against low volatility (SPMO / SPLV): below its 50-day trend, 81th percentile of the window, -13.7% over 20 sessions. Factor regime → 2026-10-29
  • Sovereign pressure Index -1.66 · down 2.24 over 21 sessionsG7 long-end yields, 10s30s and the slope — the funding weather for every balance sheet on this site. Sovereign pressure → 2026-10-30
How it trades on rate days beta 0.24 to TLT · on the worst bond days it fell more than the market

How it trades on rate days

How BITW has moved when long-dated Treasury yields rise — measured against TLT, the 20+ year Treasury fund.

  • Beta to long bonds, 1 year 0.24 — shows only a loose link to bond moves for every 1% move in TLT (20+ year Treasuries), Bitwise 10 Crypto Index ETF moved 0.24% on average · correlation 0.05 · higher than 17% of US names
  • Beta, last 3 months 0.10 about the same as over the year
  • On the 10 worst bond days −2.39% on average against −0.74% for the S&P 500 the 10 sessions of the past year in which TLT fell most, i.e. long yields rose most
  • Latest of those days +0.52% TLT −1.29% that day 2026-09-24

Daily total returns from the adjusted price series; a TLT down day is a day long yields rose. Beta = the average move of the name for a 1% move in TLT. Past sensitivity, not a forecast. An investment diary, not a recommendation.

About Bitwise 10 Crypto Index ETF

Bitwise 10 Crypto Index ETF (BITW) is an exchange-traded fund that trades on US exchanges. Closelooknet tracks it as a benchmark: the dailies and the sector dispersion board quote it as a market reference, and the holdings card above matches its largest positions against the names with a Closelooknet page. It is a constituent of Closelooknet benchmark ETF set.

closelook.net is an investment research diary — market structure, index membership and scores are our own readings, not investment advice. Related: index compare · sector dispersion · scanner.

FAQ · from the current data · as of 2026-10-31

Quick answers

What is Bitwise 10 Crypto Index ETF (BITW)?

Bitwise 10 Crypto Index ETF is an exchange-traded fund trading as BITW on the US exchange (US) and is one of the benchmark ETFs Closelooknet tracks as a market reference, as of the registry build of 2026-10-31.

How does Closelooknet use BITW?

As a benchmark: the daily editions, the sector dispersion board and the index dashboards quote Bitwise 10 Crypto Index ETF as a market reference, and this page matches the fund's largest holdings against the names Closelooknet covers so a reader can move from the fund to the companies inside it.

Where does BITW trade against its moving averages?

Bitwise 10 Crypto Index ETF trades 6.5% below its 50-day and 3.6% above its 200-day moving average (6.9% below its 20-day). As of 2026-10-30 — a technical state from the nightly Closelooknet bake, not advice. The Technical tab carries the full row.

How does Bitwise 10 Crypto Index ETF trade when bond yields rise?

Over the past year Bitwise 10 Crypto Index ETF had a beta of 0.24 to TLT, the long-dated Treasury fund — it shows only a loose link to bond moves, higher than 17% of US names. On the 10 sessions in which long bonds fell most it moved −2.39% on average, against −0.74% for the S&P 500. As of 2026-10-30; The "How it trades on rate days" block on this page carries the lines.

Where has Closelooknet written about Bitwise 10 Crypto Index ETF?

Bitwise 10 Crypto Index ETF appears in 6 Closelooknet pieces as of 2026-10-31, most recently Daily Pulse: Bitcoin and Gold — The Has-Been Breaks Out, the Darling Rolls Over (2026-09-21); Weekly Signal: Bitcoin — New Life for the Coins and the Stocks (2026-09-20); Midday 10: Semis break the 505 line at midday while bitcoin presses 80,000 (2026-08-24). What Closelooknet said most recently: Friday's closes from the Closelook data lake: Table as text Name Friday close Friday Strategy (MSTR) 153.92 +16.4% Marathon (MARA) 13.24 +13.8% Coinbase (COIN) 194.25 +11.7% Robinhood (HOOD) 119.82 +9.1% Riot (RIOT) 23.75 +8.6% Hut 8… (Daily Pulse, 2026-09-21). The "Mentioned on Closelooknet" block on this page lists the long reads, the reference entries and the dailies that name it.

What does this page show?

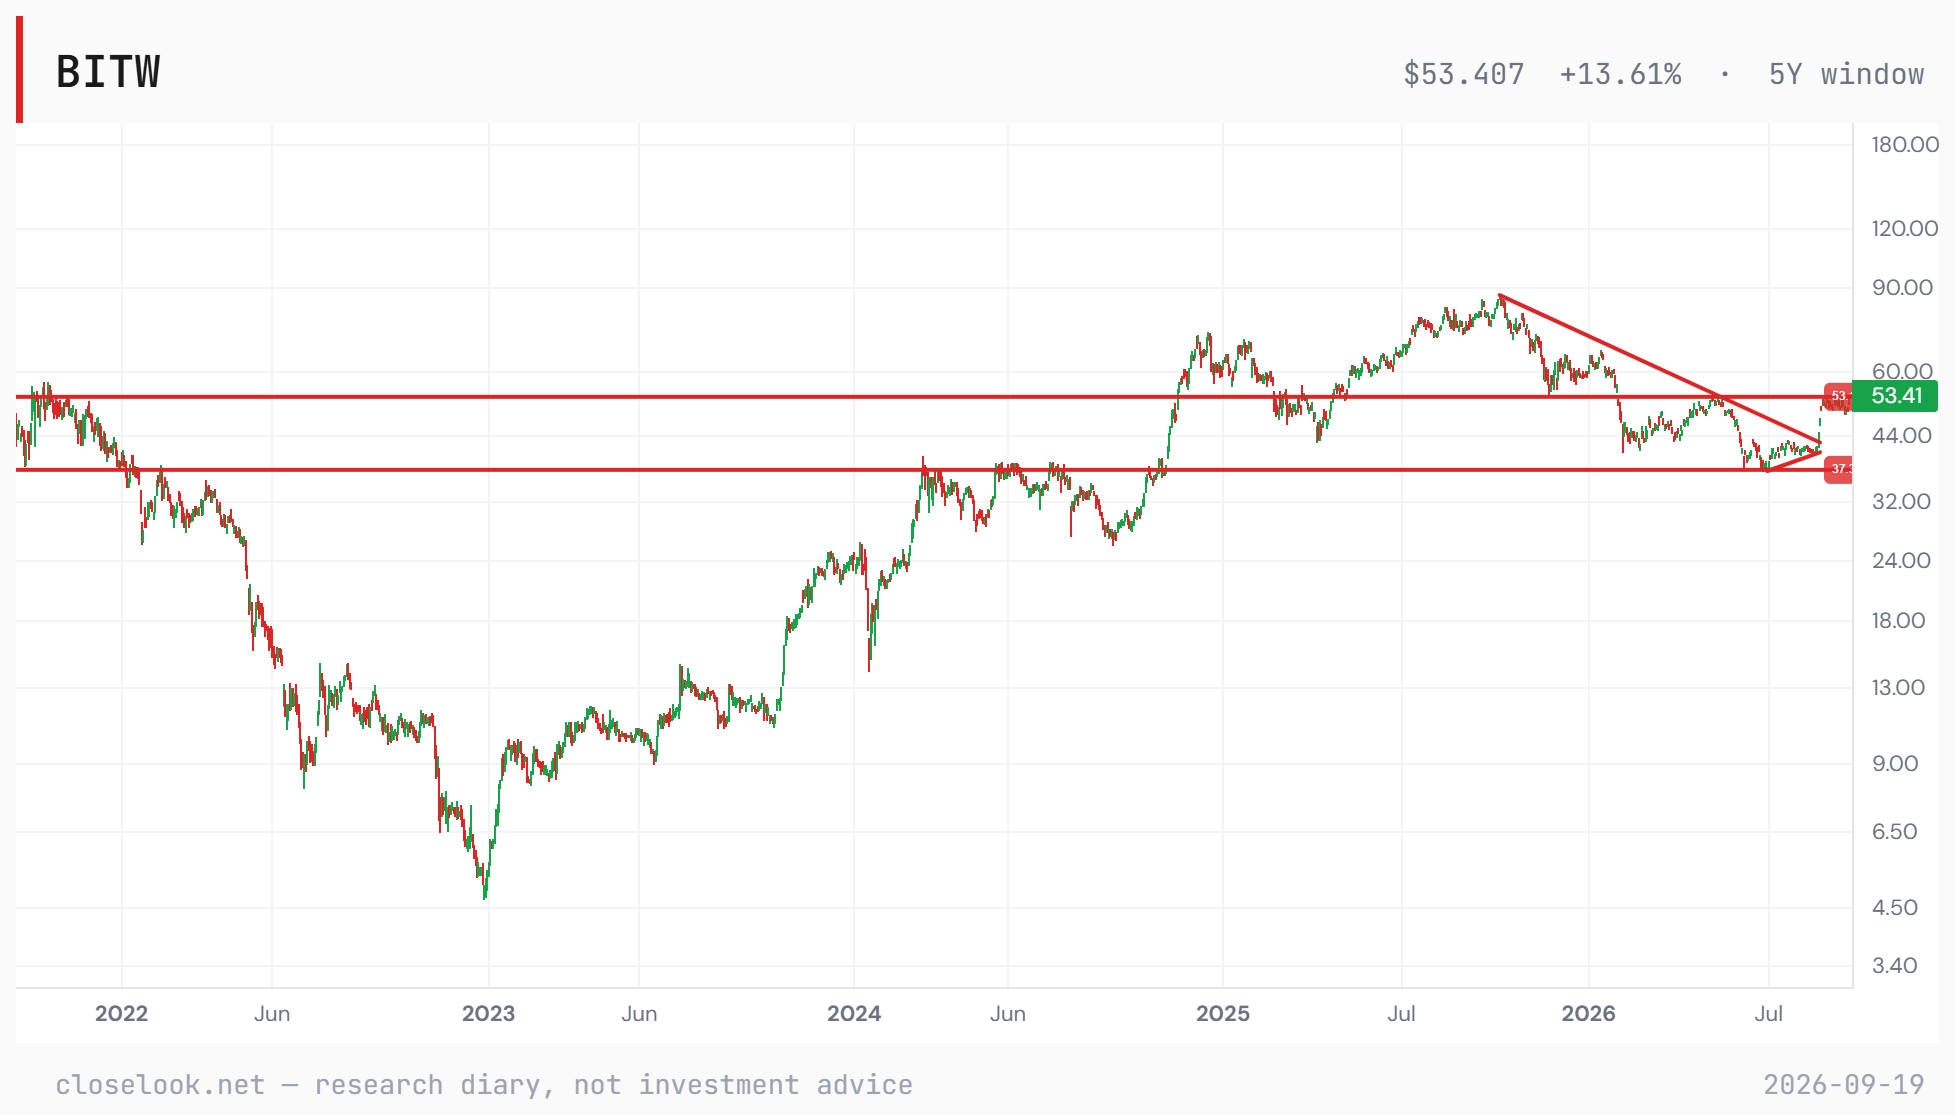
A live price chart with SMA overlays and drawing tools for BITW, fund basics and the top holdings by weight with the Closelooknet names among them marked, the technical state where the data exists, and the research diary mentions — an investment research diary view, not investment advice.

How to use this chart

Toolbar

  • Range — 1M to MAX on daily closes. 1D/5D switch a US stock cell to 5-minute intraday bars; index and foreign cells fall back to 1M daily with a note.
  • Grid — 1×1 up to 2×2. Cells are synchronized: pan or zoom one and the others follow the same dates; the crosshair tracks across all of them. 4 INDICES loads Rubin · HALO · AEI · AW40 side by side.
  • Type / Scale — OHLC, line or area; linear or log price axis.

Picking a series

  • Tap the box in a cell's header to browse every Closelooknet series — headline indices, sub-indices, sectors, layers of all six families — plus the constituents.
  • Or type any ticker (NVDA, 7203.T, ASML.AS …) and press Enter — it charts in the cell straight from our data lake.

Studies

  • Overlays / Oscillators rows toggle the standard set (SMA, Bollinger, RSI, MACD …) per cell.
  • Levels (stock cells) draws the structure engine's support lines — regression bands, pivot cluster, SMA-200, the active fib zone.

Drawing

  • Tap a tool (Trend, Ray, H-Line, Fib, Channel, Rect, Note), then tap the chart once per point — the shape follows your finger or cursor between taps. The chart stops panning while a tool is armed; tap the tool again to release.
  • Drawings save per symbol in this browser and travel between the terminal and the asset page.
  • Delete key removes the selected drawing · Escape cancels a half-placed one · Clear wipes the symbol.

Wave counts

  • Wave places an Elliott count: tap the origin, then each wave end. Press Enter to stop early (inside wave 3 is fine) — dotted ghost targets sketch the remaining waves at guideline ratios.
  • On stocks the scanner's machine count appears automatically in grey — it is fully editable: drag any point, double-tap a label to remove it, Delete to dismiss it for good, Adopt to bring the machine's proposal back.
  • The sequence picker switches 1-5 / A-B-C / A-E / W-X-Y-Z; 1 2 3 cycles the degree; Subdiv starts a one-degree-smaller child count inside a wave.

Sharing

  • Card exports the cell as a branded PNG — chart, drawings and levels exactly as shown.