Read · · 6 min read
Bull Markets — Crypto and Gold Broke Their 2022 Trends First
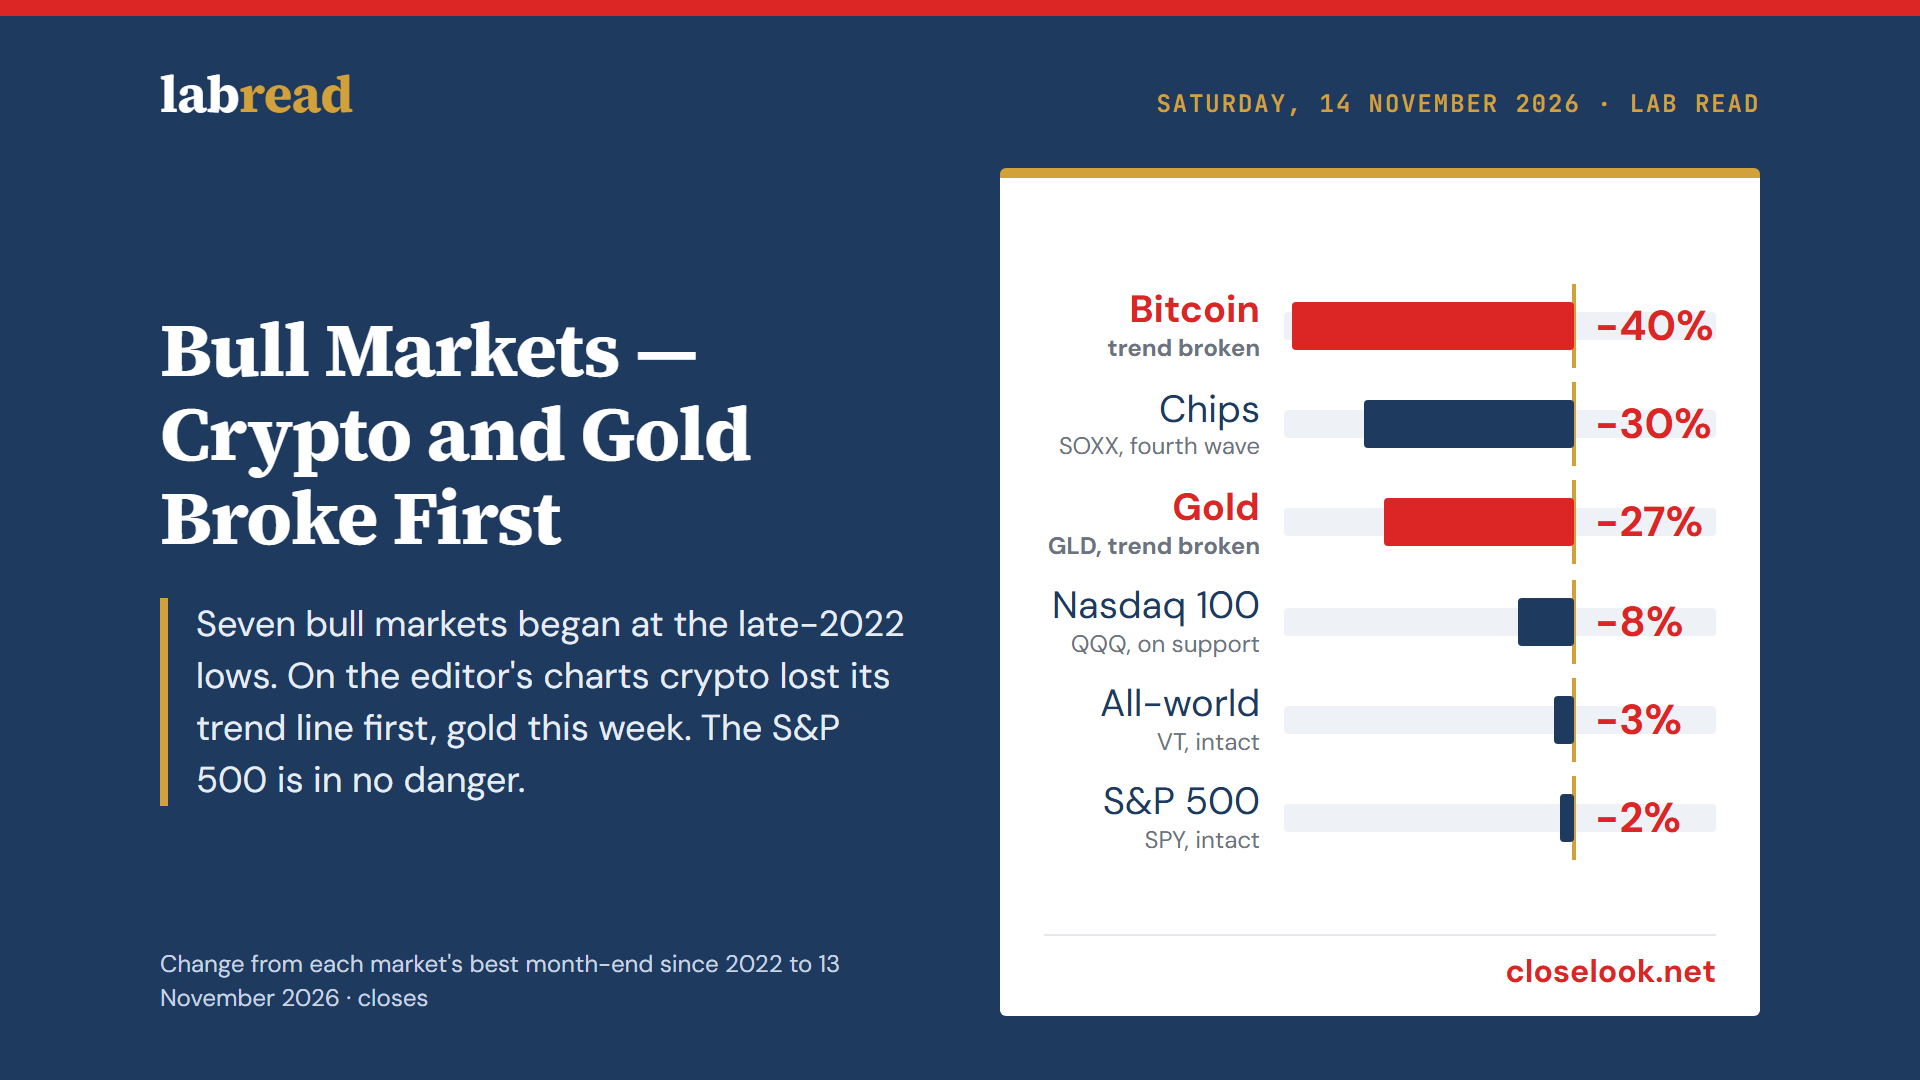
Seven bull markets began at the late-2022 lows. On the editor’s charts crypto lost its trend line earlier this year and gold this week; the Nasdaq 100 sits on support, the S&P 500 and the world funds are intact, and the chips are in a correction inside their trend. With a month-by-month race of all seven.

A Lab Read on the bull markets that began at the lows of late 2022 and which of them still hold their trend. The trend lines and wave counts are the editor’s, read off his charts of 13 November; the closes are those of Friday 13 November 2026, and the race uses month-end closes. Diary framing throughout: this is how we read the charts and what we watch, not what anyone should do with it.
Seven bull markets, one starting line
The bull markets of the past three years began in the same few weeks. Bitcoin, gold, the chips, the Nasdaq 100, the S&P 500 and the world stock funds all made their lows in the autumn of 2022, and all of them rose from there. By different amounts: $100 put into each on the last close of 2022 is worth $420 in bitcoin today, $386 in the chip fund, $255 in the Nasdaq 100 fund, $210 in gold, $197 in the S&P 500 fund, $180 in the all-world fund and $161 in the world fund outside the US.
The race below replays those three years, one frame per month. Watch the last twelve months. The two runners that held first and second place for most of the way, bitcoin and the chips, give back the most. Gold, which rose late and fast, turns down from February. The broad stock funds keep their place.
Open the race full size, with the table of where each market stands →
What breaks a bull market
A bull market has no official end date. Chart readers mark it with a trend line: a straight line under the rising lows, drawn from the low where the advance began. As long as the price keeps making higher lows above that line, the trend is intact.
The trend is invalidated when the price closes under the line and the next rally fails to get back above it. The old support turns into resistance and the lows begin to fall. That is a statement about behaviour, not a forecast of a crash: it says the market has stopped acting like a bull market on that chart. It does not say how far or how fast the correction goes.
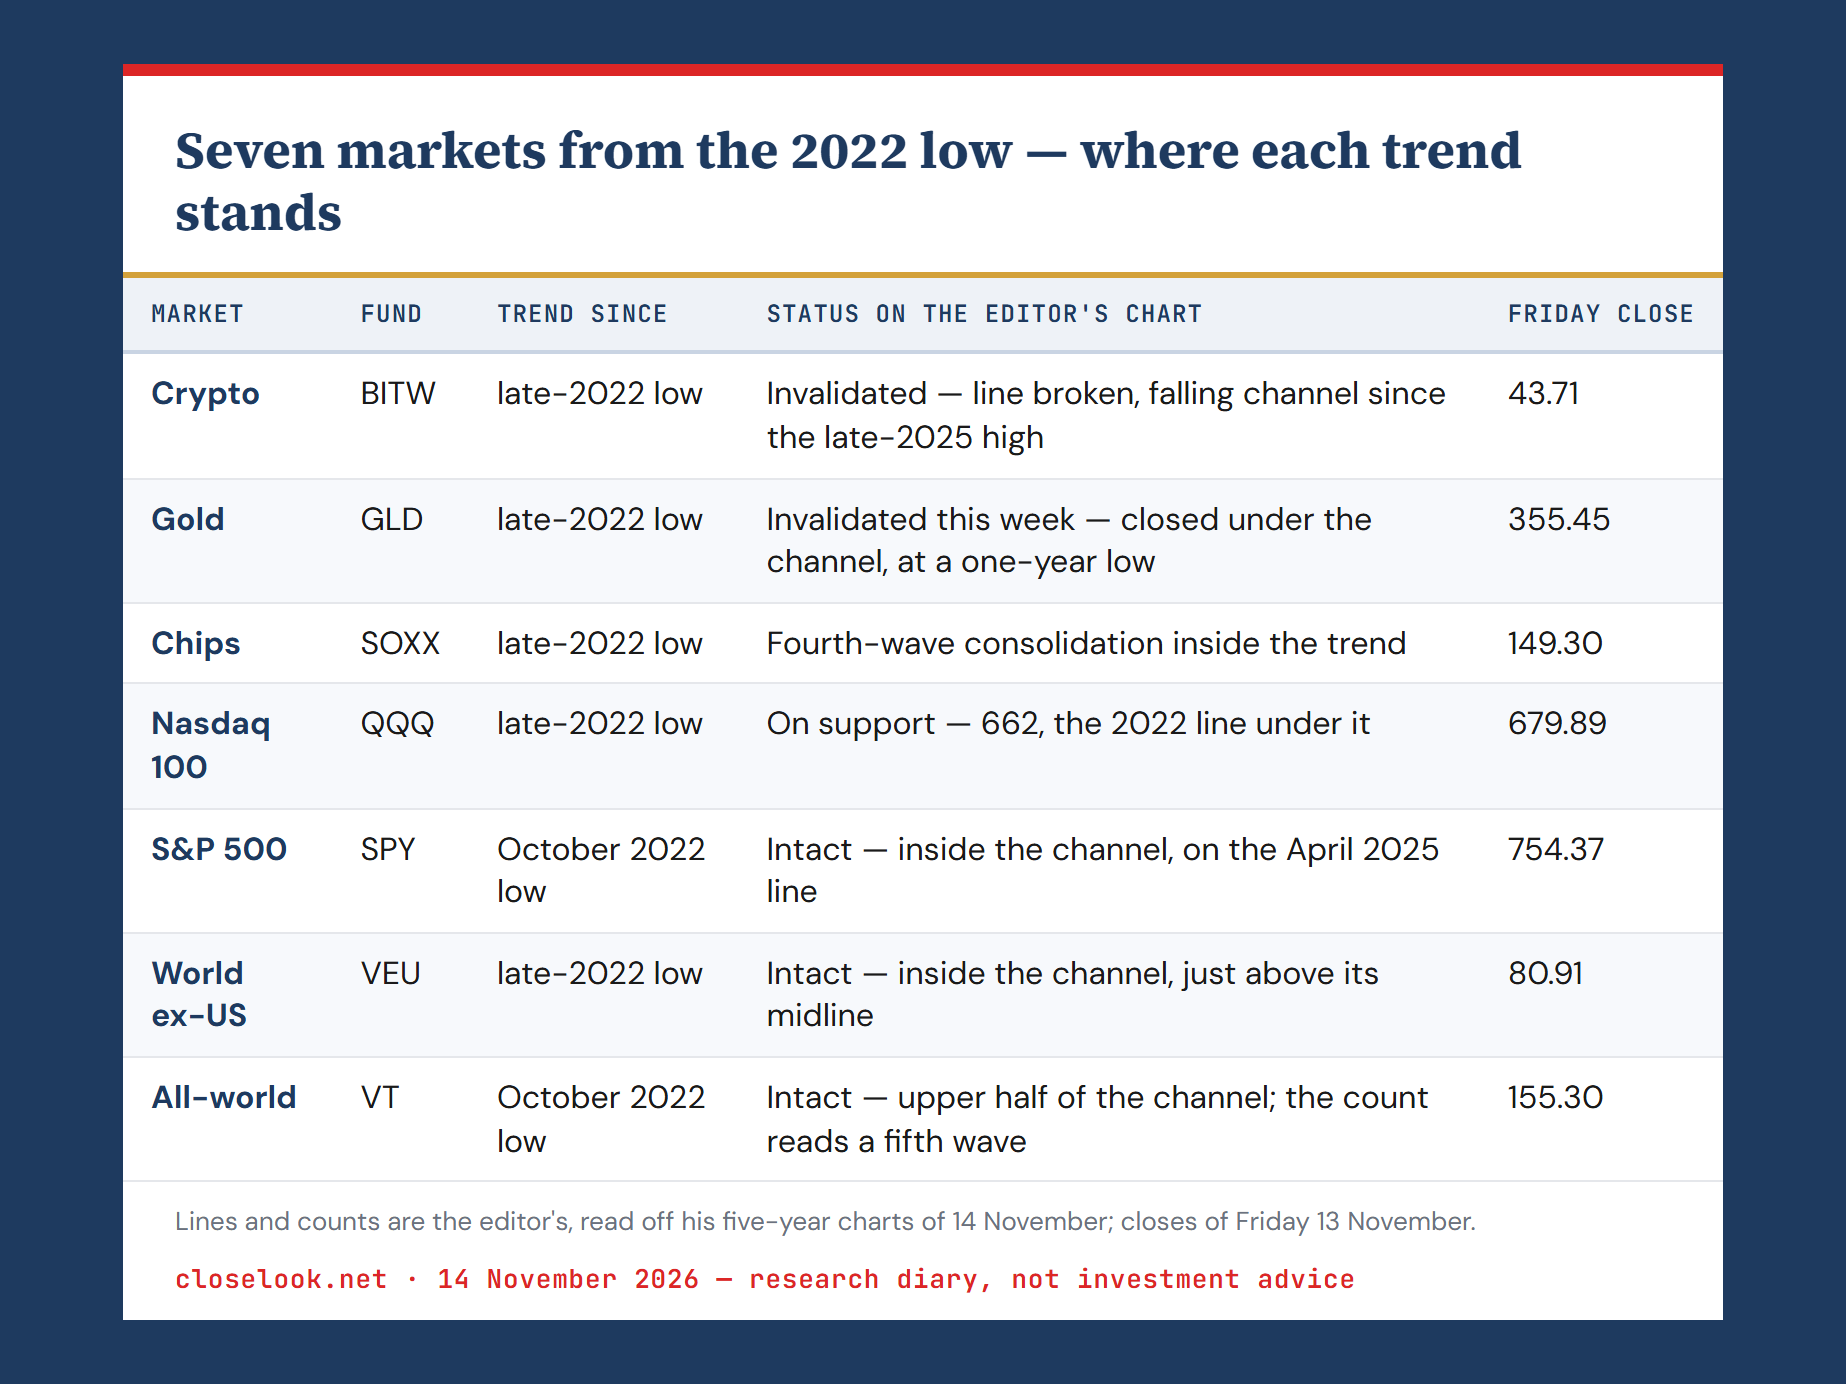
On that test the editor’s charts sort the seven into three groups this week: two with their trends invalidated, one on support, and three intact, with the chips in a correction inside their trend.
Crypto — the first to break
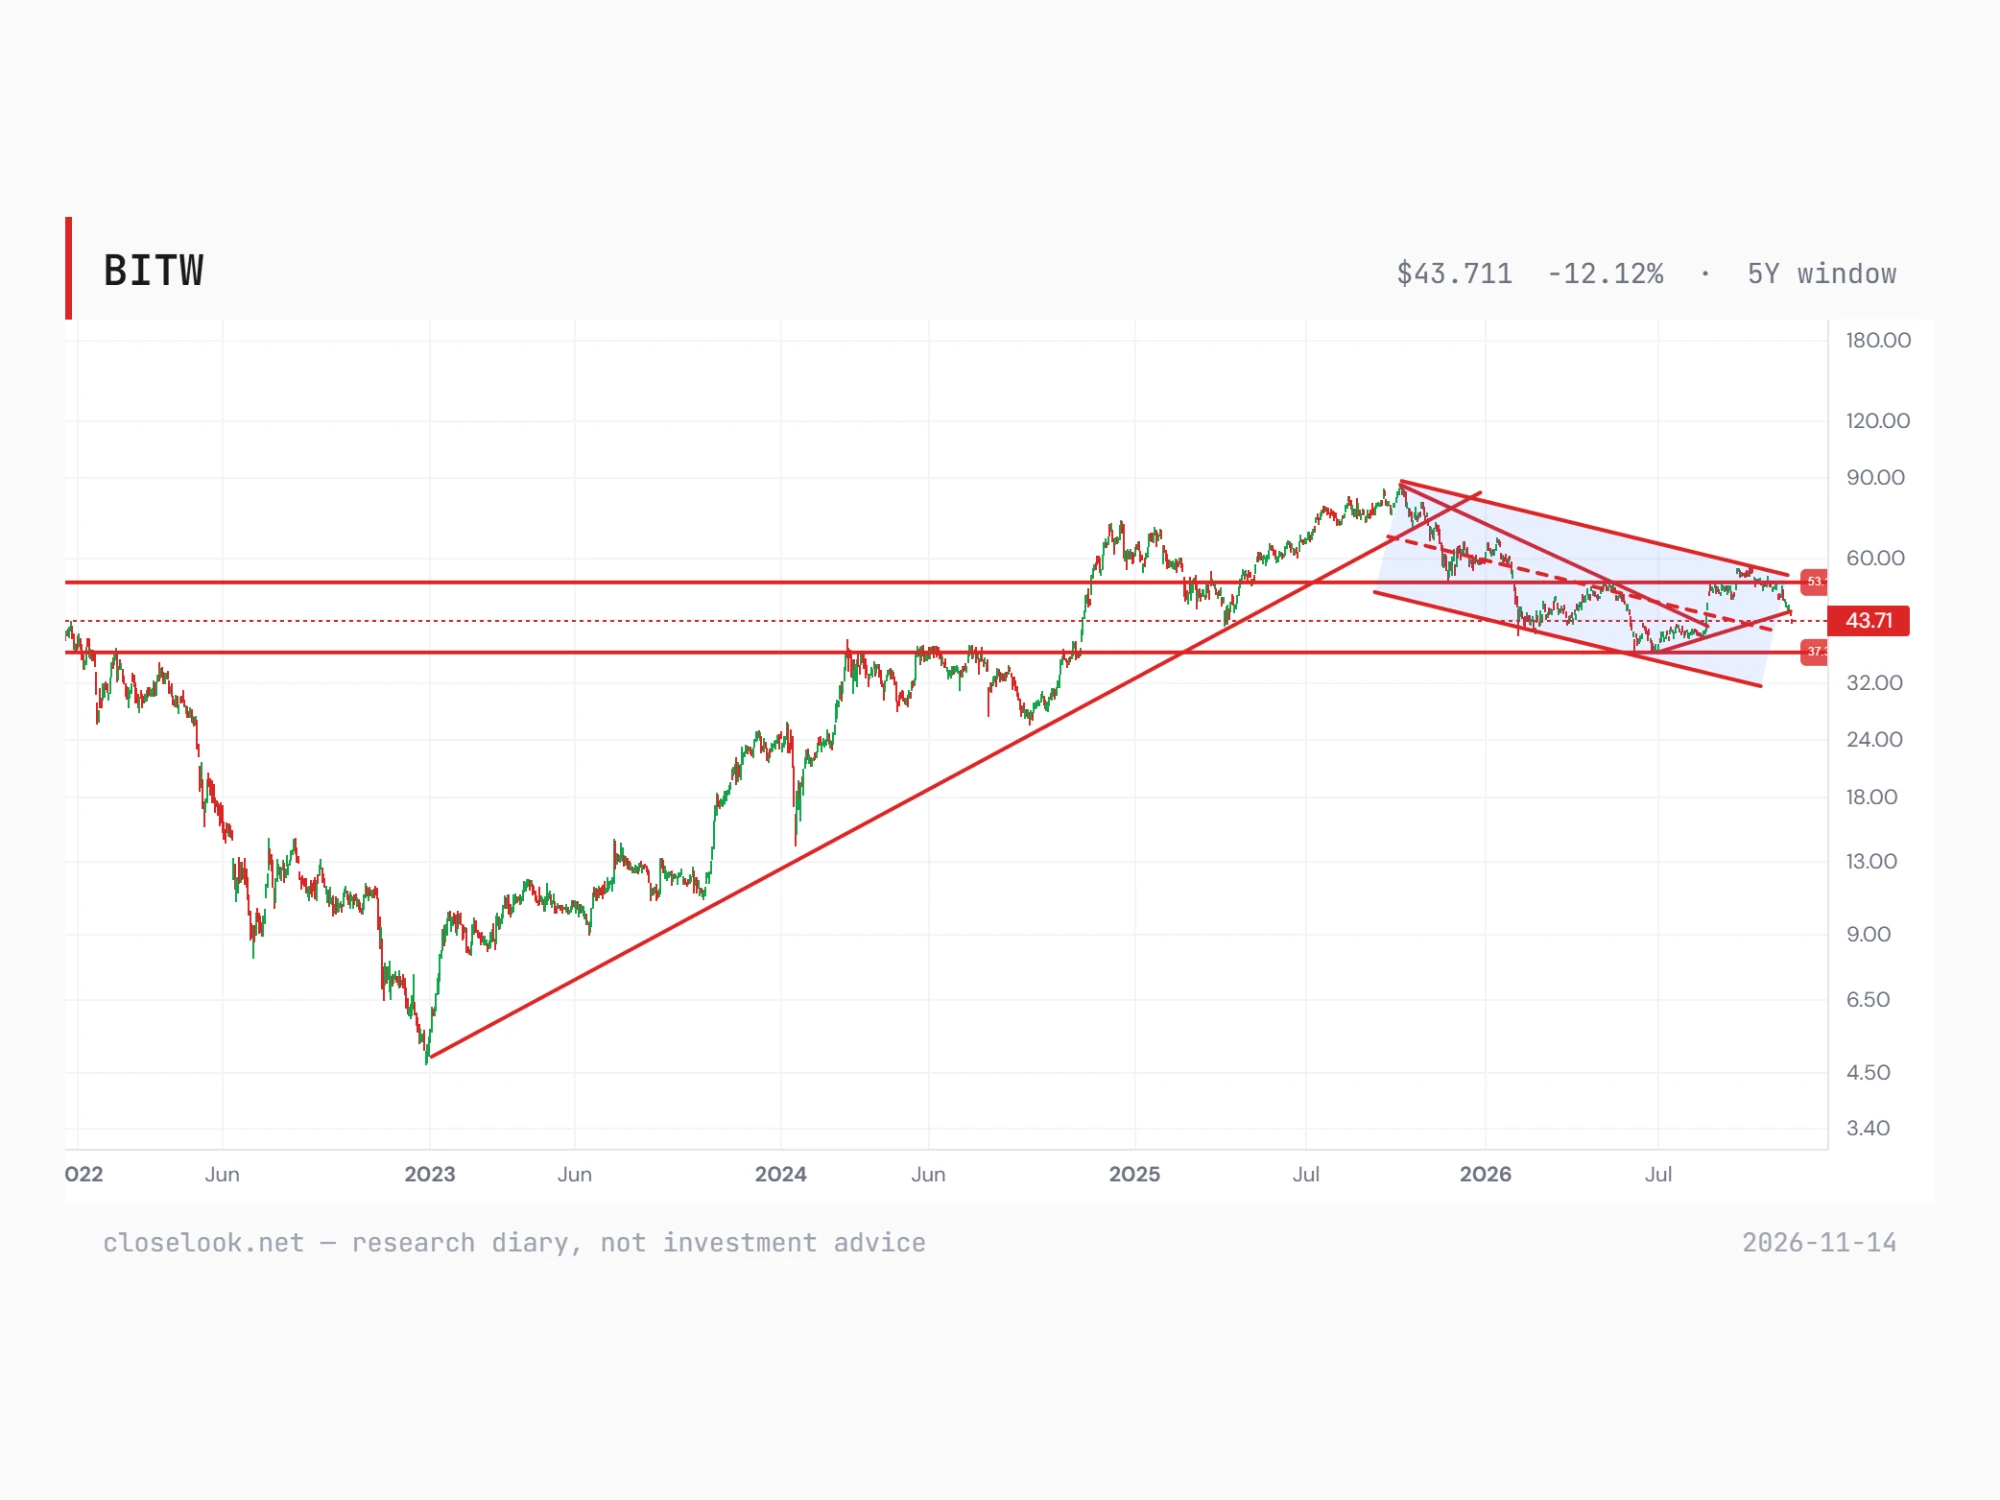
The crypto index fund’s rising line from its late-2022 low broke earlier in the year, and the fund has fallen inside a descending channel since its late-2025 high. The Bitwise 10 Crypto Index fund closed the week at 43.71, between the editor’s lines near 53 above and near 37 below.
Bitcoin closed Friday at 69,556, 30.2% under its close of a year ago to the day, 99,697. In the race it is 40% under its best month-end, July 2025. Crypto failed the trend test first.
Gold — the second, this week
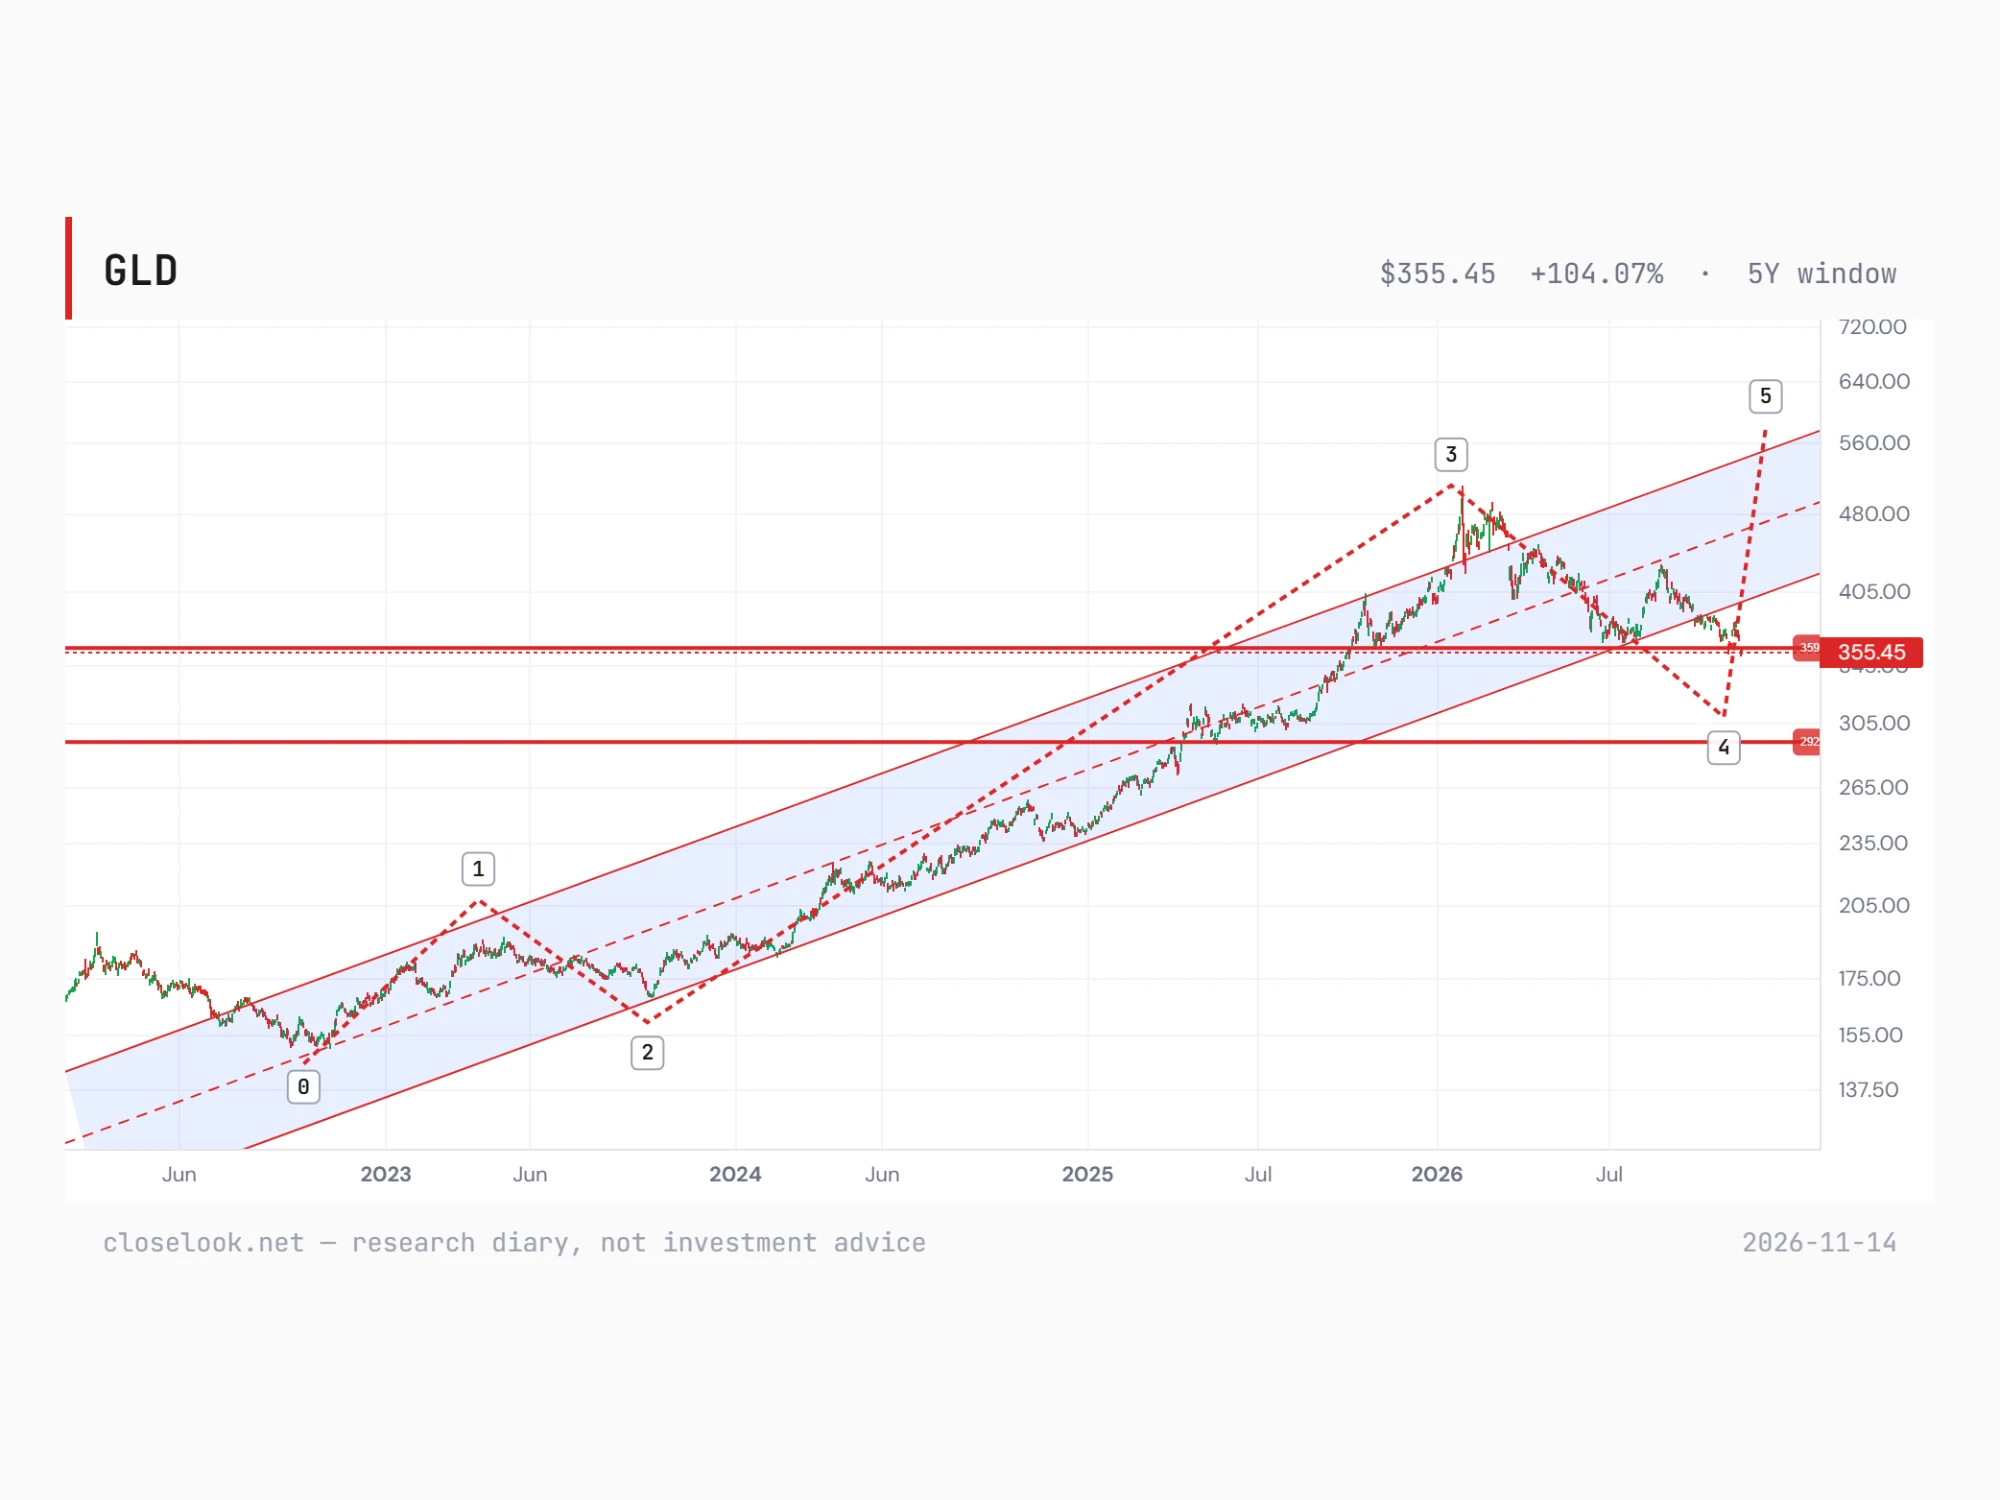
Gold’s channel from the 2022 low held through three years and a record in 2026. This week the fund closed under it. On the editor’s chart the gold fund rose in a rising channel to its record close of 495.90 on 29 January, which his count marks as the top of the third wave.
Friday’s close of 355.45 came a day after 354.89, the lowest close in a year. It sits under the channel’s lower line and under his 359 line; the next line below is 292. The fund is 28.3% under its record and still about double where it stood five years ago. On this chart the bull-market trend that began in 2022 is invalidated, and what follows is a correction of the whole rise.
The Nasdaq 100 — on support
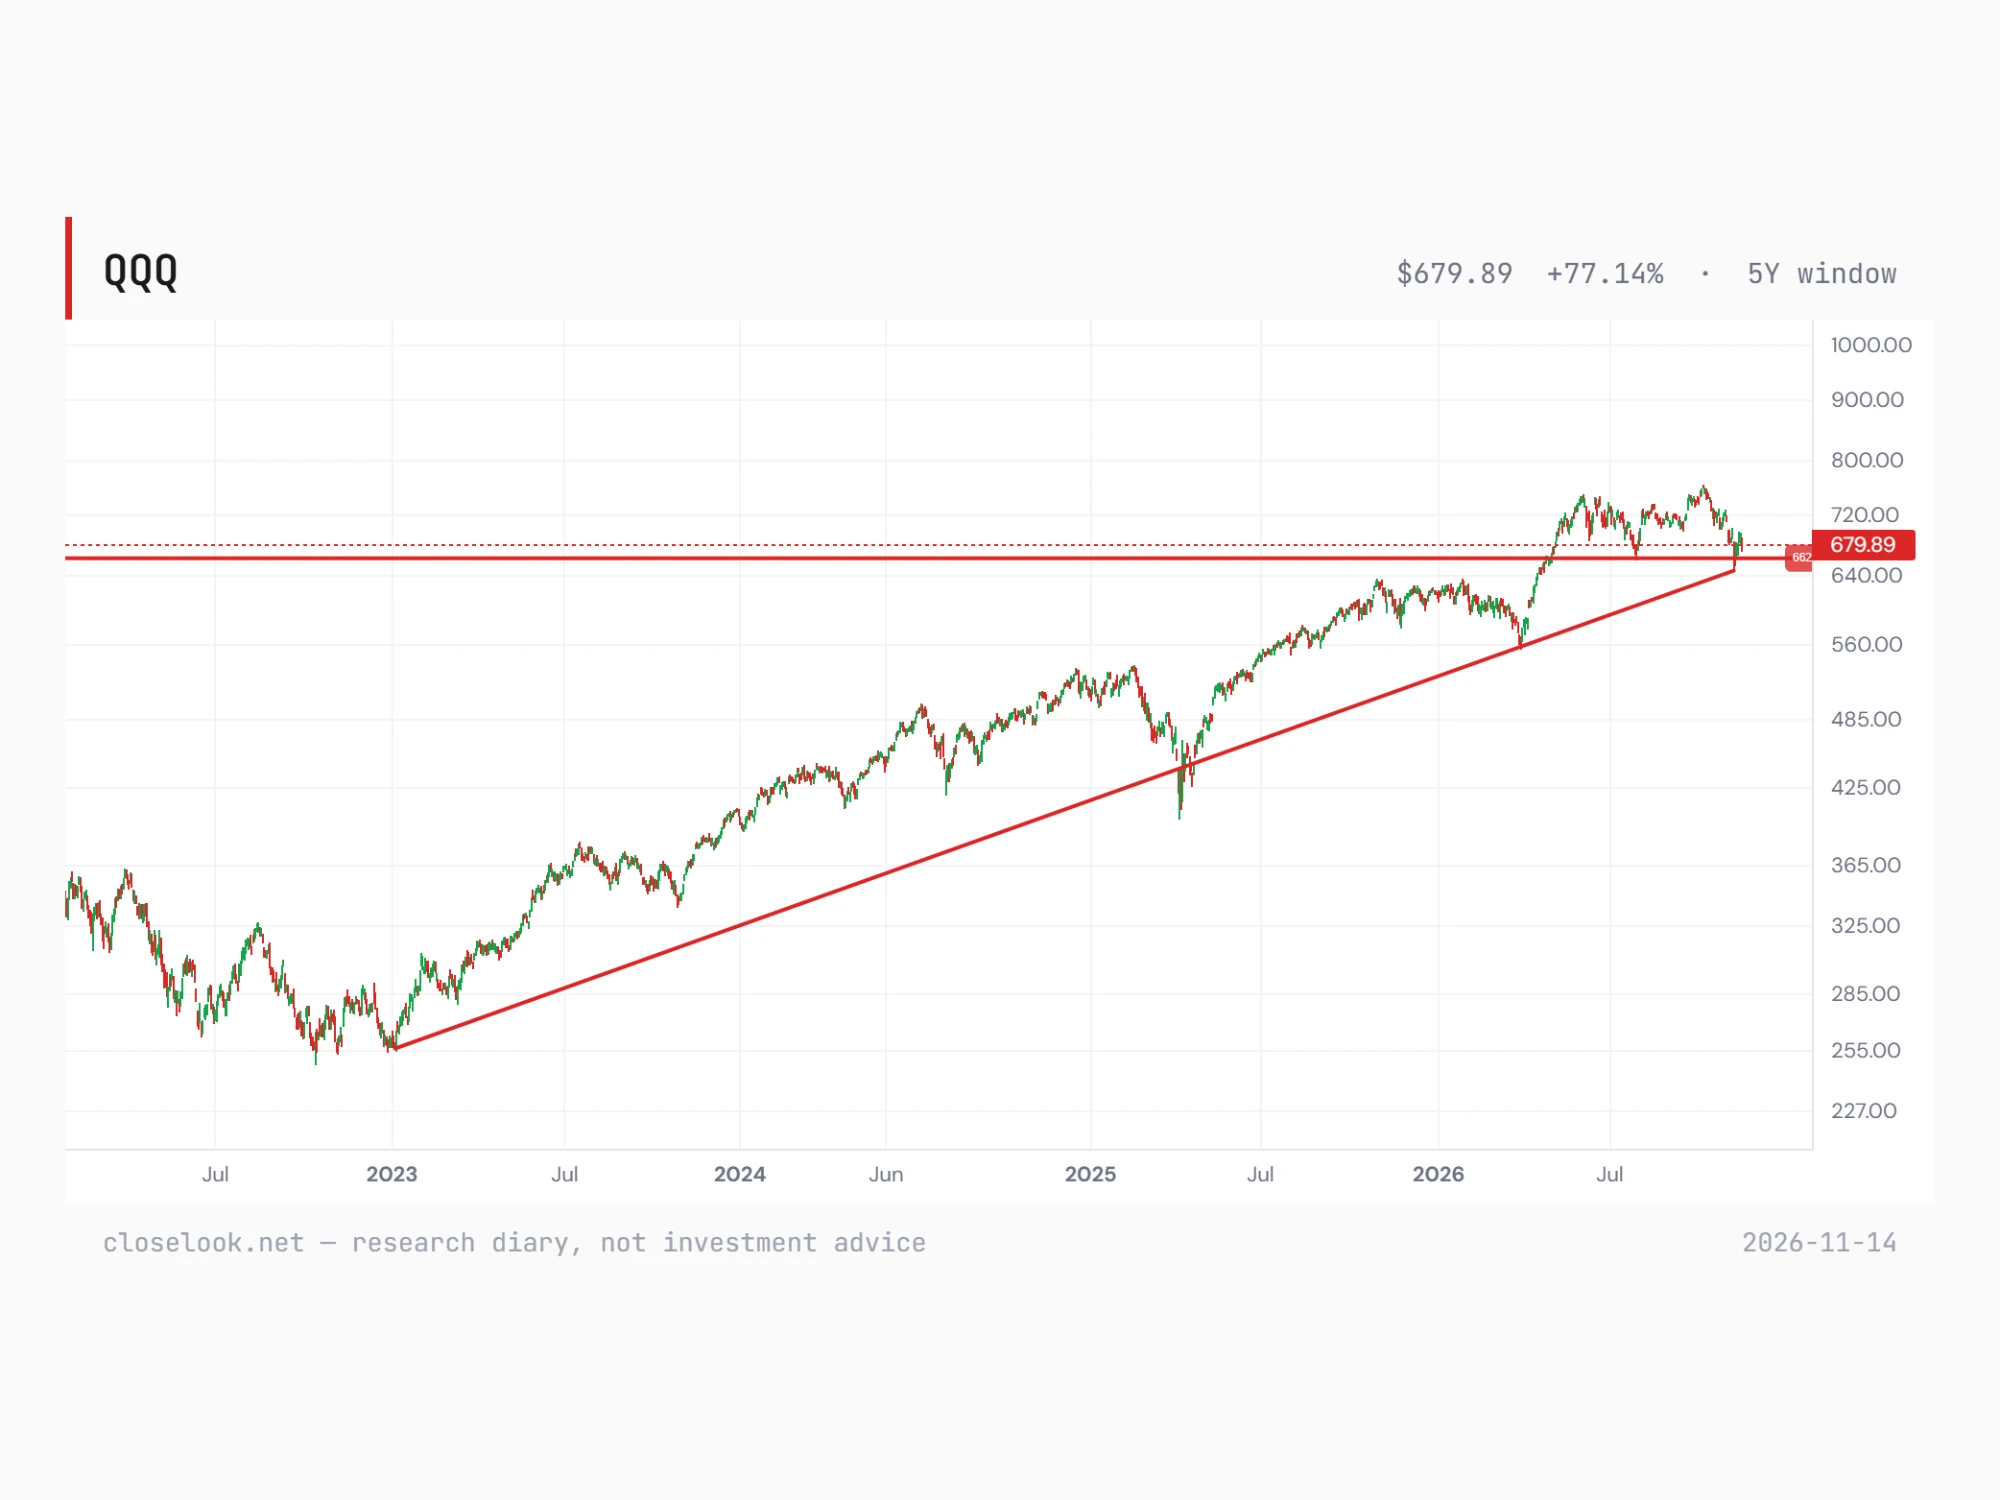
Next on the line are the stock markets, and the Nasdaq 100 is the closest. On the editor’s chart a horizontal line at 662 carried this week’s low: the fund’s lowest price of the week was 662.02. Under it runs the rising line from the late-2022 low of 260.10, through the April 2025 low and the March 2026 low of 558.28.
Friday’s close of 679.89 sits 2.7% above 662. A weekly close under 662, and then under the 2022 line, would put the Nasdaq 100 on the same list as crypto and gold. A hold keeps this year’s falls in the chips and in software inside a trend that is three years old.
Still intact — the S&P 500 and the world funds
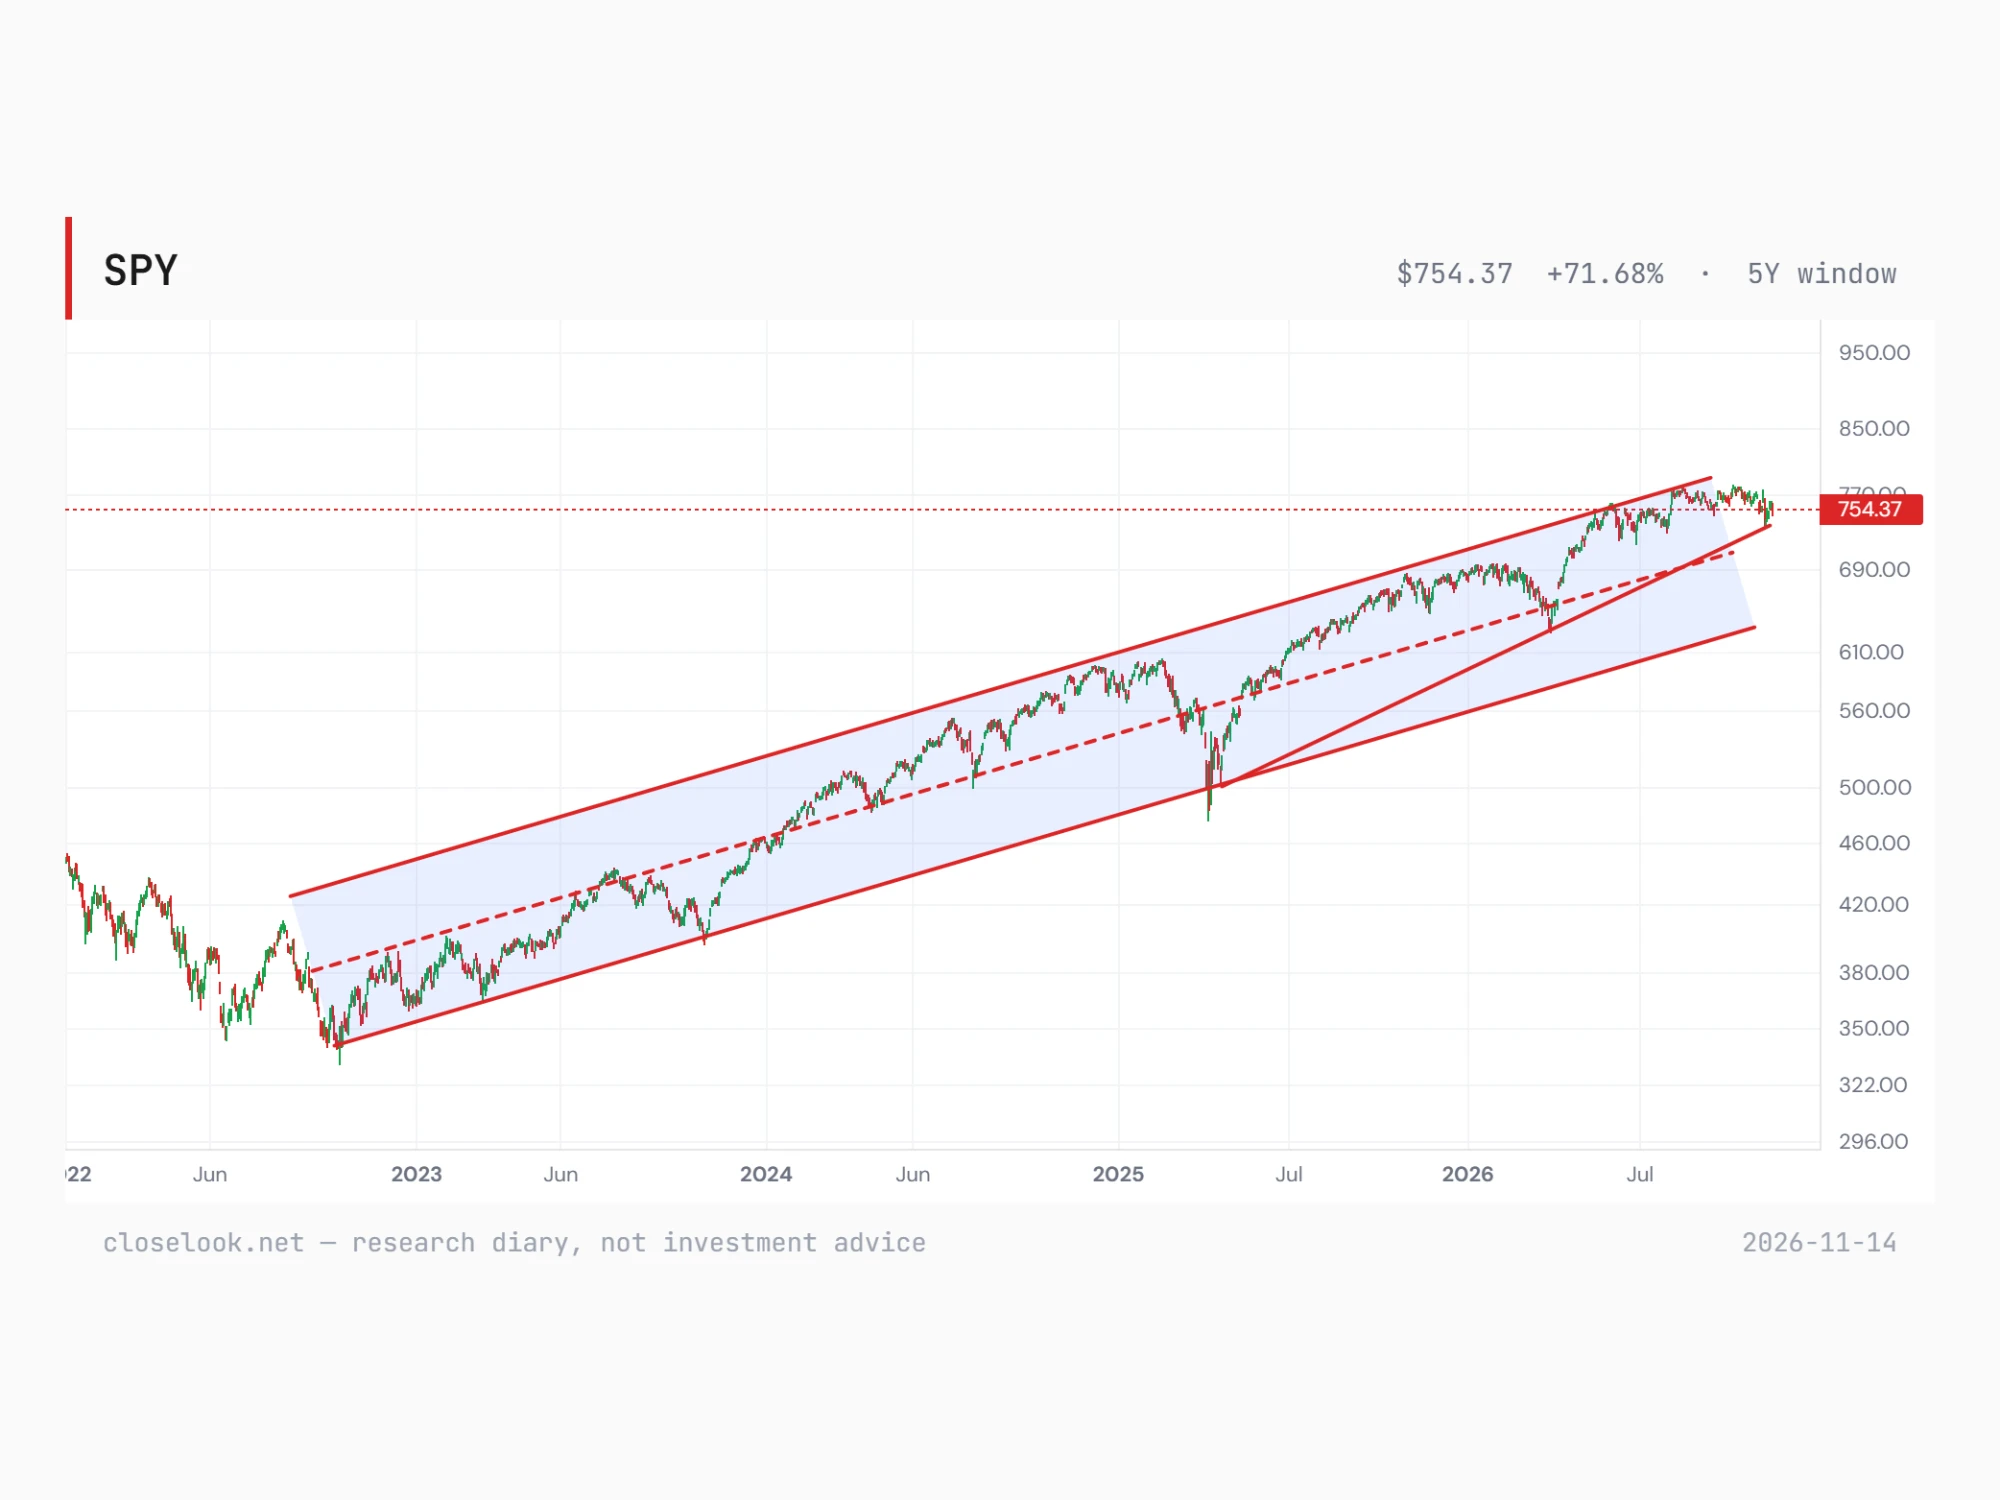
The S&P 500 fund is nowhere near its line. On the editor’s chart it has risen inside a channel from the October 2022 low, with a steeper line from the April 2025 low under the price. Friday’s 754.37 sits on that steeper line, in the upper half of the channel, 3.2% under the record close of 779.09 on 6 October.
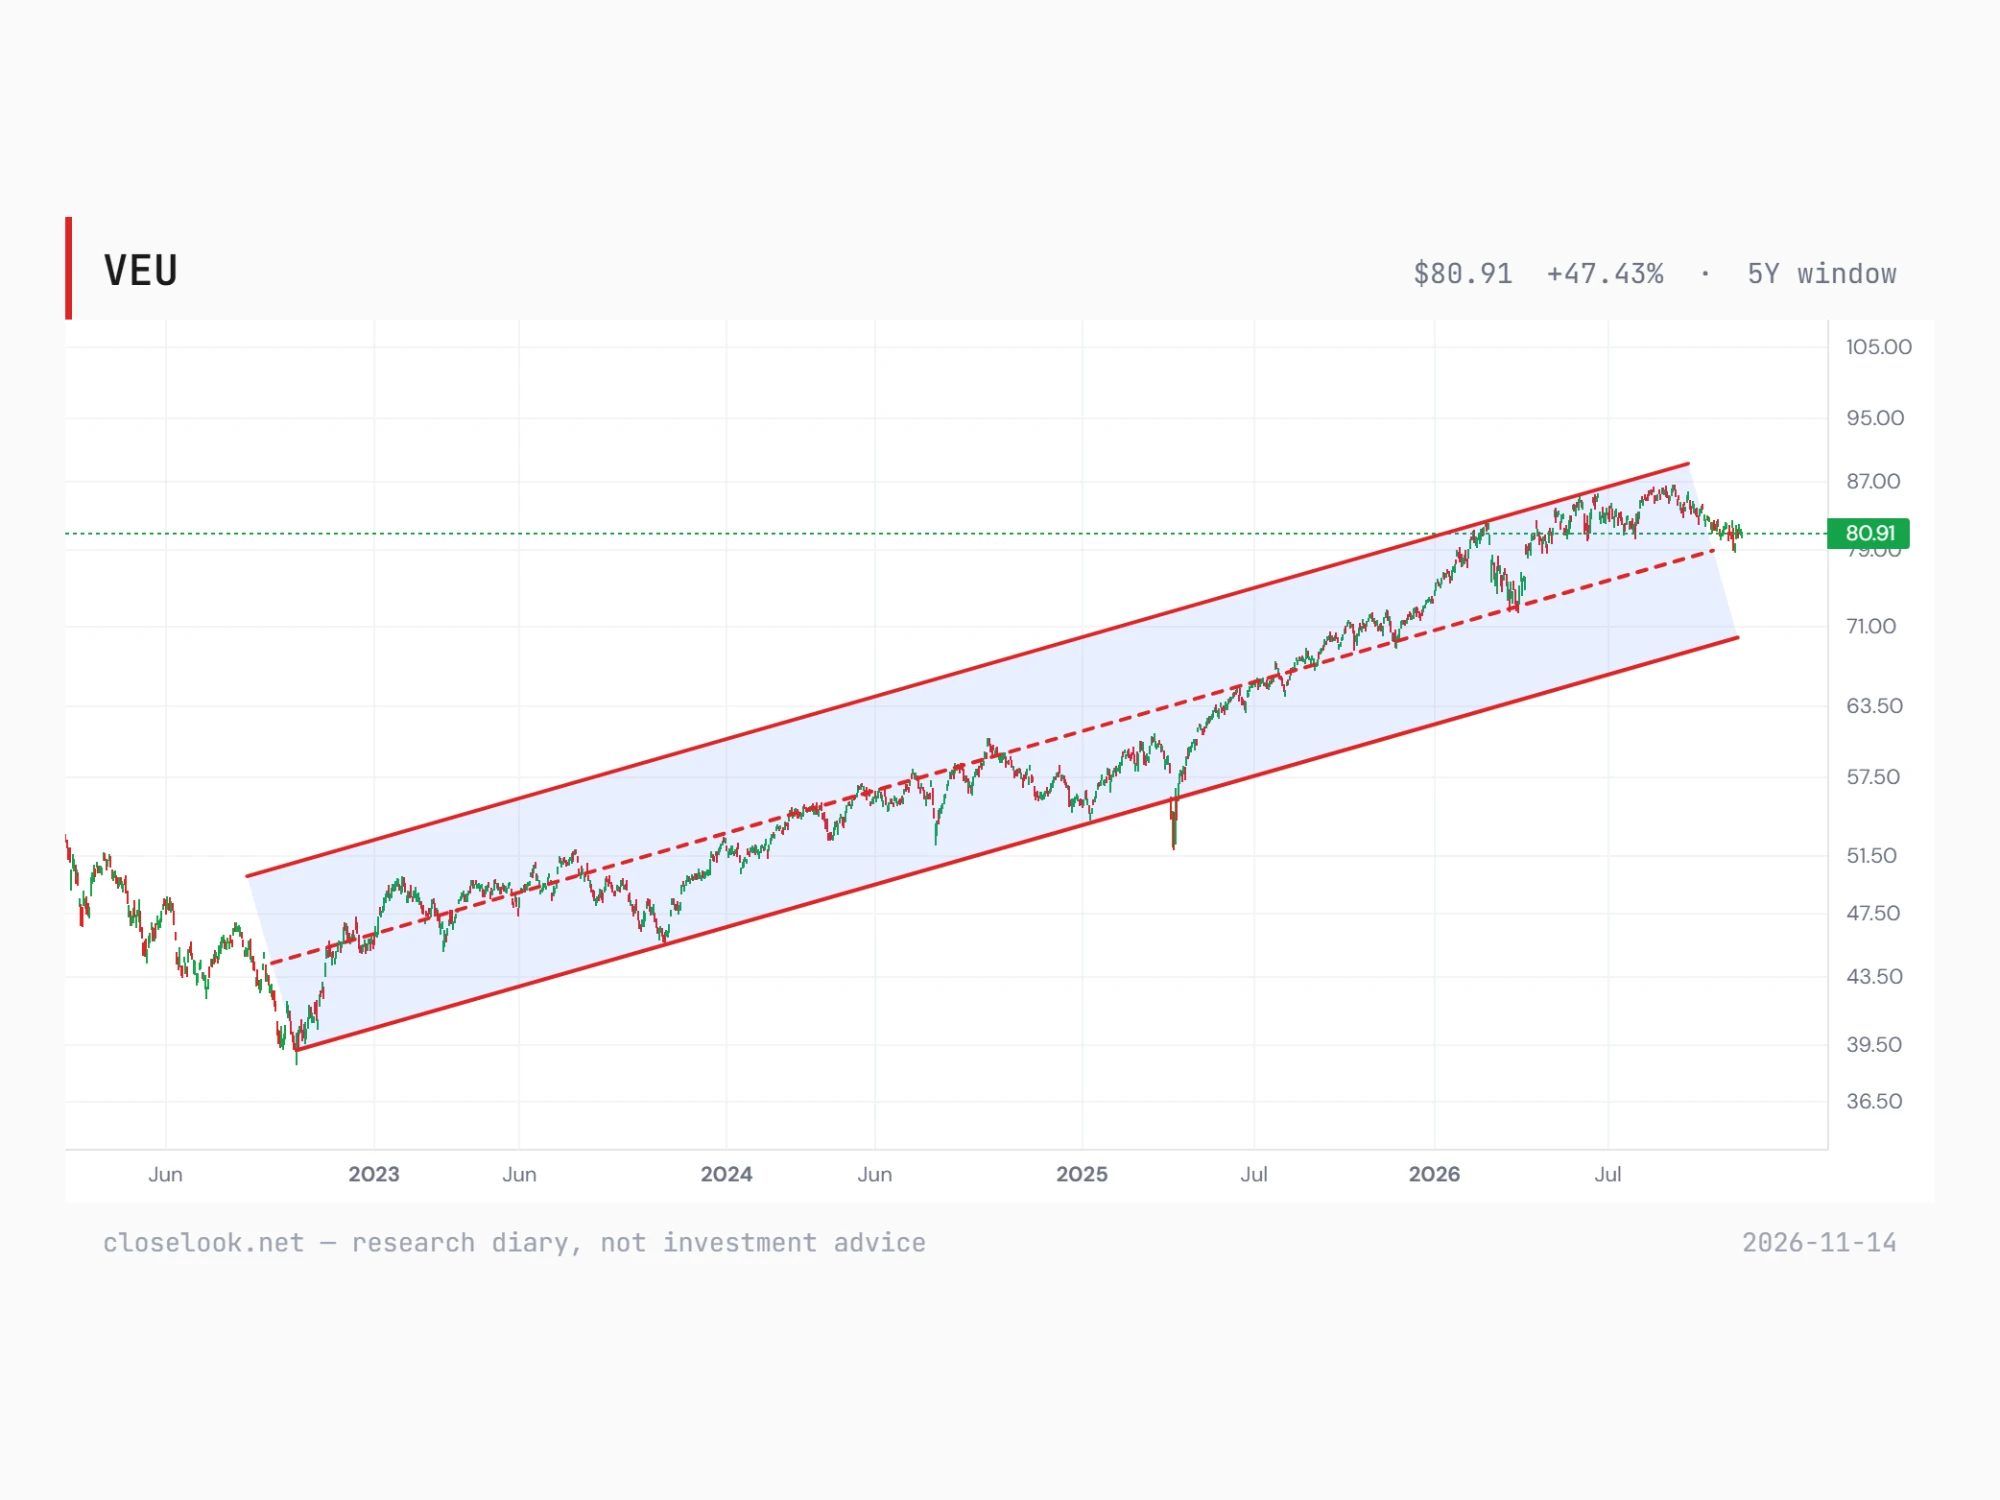
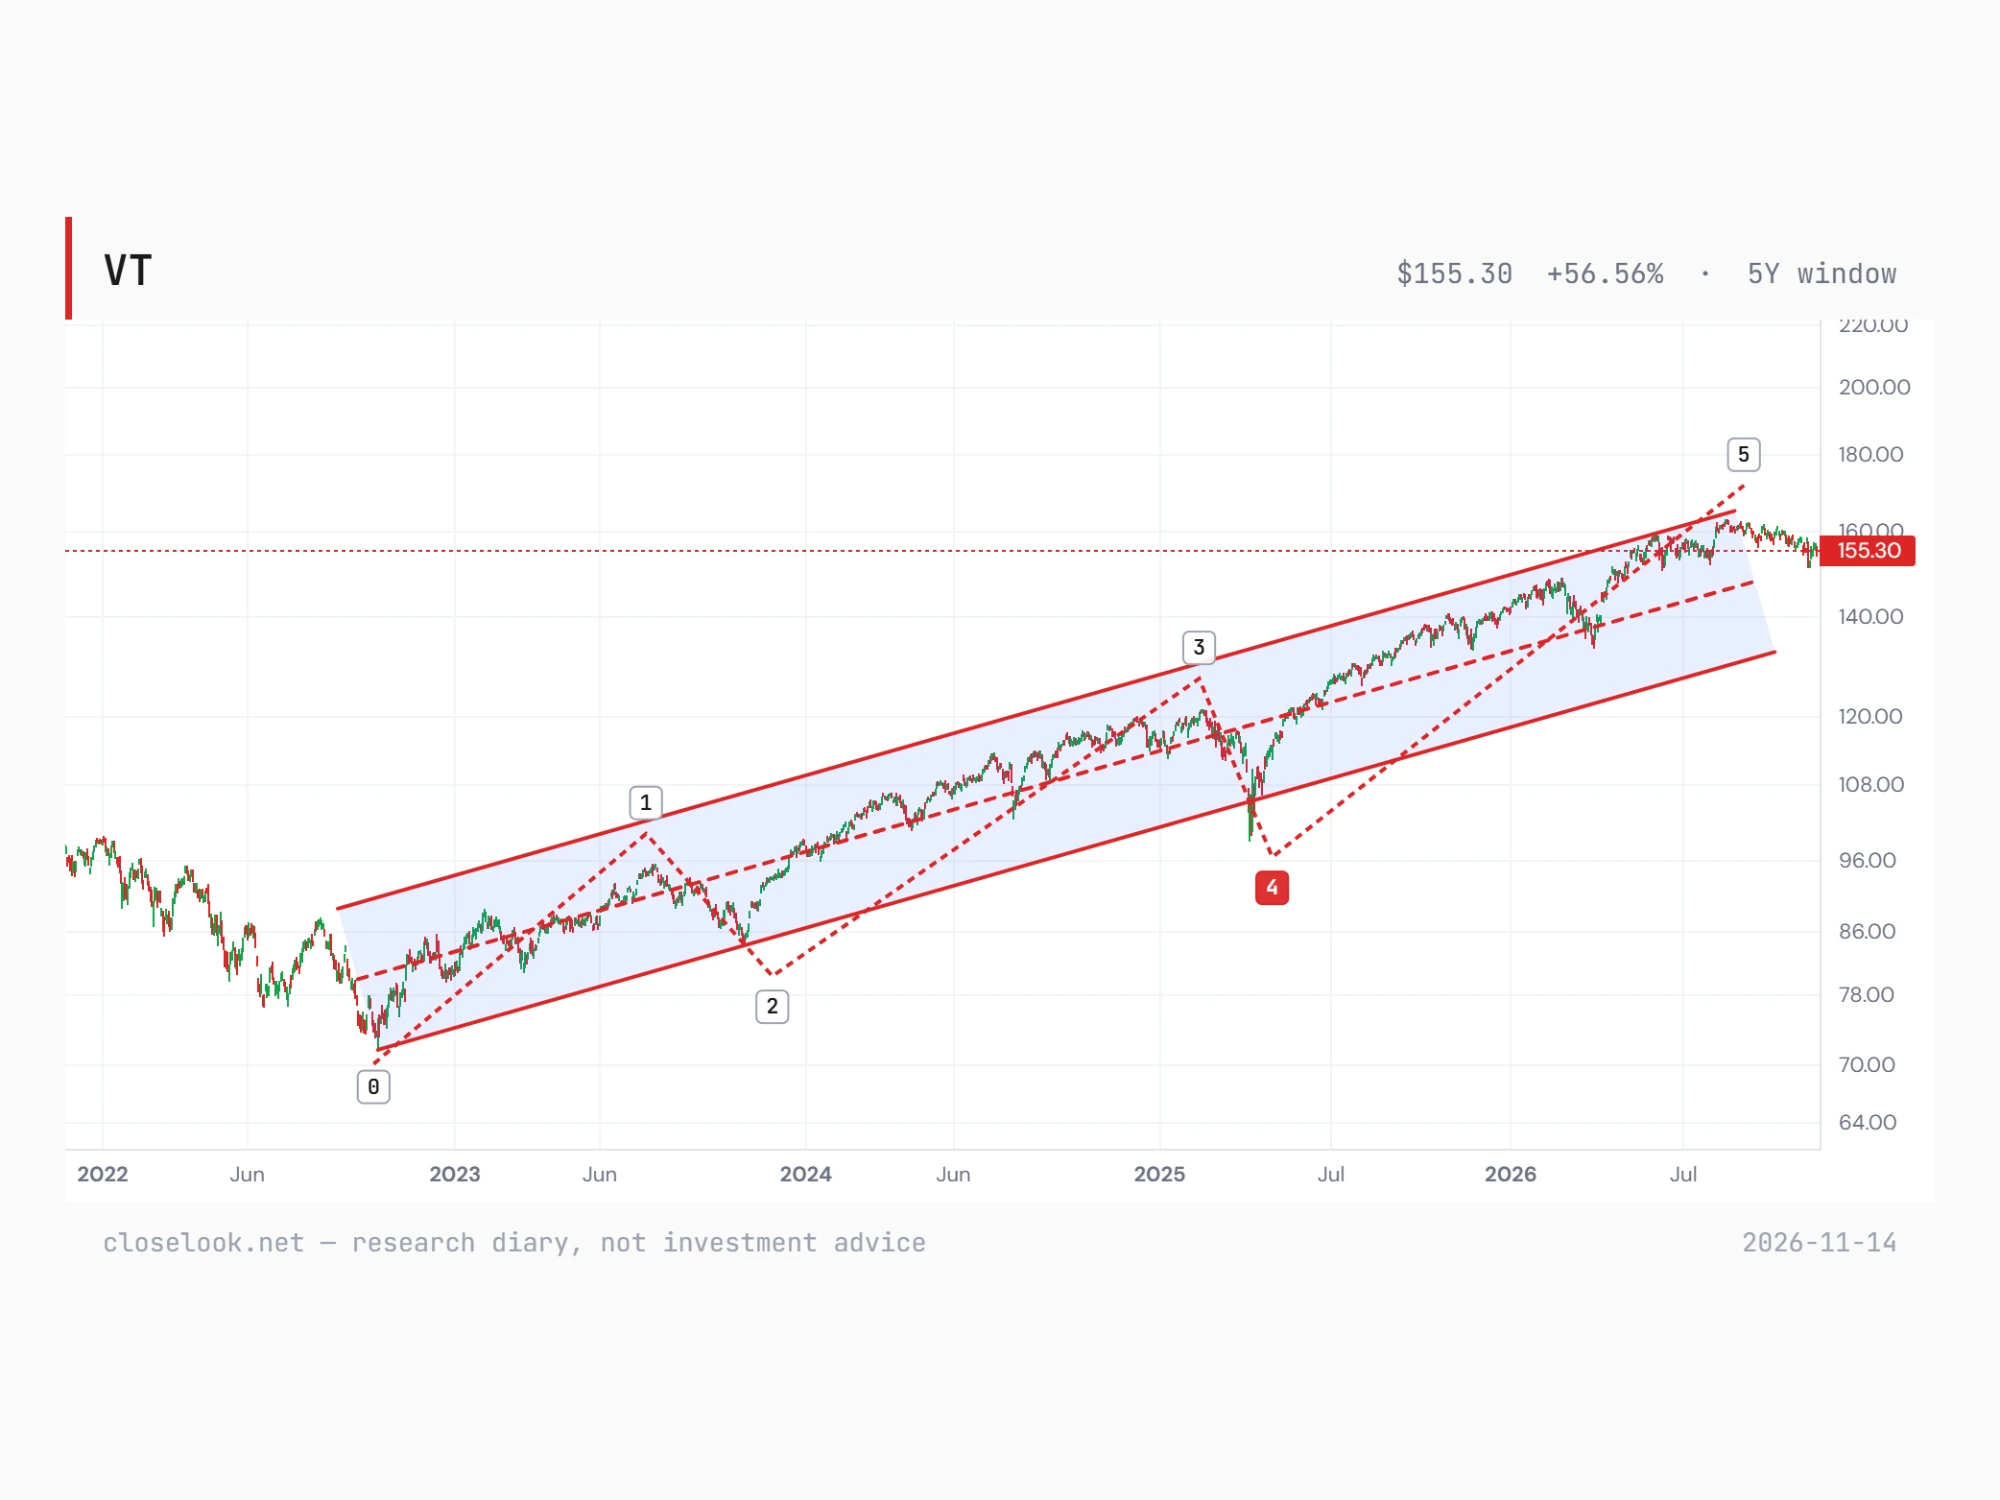
Both world funds still trade inside the channels they have held since the late-2022 low. The world fund outside the US closed at 80.91, just above its channel’s midline, with the lower line far below. The all-world fund closed at 155.30, in the upper half of its channel, and the editor’s count reads its advance from the April 2025 low as a fifth wave. Global stocks are on the line, not off it.
The chips — a correction inside the trend
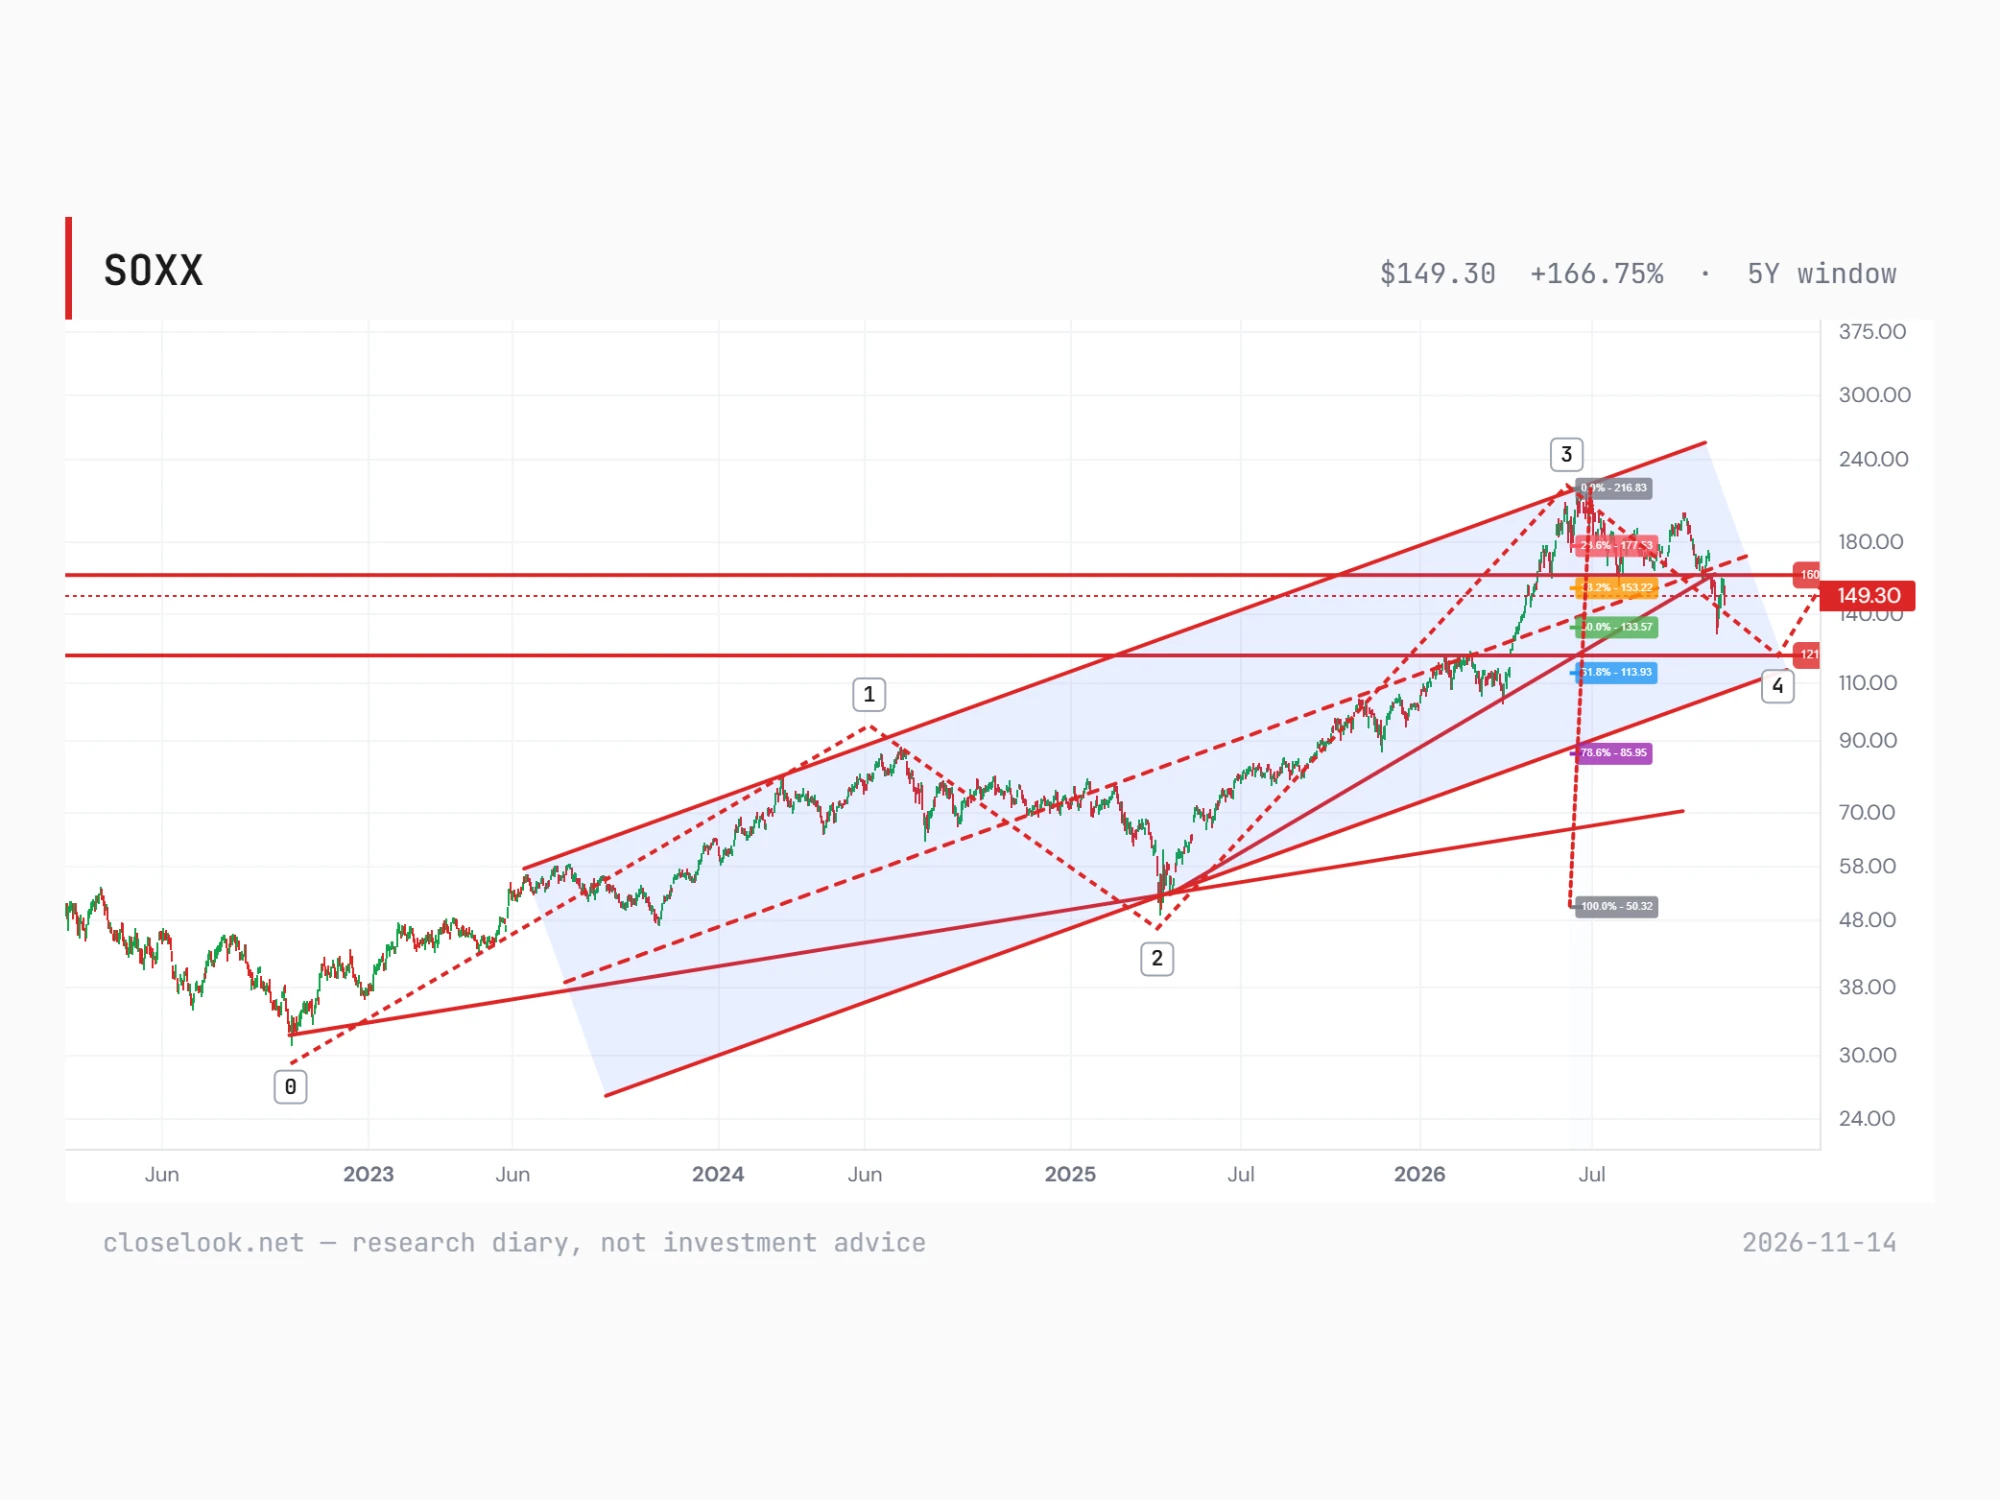
The editor counts the chip fund’s rise from its late-2022 low in waves: a first wave to the mid-2024 high, a second to the April 2025 low, a third to the June 2026 high, and now a fourth, a consolidation of the whole third-wave rise. Measured against that rise, the 38.2% retracement sits at 153.22, the 50% at 133.57 and the 61.8% at 113.93, with his horizontal lines at 160 and 121.
Friday’s 149.30 sits between the 38.2% and the 50% lines; the close of 131.90 on 5 November dipped just under the 50% line. On this count the chip bull market is not over: a fourth wave consolidates, a fifth follows. His chart draws the fourth wave ending near the 121 line. A fall well through the deeper retracements would call the count into question.
Why the order matters
Speculative markets and hedges often lose their trends before broad stock indices do. This year crypto went first and gold second, and that is why the editor watches the Nasdaq 100’s line next. Inside the stock market the order has its own sequence: the chips peaked in June, while the S&P 500 made its record close in October.
The same turn shows inside the AI trade itself. In the AI handoff race the build-out ran first in 2026 and gave back first, while the companies putting AI to work rose to a high for the year. A broken trend is confirmed by closes, not by one session, and a close back above the line followed by higher lows would repair it.
What would change the read
- The Nasdaq 100 fund: a weekly close under 662, then under the line from the 2022 low, adds a third broken trend. A hold keeps the stock market’s trend intact.
- Gold: a close back above 359 and the channel’s lower line, then higher lows, would repair the break. Under it, the next line is 292.
- Crypto: a close above the falling channel near 53 on the crypto fund would end the run of lower highs.
- The chips: the 121 line and the 61.8% retracement at 113.93 are where the fourth-wave count is tested.
Closelooknet reads each line as a probability with a level on each side, not as a promise. Two trends from the 2022 class are lost; the closes in the weeks ahead decide whether the list stays at two.