Daily Pulse · · 08:30 CET · 8 min read · macro · SOXX

In this edition
Pattern alerts
- CRWV ai-cloud-group-lost-most-while-10-year-yield-above-5-percent WARNING
- SOXX chip-fund-fell-on-8-of-12-yield-jump-days BEARISH
- XLE energy-fund-rose-on-10-of-12-yield-jump-days BULLISH
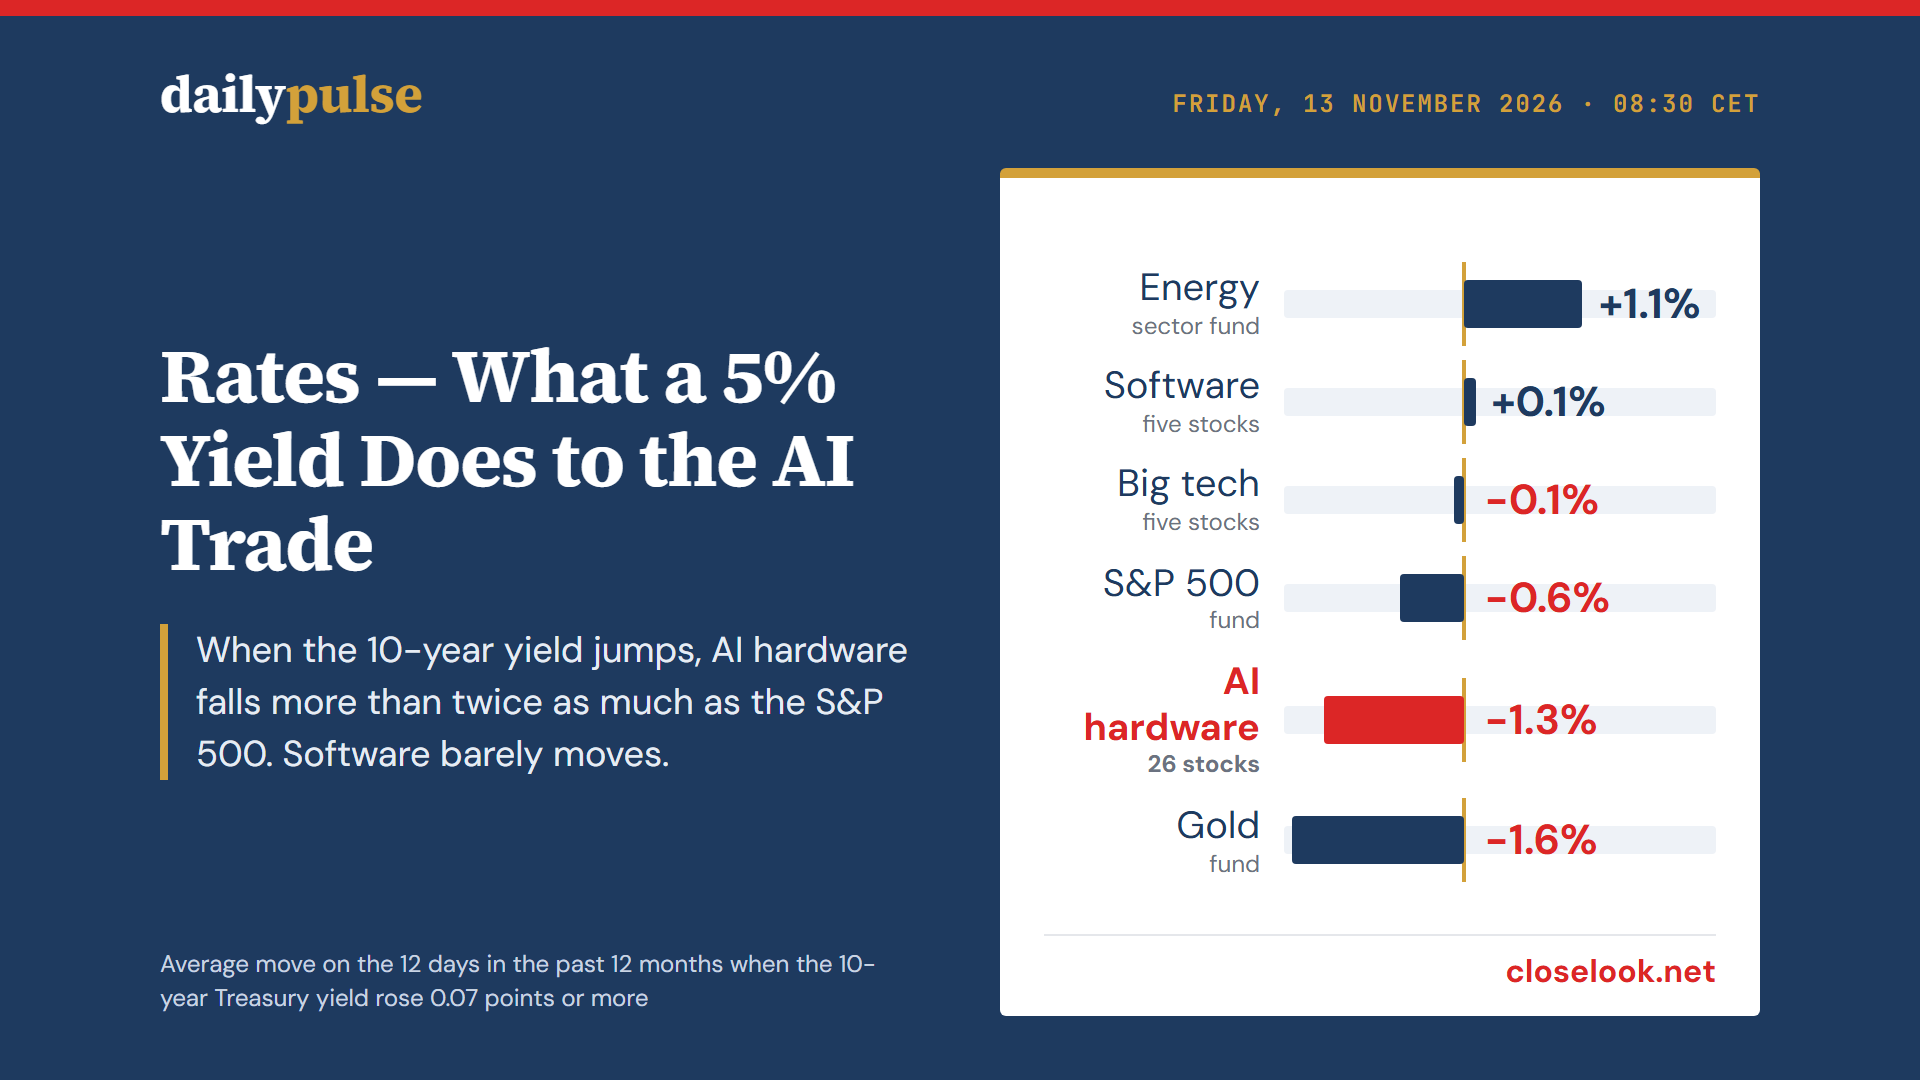
The 10-year Treasury yield closed at 5.10% on Thursday, above 5% for the first time since 28 October, and on Friday morning Asia's chip stocks gave up their early gains. What does a yield of 5% do to the AI trade? We went through the past twelve months, 252 trading days, and looked at two things: the 12 days on which the yield jumped, and the 23 days that began with it at 5% or more. On a day when the yield jumps, AI hardware loses more than twice as much as the S&P 500, while software and the largest technology companies barely react. And during the weeks above 5% the index held its level while AI hardware lost a fifth.
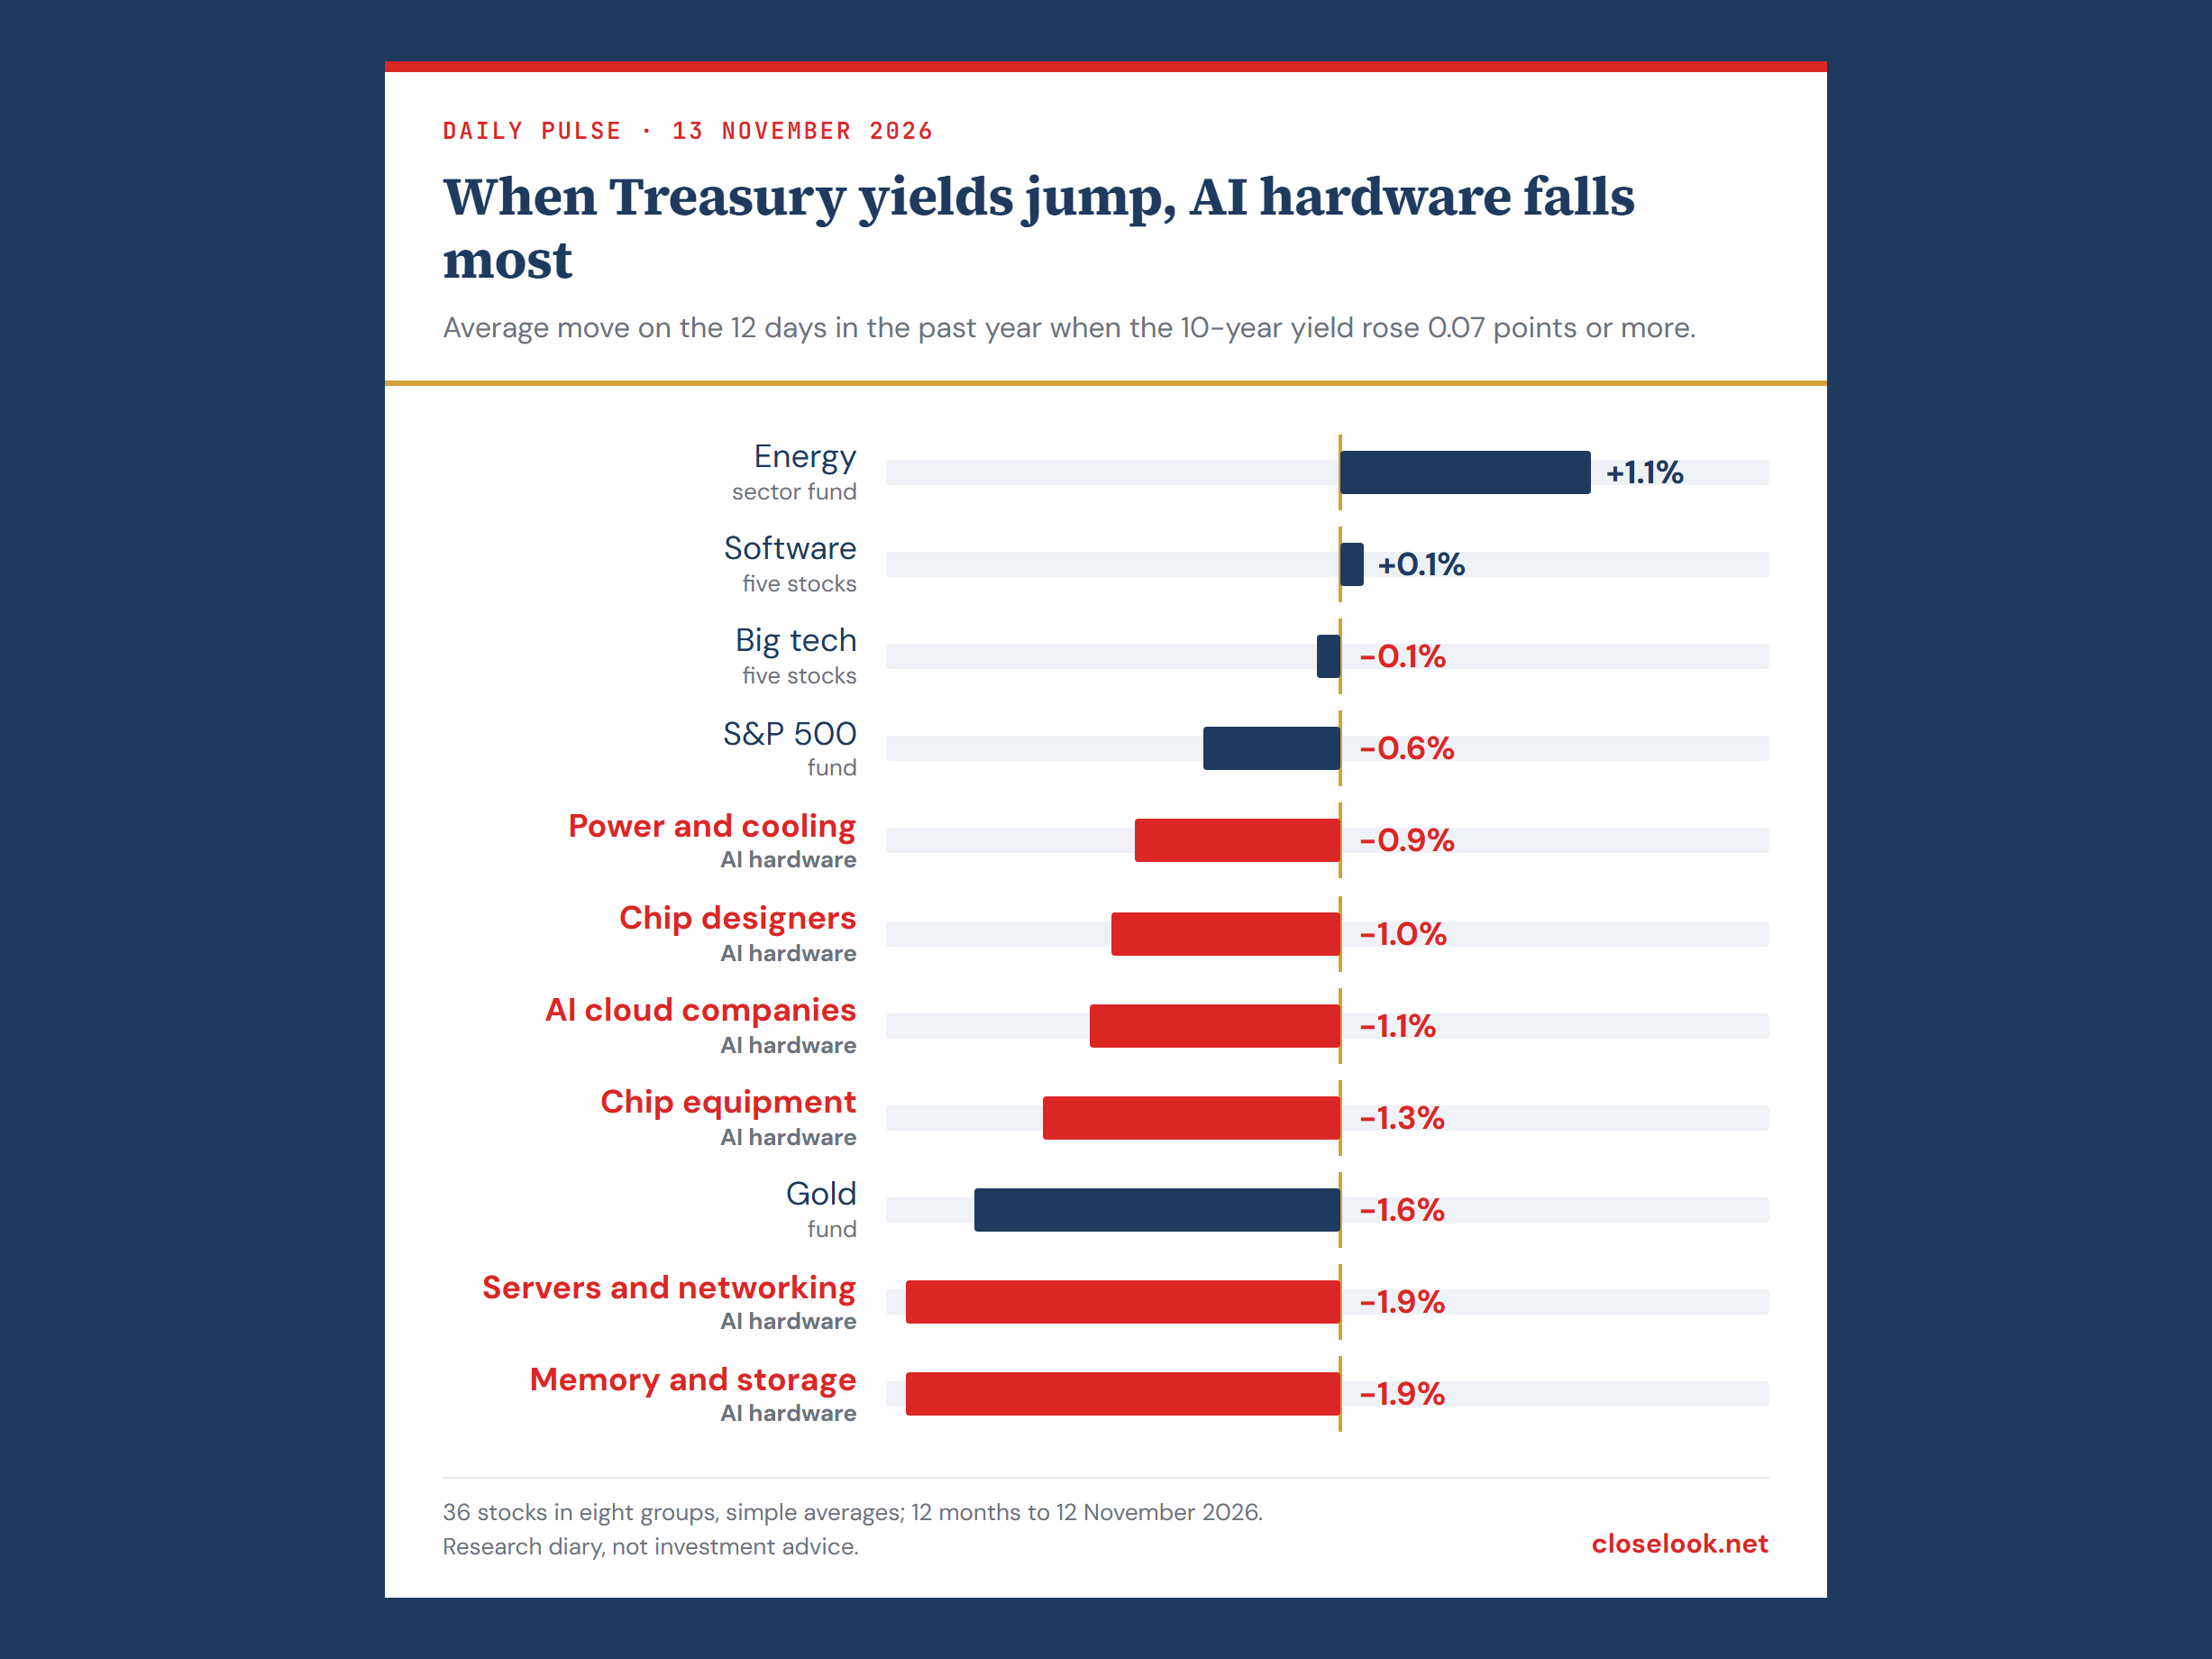
What a jump in yields does, group by group
We call it a jump when the 10-year yield rises by 0.07 percentage points or more in one day. That happened on 12 of the 252 trading days to 12 November. Tuesday and Thursday of this week were two of them.
For each of those days we took the move of 36 stocks in eight groups, each group a simple average of its members, and of a few funds for comparison.
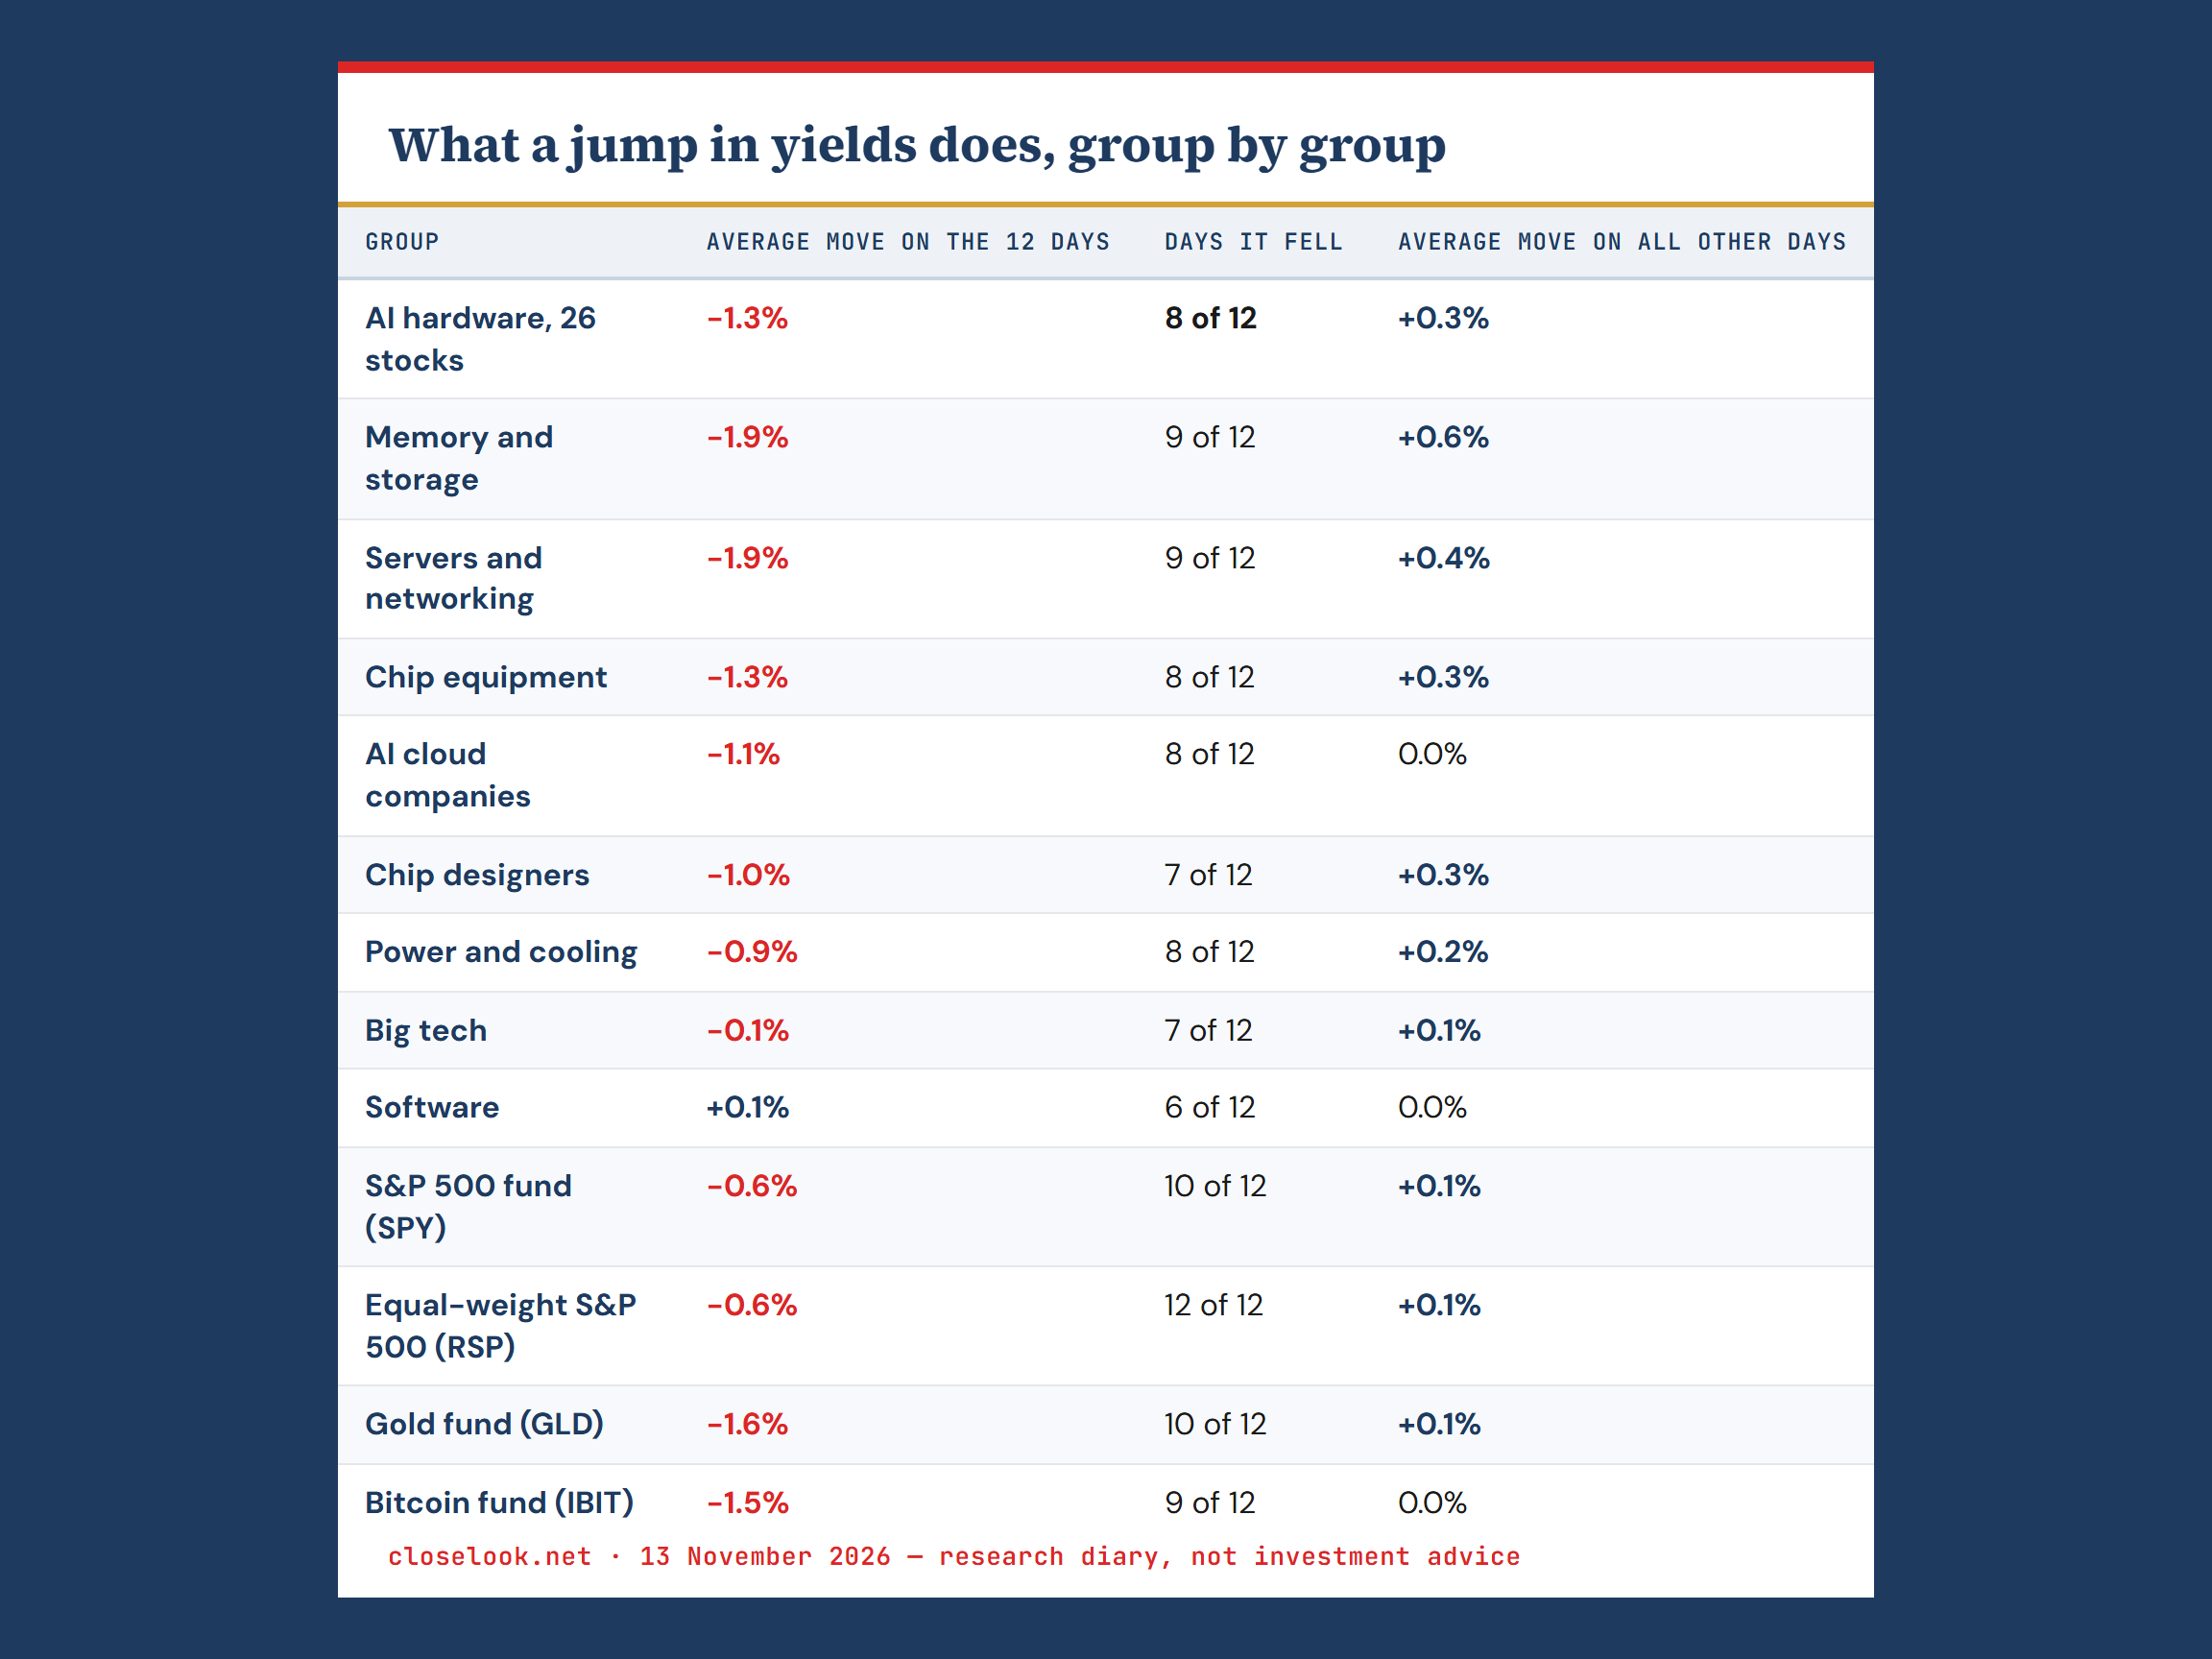
Table as text
| Group | Average move on the 12 days | Days it fell | Average move on all other days |
|---|---|---|---|
| AI hardware, 26 stocks | −1.3% | 8 of 12 | +0.3% |
| Memory and storage | −1.9% | 9 of 12 | +0.6% |
| Servers and networking | −1.9% | 9 of 12 | +0.4% |
| Chip equipment | −1.3% | 8 of 12 | +0.3% |
| AI cloud companies | −1.1% | 8 of 12 | 0.0% |
| Chip designers | −1.0% | 7 of 12 | +0.3% |
| Power and cooling | −0.9% | 8 of 12 | +0.2% |
| Big tech | −0.1% | 7 of 12 | +0.1% |
| Software | +0.1% | 6 of 12 | 0.0% |
| S&P 500 fund (SPY) | −0.6% | 10 of 12 | +0.1% |
| Equal-weight S&P 500 (RSP) | −0.6% | 12 of 12 | +0.1% |
| Gold fund (GLD) | −1.6% | 10 of 12 | +0.1% |
| Bitcoin fund (IBIT) | −1.5% | 9 of 12 | 0.0% |
AI hardware is 26 stocks, from chip designers to the companies that rent out computing power. On an average jump day it lost 1.3%. The S&P 500 fund lost 0.6%. Inside hardware, memory and the makers of servers and network gear fell most, 1.9% each.
Software rose 0.1% on those days and big tech lost 0.1%. They were the calm part of technology.
Three funds from outside technology show how broad a rates day is. The equal-weight S&P 500 fund fell on all 12 days and gold on 10. Energy went the other way: the sector fund XLE rose on 10 of the 12 days, by 1.1% on average.
The last column is the other half of the picture. On the other 240 days AI hardware gained 0.3% a day on average and memory 0.6%. These are the stocks that made the year, and they are the ones sold when rates jump.
Above 5%: the index held, AI hardware did not
The level matters as well as the jump. In this period the 10-year yield first closed above 5% on 16 September, reached 5.31% on 5 October and fell back under 5% on 22 October. In all, 23 trading days of the past year began with the yield at 5% or more. The table adds up what each group did on those 23 days, and on the other 229.
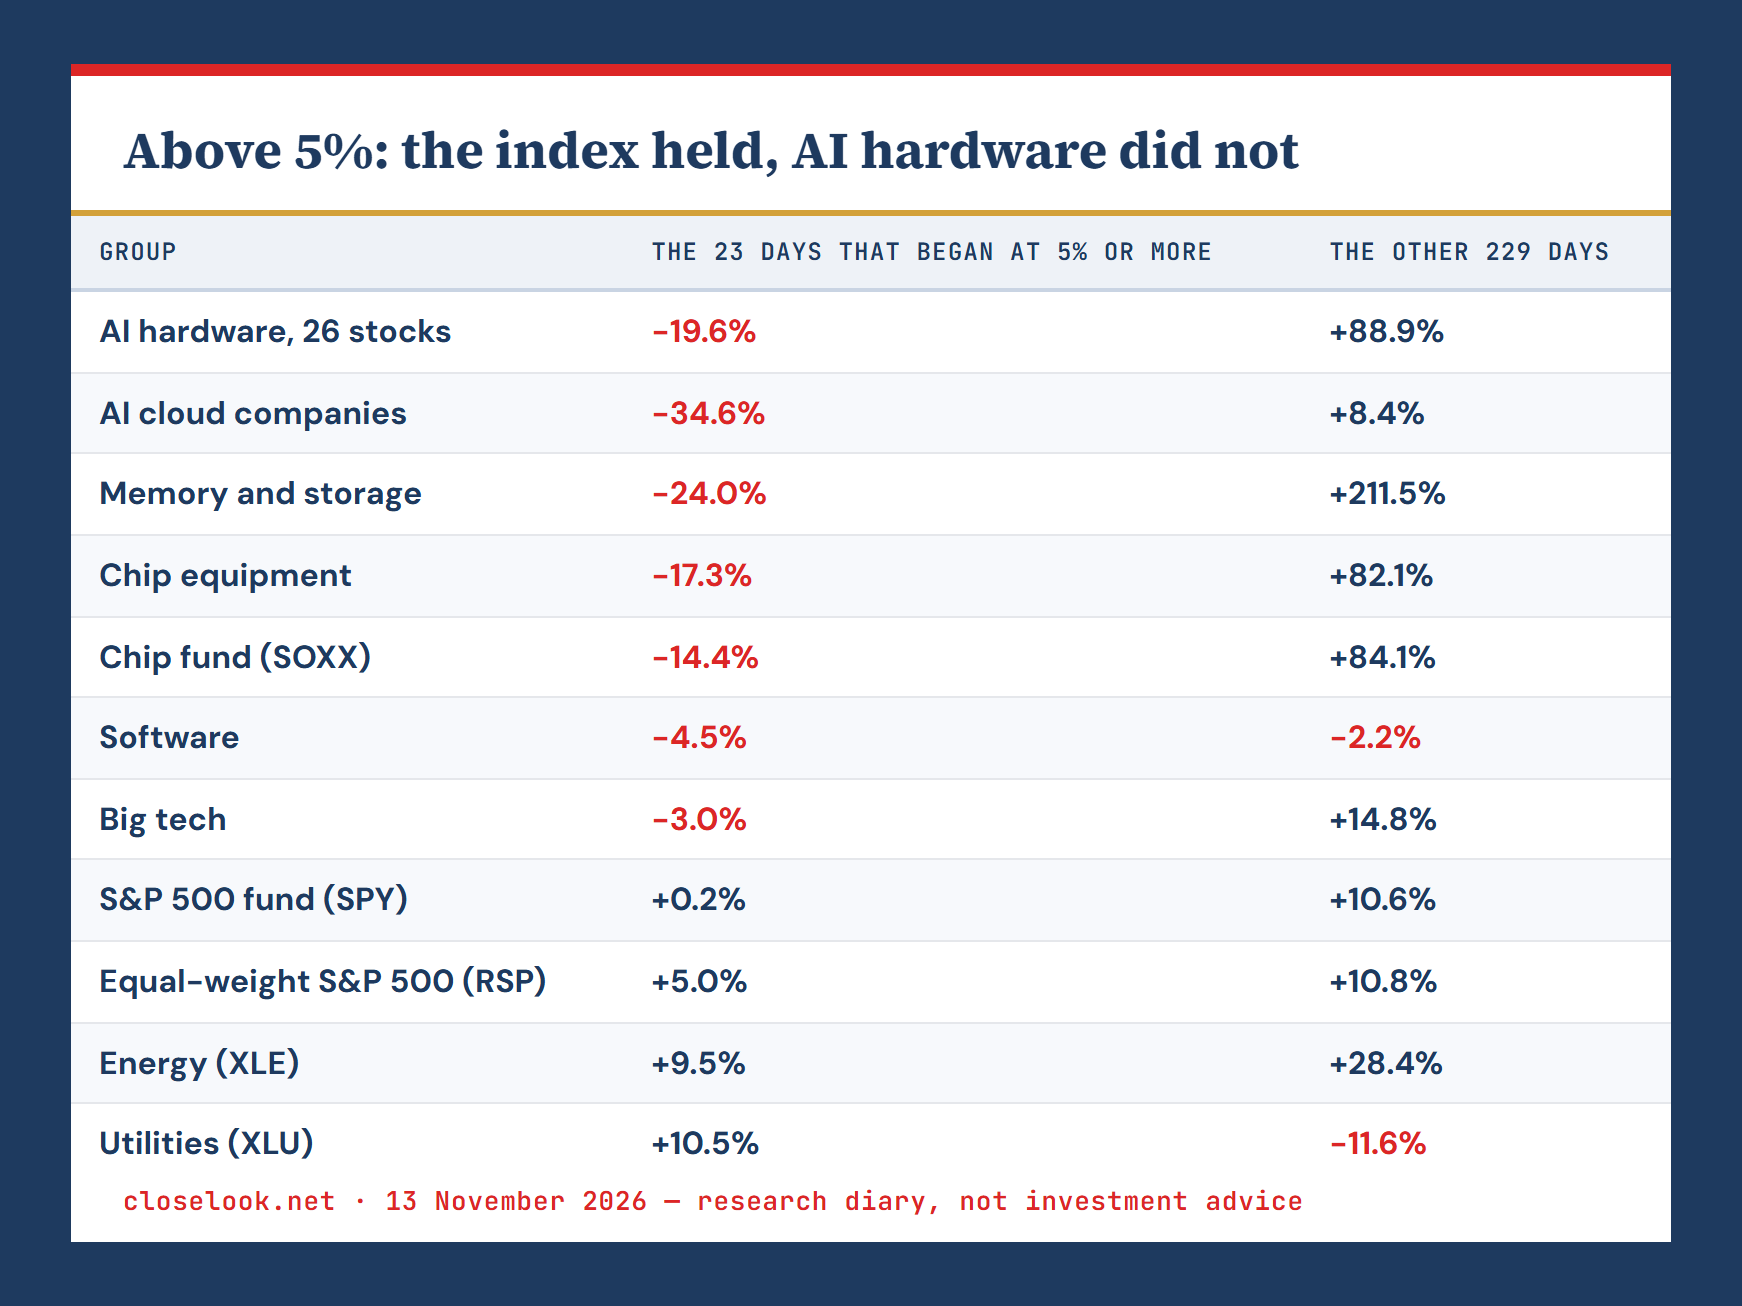
Table as text
| Group | The 23 days that began at 5% or more | The other 229 days |
|---|---|---|
| AI hardware, 26 stocks | −19.6% | +88.9% |
| AI cloud companies | −34.6% | +8.4% |
| Memory and storage | −24.0% | +211.5% |
| Chip equipment | −17.3% | +82.1% |
| Chip fund (SOXX) | −14.4% | +84.1% |
| Software | −4.5% | −2.2% |
| Big tech | −3.0% | +14.8% |
| S&P 500 fund (SPY) | +0.2% | +10.6% |
| Equal-weight S&P 500 (RSP) | +5.0% | +10.8% |
| Energy (XLE) | +9.5% | +28.4% |
| Utilities (XLU) | +10.5% | −11.6% |
Over those 23 days the S&P 500 fund ended where it began (+0.2%), and the equal-weight fund gained 5.0%. AI hardware lost 19.6%. The companies that rent out AI computing power lost 34.6% and memory 24.0%. Our Rubin 100 index of the AI build-out lost 15.1%.
Utilities gained 10.5% over the same days and energy 9.5%. A yield above 5% did not hurt the stock market as a whole this autumn. What it came with was money leaving the AI build-out for the rest of the market.
The right-hand column shows how much there was to take out. On the other 229 days AI hardware gained 88.9% and memory 211.5%.
C — free account
The free C account unlocks the full Daily Pulse — every section of this read.
One tap with Google or one email — no password, no card. You are signed in until you sign out, on this browser, from then on.
Join the Look — freeAlready joined on this browser? The full edition shows automatically — if it doesn't, sign in again here. Looking for the archive, portfolios and realtime? That is C+.
One more block on our desk — tomorrow's levels and what we're watching into the next session. Join the Look — it’s free.