Daily Pulse · · 09:30 CET · 4 min read · market · TLT


In this edition
Pattern alerts
- TLT 78.62-plus-0.4-off-52w-low-five-down-sessions-failed-bull-crosses BEARISH
- TLH minus-3.7-vs-50d-plus-0.4-off-52w-low BEARISH
- IEF minus-3.0-vs-50d-plus-0.3-off-52w-low BEARISH
- GLD 377.91-minus-3.94-rare-one-day-drop-no-income-asset WARNING
- NVDA 228.86-plus-1.68-growth-that-outruns-the-rate NEUTRAL
The long-bond fund TLT closed Monday at 78.62, down 0.88%, its fifth down session in a row and only 0.4% above its 52-week low. The 30-year Treasury yield closed at 5.561%, above Friday's 5.504%, which was already its highest close since 2004. On our chart this is a clear break, not a test of support, and it is not only an American story. Yields are rising in Tokyo and across Europe at the same time. That changes what works in stocks: when the rate used to value future profits keeps climbing, only companies whose earnings grow faster than their valuation shrinks can hold their price.
Three bond funds, one picture
The break is not confined to the longest bonds. The 10-20 year fund TLH and the 7-10 year fund IEF show the same state: below their 20-, 50- and 200-day averages and within half a percent of their 52-week lows.
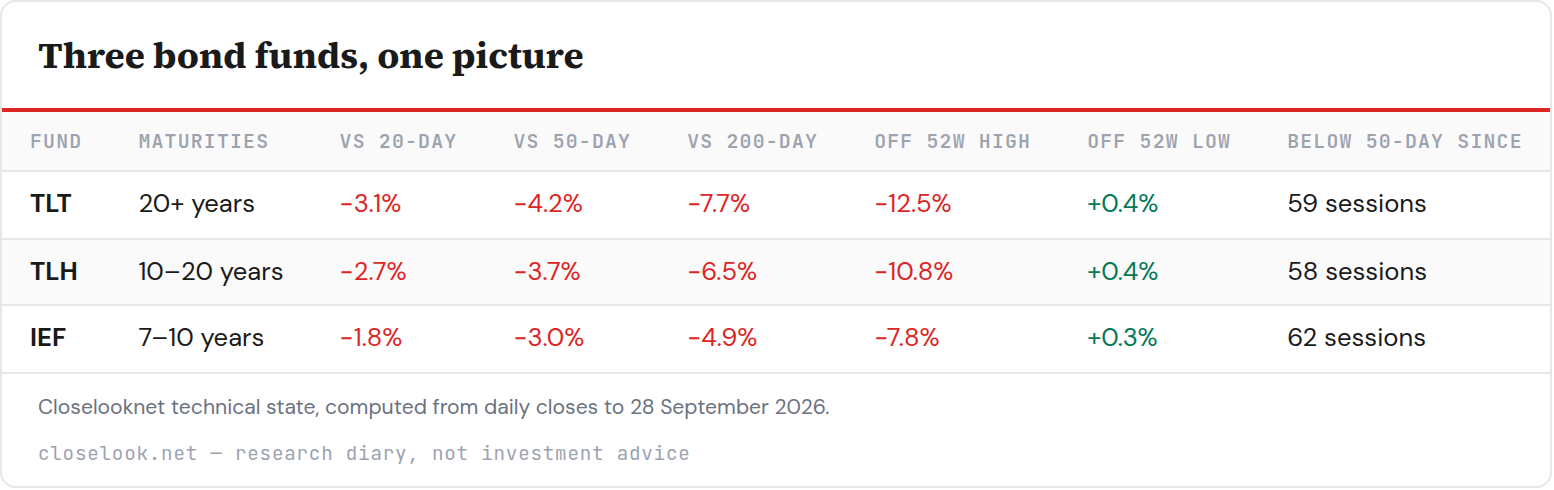
Table as text
| Fund | Maturities | vs 20-day | vs 50-day | vs 200-day | Off 52w high | Off 52w low | Below 50-day since |
|---|---|---|---|---|---|---|---|
| TLT | 20+ years | −3.1% | −4.2% | −7.7% | −12.5% | +0.4% | 59 sessions |
| TLH | 10–20 years | −2.7% | −3.7% | −6.5% | −10.8% | +0.4% | 58 sessions |
| IEF | 7–10 years | −1.8% | −3.0% | −4.9% | −7.8% | +0.3% | 62 sessions |
Closelooknet technical state, computed from daily closes to 28 September 2026.
All three have been below their 50-day average for about three months. Their stochastic readings - a measure of where the price sits inside its recent range - are at extreme lows (TLT %K 8.7) and have just turned up. In a strong trend that signal is weak evidence: the earlier bull crosses in this downtrend failed. A turn in the indicator is not yet a turn in price.
C — free account
The free C account unlocks the full Daily Pulse — every section of this read.
One tap with Google or one email — no password, no card. You are signed in until you sign out, on this browser, from then on.
Join the Look — freeAlready joined on this browser? The full edition shows automatically — if it doesn't, sign in again here. Looking for the archive, portfolios and realtime? That is C+.
One more block on our desk — tomorrow's levels and what we're watching into the next session. Join the Look — it’s free.