Daily Pulse · · 08:30 NY · 11 min read · market · VGK


In this edition
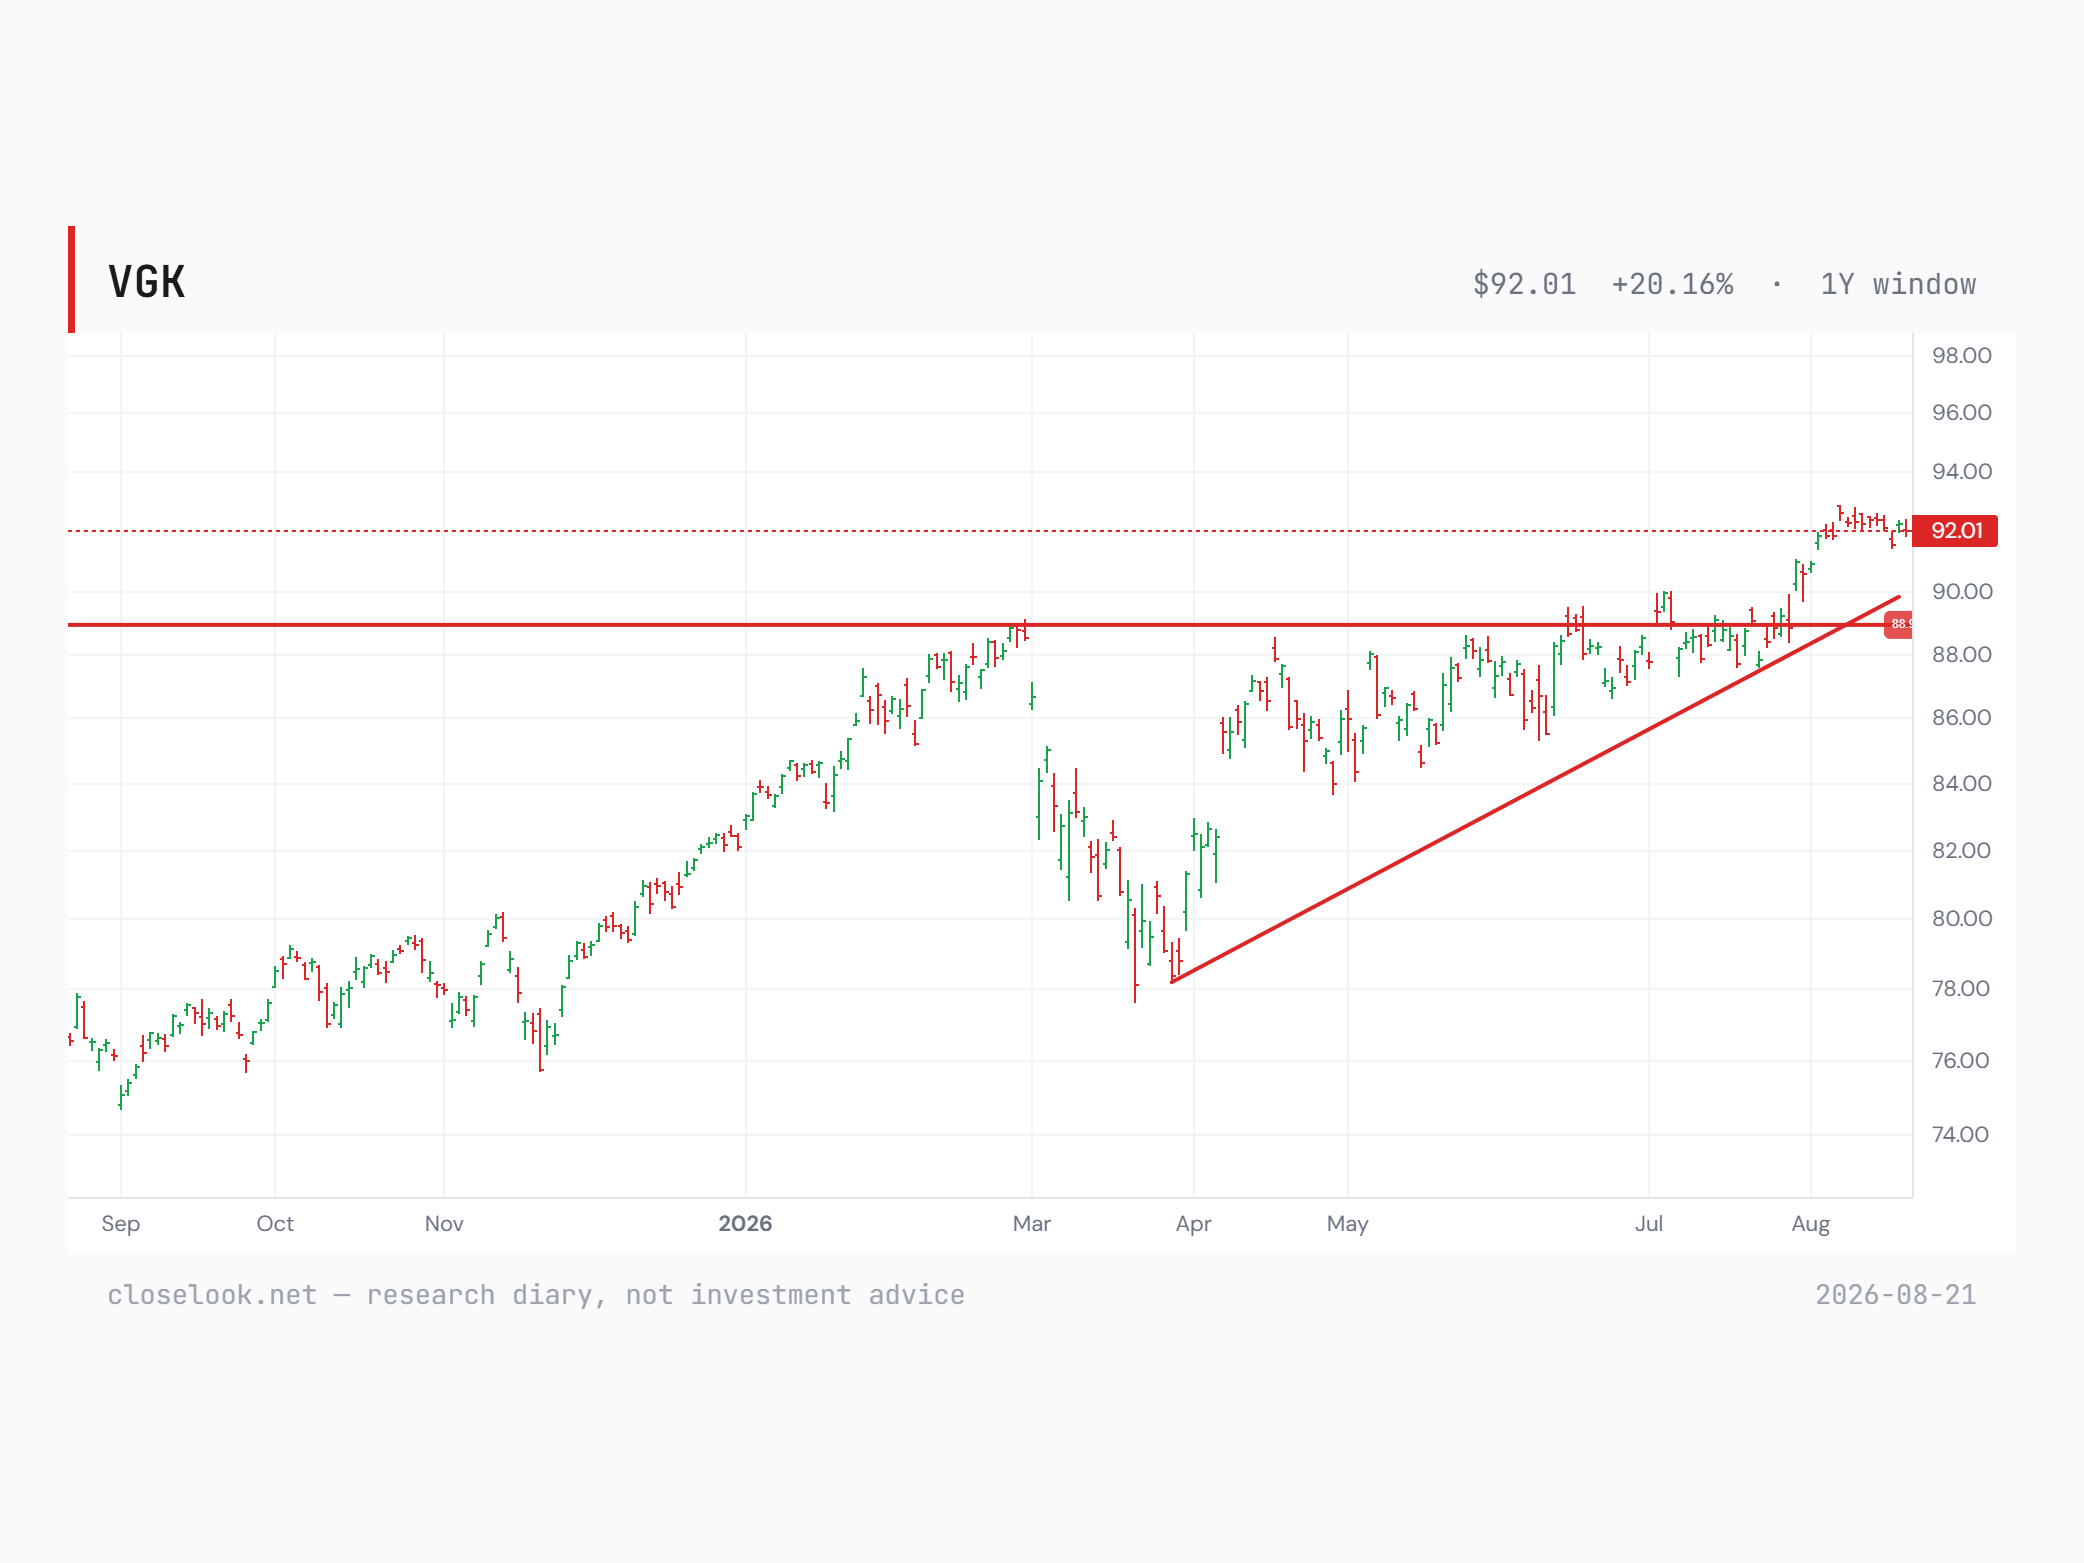
The chart we have up this morning is VGK, the Vanguard Europe fund, on a five-year window. It trades 92.01 in the premarket against yesterday's 92.23 close. The rising channel drawn from the late-2022 low near 40 is fully intact, price broke to new highs above the 88.9 shelf this summer, and the sessions since have been a consolidation sitting above the breakout zone rather than a return into it. On its own terms that is about as orderly as a four-year trend gets, and nothing on it records the sovereign debt problem building underneath. Benjamin Graham's old line is the one that fits: the stock market is a voting machine, the bond market is a weighing machine. This morning they disagree about Europe.
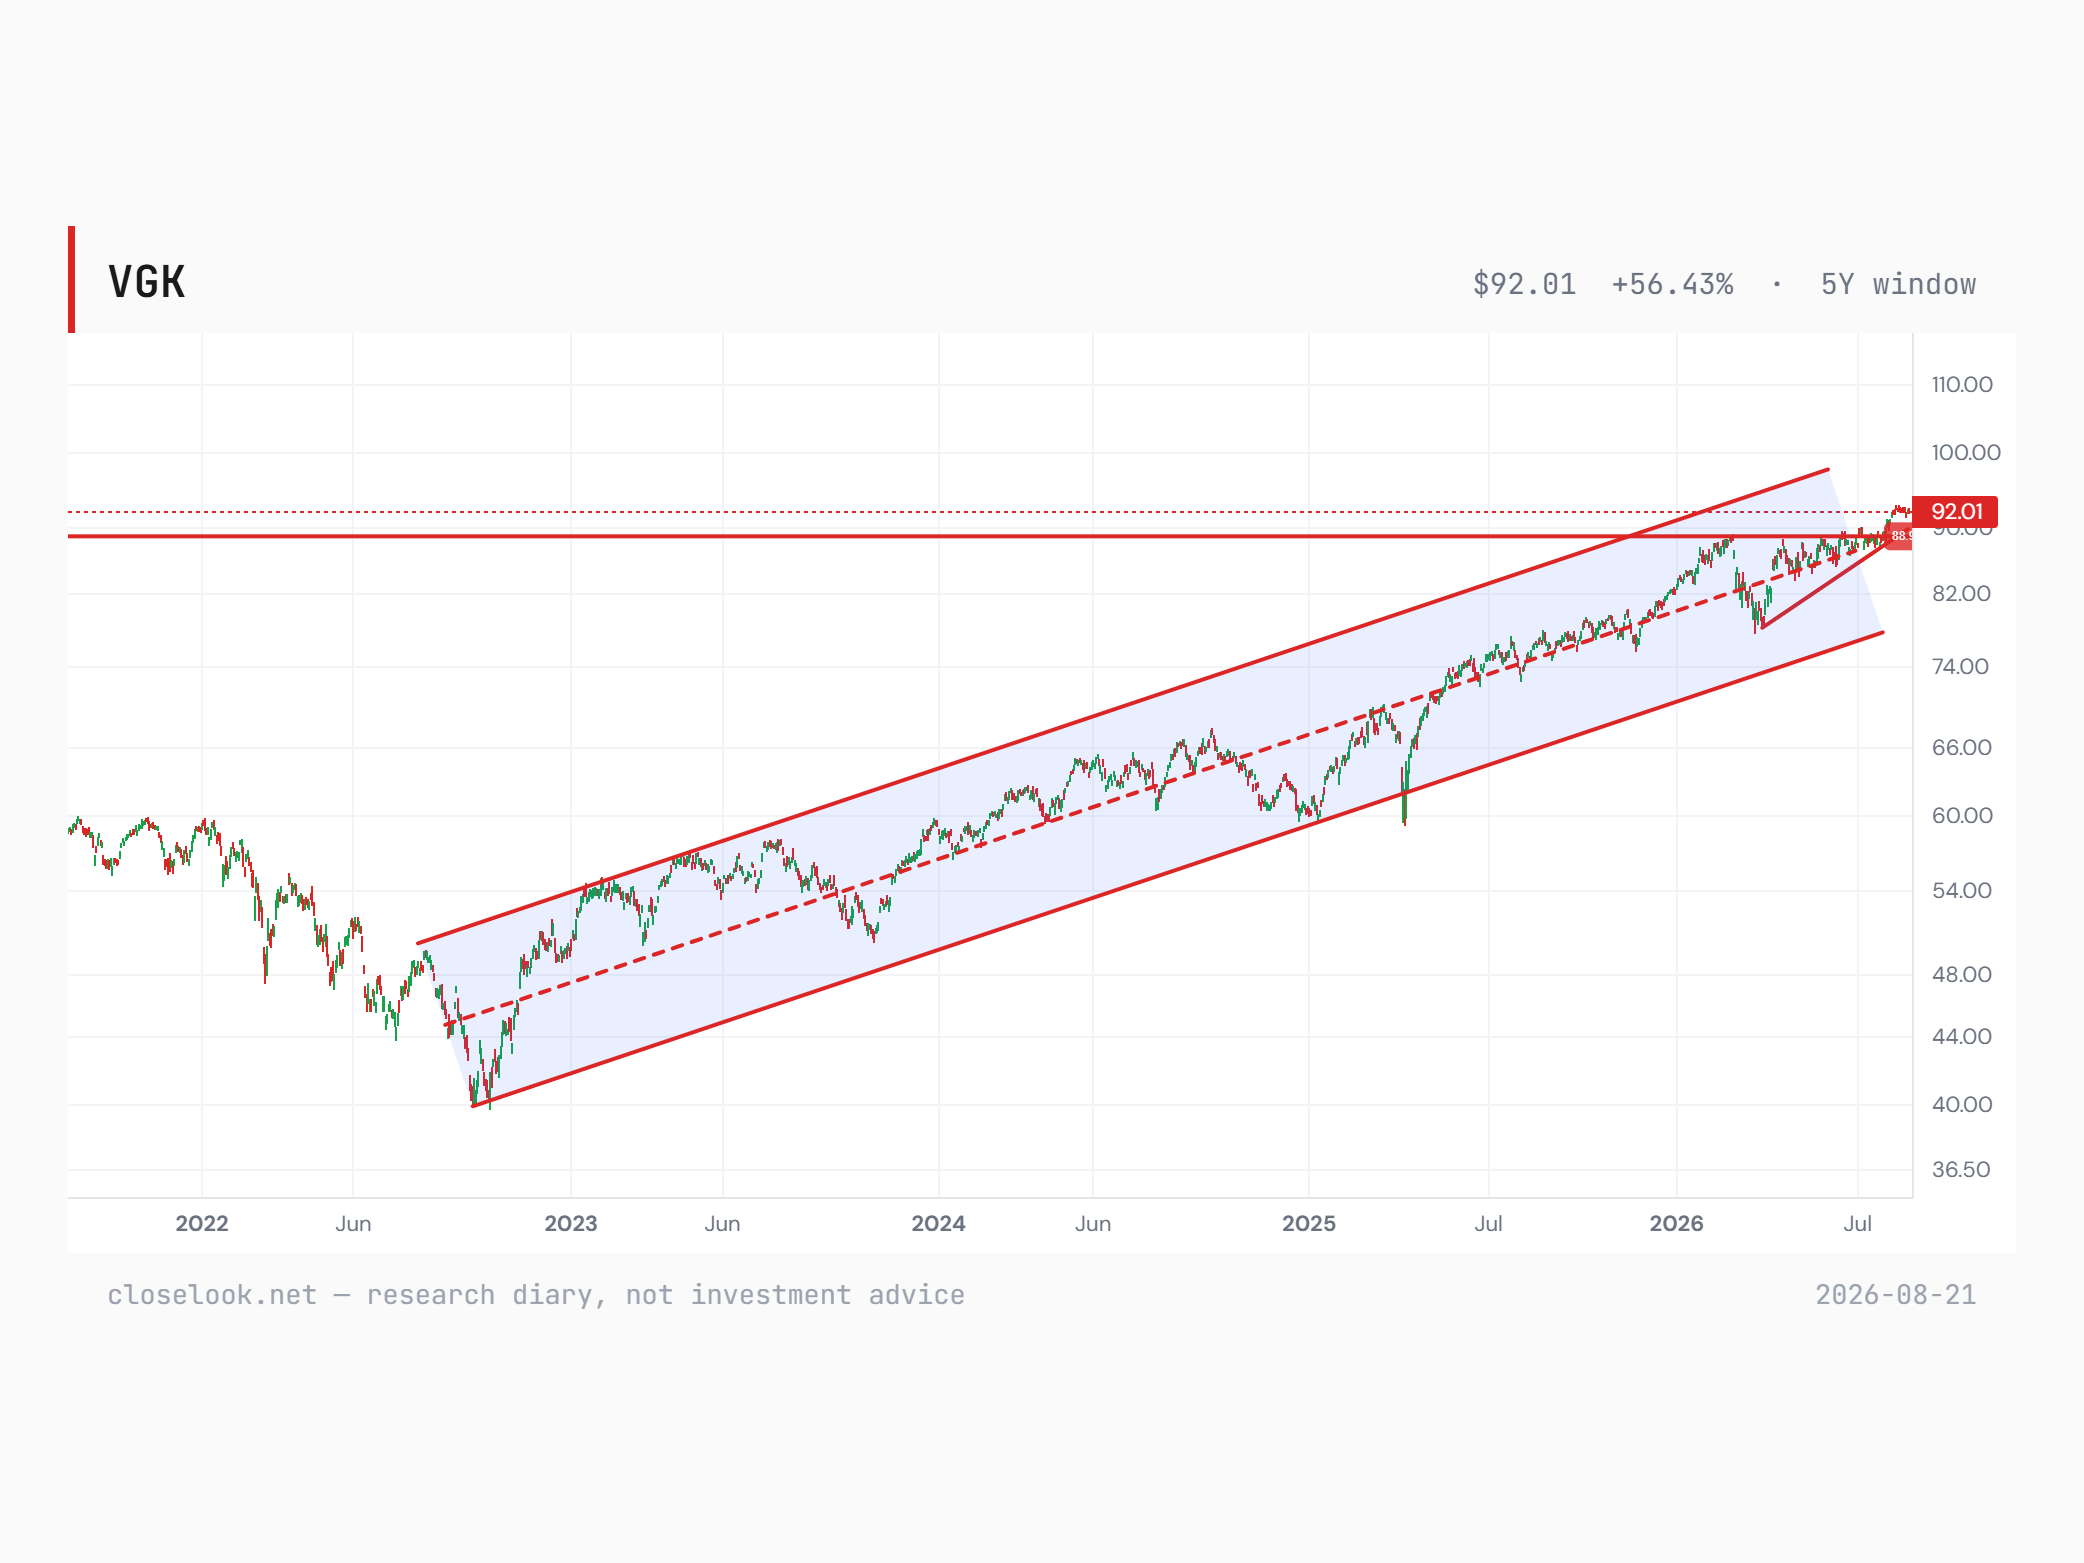
The vote is that chart. The weighing is the long end. And between them sits a third thing that most dollar-based holders of that chart have not seen at all — because for a week now Europe has been red in its own currency and flat in theirs.
CAC 40 8,453 · 7 red sessions · 5d −2.28%
IBEX 35 19,811 · 7 red · 5d −1.77%
Euro Stoxx 50 6,422 · 5 red · 5d −1.89%
DAX 25,983 · 4 red · 5d −1.20%
HEDJ (currency-hedged Europe) · 4 red · 5d −2.17%
VGK (USD, unhedged) · 1 red · 5d −0.40% · EWU 5d +0.58% · close-to-close through 2026-08-20
Those are close-to-close counts through yesterday's European finish. Seven consecutive red sessions in Paris, seven in Madrid, five on the Euro Stoxx 50, four in Frankfurt. HEDJ — the wrapper that strips the euro out and leaves the equities — is four red and −2.17% over five days, which is the local truth expressed in a US listing. Now the other side of the same week: VGK is −0.40% over five days with a red streak of one, and EWU, the UK fund, is actually up 0.58%. Same companies, opposite sign.
The difference is the euro, and the euro's strength is the dollar's weakness. EURUSD near 1.17 absorbed a week of local selling and handed dollar-based holders a flat tape while the underlying market bled. This is the house doctrine stated as plainly as it ever gets: a USD country fund is equity plus currency, and when the two legs move against each other the wrapper reports the net and says nothing about which leg did the work. Our country-flow ranking exists to hold those legs apart. Today that is not a methodological footnote. It is the story.
The weighing machine
Which brings us to the weighing machine, and to a board we are publishing for the first time this morning. Our new G7 sovereign pressure board reads the seven government curves as one instrument and scores the pressure sitting on them.
Sovereign Pressure Index +0.92 (21 sessions ago 1.48 · window max 2.31) · pressure building
z-slope +2.2 · z30 +1.2 · z10 +0.23
G7 10-year 4.015% (+8bp over 21 sessions) · G7 30-year 4.745% (+19bp) · 10s30s 73bp
Pressure building, and the components name the leader without ambiguity. The slope z-score is +2.2 and the 30-year z-score +1.2, while the 10-year z-score is only +0.23. That is a long end leading a curve, not a front end leading a policy repricing — term premium and fiscal supply rather than rate expectations. The index at +0.92 sits below the 1.48 of twenty-one sessions ago and well under the 2.31 window maximum, so the level is not an extreme and we are not going to dress it up as one. It is the direction of the components that carries the weight.
France 10y 4.11% · Italy 10y 4.06% · Germany 10y 3.27%
UK 10y 5.07% · UK 30y 5.80%
US 10y 4.702% · US 30y 5.244% · Japan 30y 4.07%
Two of those rows deserve to be read out loud. France's 10-year at 4.11% now trades above Italy's at 4.06% — the risk ranking that held for the whole post-crisis era, inverted, without an announcement. And Britain pays 5.07% at ten years and 5.80% at thirty. Germany at 3.27% is the anchor the bloc is measured against, and the spread from Berlin to Paris has quietly stopped being a periphery story and become a core one. The VGK chart contains every one of these countries and shows none of it.
Two bond markets to watch from here, and they are not the two the headlines pick. France is the first: the 10-year through Italy's, and seven straight red sessions in Paris equities underneath it. Those are one repricing seen from two windows — the market adjusting its view of France's position rather than of Europe's. Japan is the second: the 30-year at 4.07% is the highest of the era, and the yen at 158.82 sits against the wires we have carried since Wednesday. A long end at generational highs and a currency at levels that have drawn official attention before is a combination that resolves somewhere.
C — free account
The free C account unlocks the full Daily Pulse — every section of this read.
One tap with Google or one email — no password, no card. You are signed in until you sign out, on this browser, from then on.
Join the Look — freeAlready joined on this browser? The full edition shows automatically — if it doesn't, sign in again here. Looking for the archive, portfolios and realtime? That is C+.