—

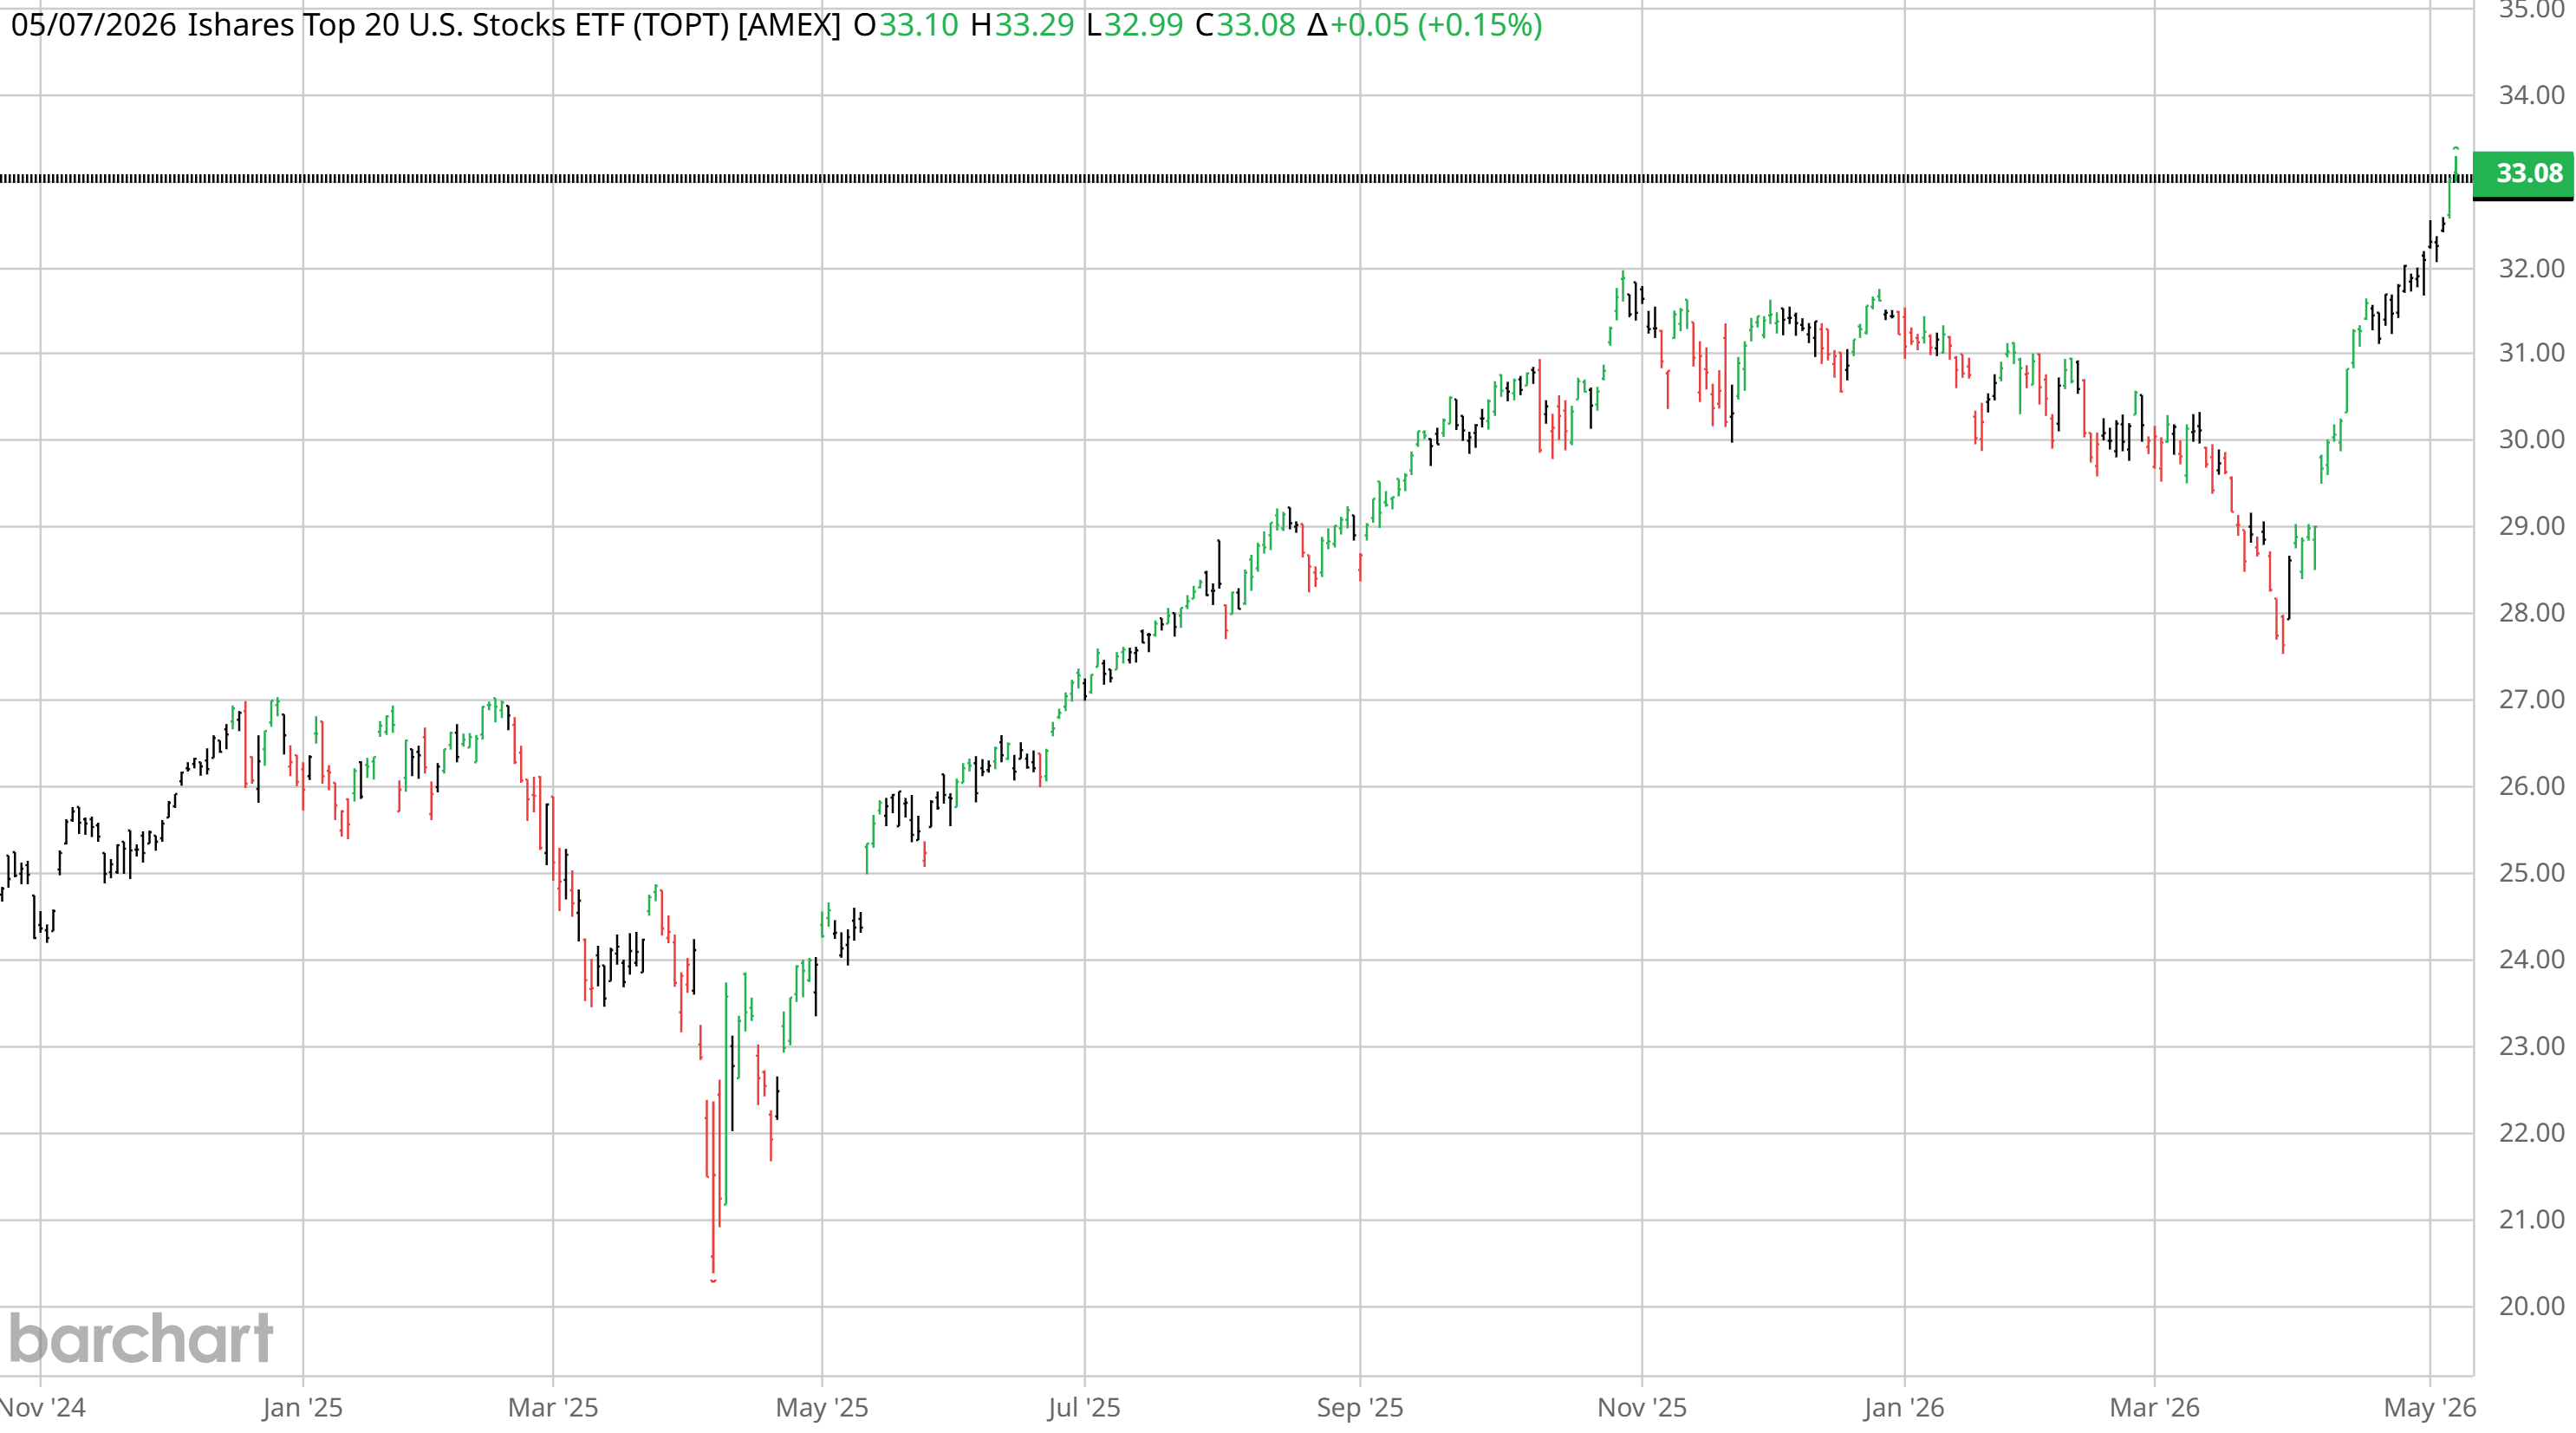
iShares Top 20 U.S. Stocks ETF (TOPT) — chart, structure and Closelooknet read

Pick a ticker to load its detail page.

The desk on TOPT

What this diary said about iShares Top 20 U.S. Stocks ETF, what it holds and what would change its view — in its own words, dated. Investment diary, not advice.

What we said

What we hold

BookPositionSinceResult
Global ETFs 603.95 shares · average entry $25.79 — +37.0%

Model books as of 25 Sept 2026; wikifolio positions from the official wikifolio data, entries in euros. Results are unrealised, before any exit. A record of what the diary does, not a recommendation to do the same.

Charts from the desk on TOPT

The charts this diary drew or picked on iShares Top 20 U.S. Stocks ETF, as published — each dated and linked to the piece that explains it.

Signals for this name

Every Closelooknet reading that exists for TOPT, from the same nightly bakes the boards use. Research diary readings, not advice.

Mentioned on Closelooknet 4 pieces · newest: Midday 10, “Chips up, software down: Nvidia leads a split rebound while the bond market catches its breath” (2026-09-02)

Mentioned on Closelooknet

Where TOPT appears in the diary — 4 pieces, newest first. Every link is our own writing.

Long reads

Dailies

Weather around the name 3 macro readings: Money Temperature, Factor regime, Sovereign pressure

The weather around this name

Macro readings that apply by membership — the regime, the factor tape, the sector cell, the funding backdrop.

  • Money Temperature Composite 62/100 · S&P 500 fund at 67, bullish alignedEight instruments scored on position, momentum, volume, volatility and fragility — the regime every name trades inside. Temperature lab → 2026-09-25
  • Factor regime Momentum leading — risk appetite buildingMomentum against low volatility (SPMO / SPLV): above its 50-day trend, 99th percentile of the window, +8.4% over 20 sessions. Factor regime → 2026-09-25
  • Sovereign pressure Index 0.61 · up 0.29 over 21 sessionsG7 long-end yields, 10s30s and the slope — the funding weather for every balance sheet on this site. Sovereign pressure → 2026-09-25
How it trades on rate days beta 0.33 to TLT · on the worst bond days it moved with the market

How it trades on rate days

How TOPT has moved when long-dated Treasury yields rise — measured against TLT, the 20+ year Treasury fund.

  • Beta to long bonds, 1 year 0.33 — tends to move with bonds for every 1% move in TLT (20+ year Treasuries), iShares Top 20 U.S. Stocks ETF moved 0.33% on average · correlation 0.20 · higher than 32% of US names
  • Beta, last 3 months 0.54 more rate-sensitive lately than over the year
  • On the 10 worst bond days −0.65% on average against −0.74% for the S&P 500 the 10 sessions of the past year in which TLT fell most, i.e. long yields rose most
  • Latest of those days +0.43% TLT −1.29% that day 2026-09-24

Daily total returns from the adjusted price series; a TLT down day is a day long yields rose. Beta = the average move of the name for a 1% move in TLT. Past sensitivity, not a forecast. An investment diary, not a recommendation.

Company snapshot — iShares Top 20 U.S. Stocks ETF

TOPT in five paragraphs: what it makes and sells, where it sits in the Closelooknet stack, who it is priced against, why we track it, what we watch. Research diary, not advice.

What it does
TOPT is an index fund that holds the twenty largest US companies, drawn from the S&P 500 and weighted by float-adjusted market value, with a cap on any single name's weight. It tracks a specific S&P Dow Jones cut of the largest-cap segment rather than picking stocks itself, and because it holds only twenty names it is non-diversified, so its return leans heavily on those few holdings.
Where it sits in the stack
TOPT carries no seat in our Rubin AI build-out index; it sits outside the layered stack entirely, in the general market-benchmark sleeve the diary uses to check how mega-cap concentration performs, rather than as a claim on any single layer of the build-out.
Who it is priced against
The diary has not set a formal peer group for TOPT; instead it is read alongside other index cuts it publishes on — QQXT (Nasdaq-100 ex-Tech), QQQE (equal-weight Nasdaq-100), QTOP (Nasdaq-100 Top 30) and QTEC (Nasdaq-100 Tech) — to see how the twenty largest US stocks trade against narrower or broader slices of the same market.
Why Closelooknet tracks it
TOPT carries no Rubin or Halo index seat and no Closelooknet score; it appears across the Weekly Signal, Heresy and Midday 10 editions as a benchmark for how concentration in the very largest US stocks moves relative to other cuts of the market.
What the diary watches
The diary watches whether returns keep concentrating in the same handful of largest names, since a fund weighted this way stops tracking the broad market once a few stocks drive most of the gain.

iShares Top 20 U.S. Stocks ETF (TOPT) trades on US exchanges.

Written from the company’s public profile and Closelooknet’s own readings, 2026-09-17. Descriptive, refreshed with the registry; corrections welcome via the imprint. closelook.net is an investment research diary — market structure, index membership and scores are our own readings, not investment advice. Related: index compare · sector dispersion · scanner.

Dividends and capital return trailing yield 0.35%, quarterly · last 0.0280 USD on 2026-09-15

Dividends and capital return

What TOPT pays out and buys back — distributions read from the price series, money terms from the filings.

  • Trailing 12 months 0.12 USD per share · a 0.35% yield on the 2026-09-25 close 4 distributions, paid quarterly 2026-09-25
  • Change on the year +17.2% against the prior twelve months prior twelve months 0.11 USD per share
  • Last distribution 0.0280 USD per share as the price series records it, within days of the ex-date 2026-09-15
  • By calendar year 2024: 0.0199 USD (partial) · 2025: 0.12 USD · 2026: 0.0920 USD to date first distribution recorded in the three-year window: 2024-12-17

Per-share amounts are derived from the adjusted price series in the listing currency, so dates sit within days of the ex-date; filing figures come from the fundamentals feed for the last reported fiscal year. An investment diary, not a recommendation.

FAQ · from the current data · as of 2026-09-26

Quick answers

What is iShares Top 20 U.S. Stocks ETF (TOPT)?

iShares Top 20 U.S. Stocks ETF is an exchange-traded fund trading as TOPT on the US exchange and is one of the benchmark ETFs Closelooknet tracks as a market reference, as of the registry build of 2026-09-26.

How does Closelooknet use TOPT?

As a benchmark: the daily editions, the sector dispersion board and the index dashboards quote iShares Top 20 U.S. Stocks ETF as a market reference, and this page matches the fund's largest holdings against the names Closelooknet covers so a reader can move from the fund to the companies inside it.

Where does TOPT trade against its moving averages?

Uptrend stack intact: Trades +5% vs the 50-day and +10.5% vs the 200-day average, 0.2% below the 52-week high and +28.3% off the 52-week low. Computed from daily closes. As of 2026-09-25 — a technical state from the nightly Closelooknet bake, not advice. The Technical tab carries the full row.

How does iShares Top 20 U.S. Stocks ETF trade when bond yields rise?

Over the past year iShares Top 20 U.S. Stocks ETF had a beta of 0.33 to TLT, the long-dated Treasury fund — it tends to move with bonds, higher than 32% of US names. On the 10 sessions in which long bonds fell most it moved −0.65% on average, against −0.74% for the S&P 500. The "How it trades on rate days" block on this page carries the lines.

Where has Closelooknet written about iShares Top 20 U.S. Stocks ETF?

iShares Top 20 U.S. Stocks ETF appears in 4 Closelooknet pieces, most recently Midday 10: Chips up, software down: Nvidia leads a split rebound while the bond market catches its breath (2026-09-02); Daily Pulse: One Core, Three Countries: The Global ETF Book Rebuilt (2026-07-11); Weekly Signal: Software vs Semis — The Tape Split in Two (2026-07-05). What Closelooknet said most recently: The 20 largest US stocks (TOPT) are +1.0%, so size and chips are being bought, expensive software sold. (Midday 10, 2026-09-02). The "Mentioned on Closelooknet" block on this page lists the long reads, the reference entries and the dailies that name it.

Does Closelooknet hold iShares Top 20 U.S. Stocks ETF?

Yes — Global ETFs: 603.95 shares · average entry $25.79, +37.0% unrealised. A record of what the diary does, not a recommendation to do the same.

What does iShares Top 20 U.S. Stocks ETF do?

TOPT is an index fund that holds the twenty largest US companies, drawn from the S&P 500 and weighted by float-adjusted market value, with a cap on any single name's weight. It tracks a specific S&P Dow Jones cut of the largest-cap segment rather than picking stocks itself, and because it holds only twenty names it is non-diversified, so its return leans heavily on those few holdings. The diary has not set a formal peer group for TOPT; instead it is read alongside other index cuts it publishes on — QQXT (Nasdaq-100 ex-Tech), QQQE (equal-weight Nasdaq-100), QTOP (Nasdaq-100 Top 30) and QTEC (Nasdaq-100 Tech) — to see how the twenty largest US stocks trade against narrower or broader slices of the same market.

Where does iShares Top 20 U.S. Stocks ETF sit in the AI build-out?

TOPT carries no seat in our Rubin AI build-out index; it sits outside the layered stack entirely, in the general market-benchmark sleeve the diary uses to check how mega-cap concentration performs, rather than as a claim on any single layer of the build-out. TOPT carries no Rubin or Halo index seat and no Closelooknet score; it appears across the Weekly Signal, Heresy and Midday 10 editions as a benchmark for how concentration in the very largest US stocks moves relative to other cuts of the market.

Does iShares Top 20 U.S. Stocks ETF pay a dividend?

iShares Top 20 U.S. Stocks ETF has paid 0.12 USD per share over the last twelve months, paid quarterly, a trailing yield of 0.35% on the 2026-09-25 close; the last distribution recorded in the price series was 0.0280 USD on 2026-09-15. The "Dividends and capital return" block on this page carries the lines.

What does this page show?

A live price chart with SMA overlays and drawing tools for TOPT, fund basics and the top holdings by weight with the Closelooknet names among them marked, the technical state where the data exists, and the research diary mentions — an investment research diary view, not investment advice.