Heresy · 08:30 NY
Don't Buy U.S. Stocks — Closelook Heresy
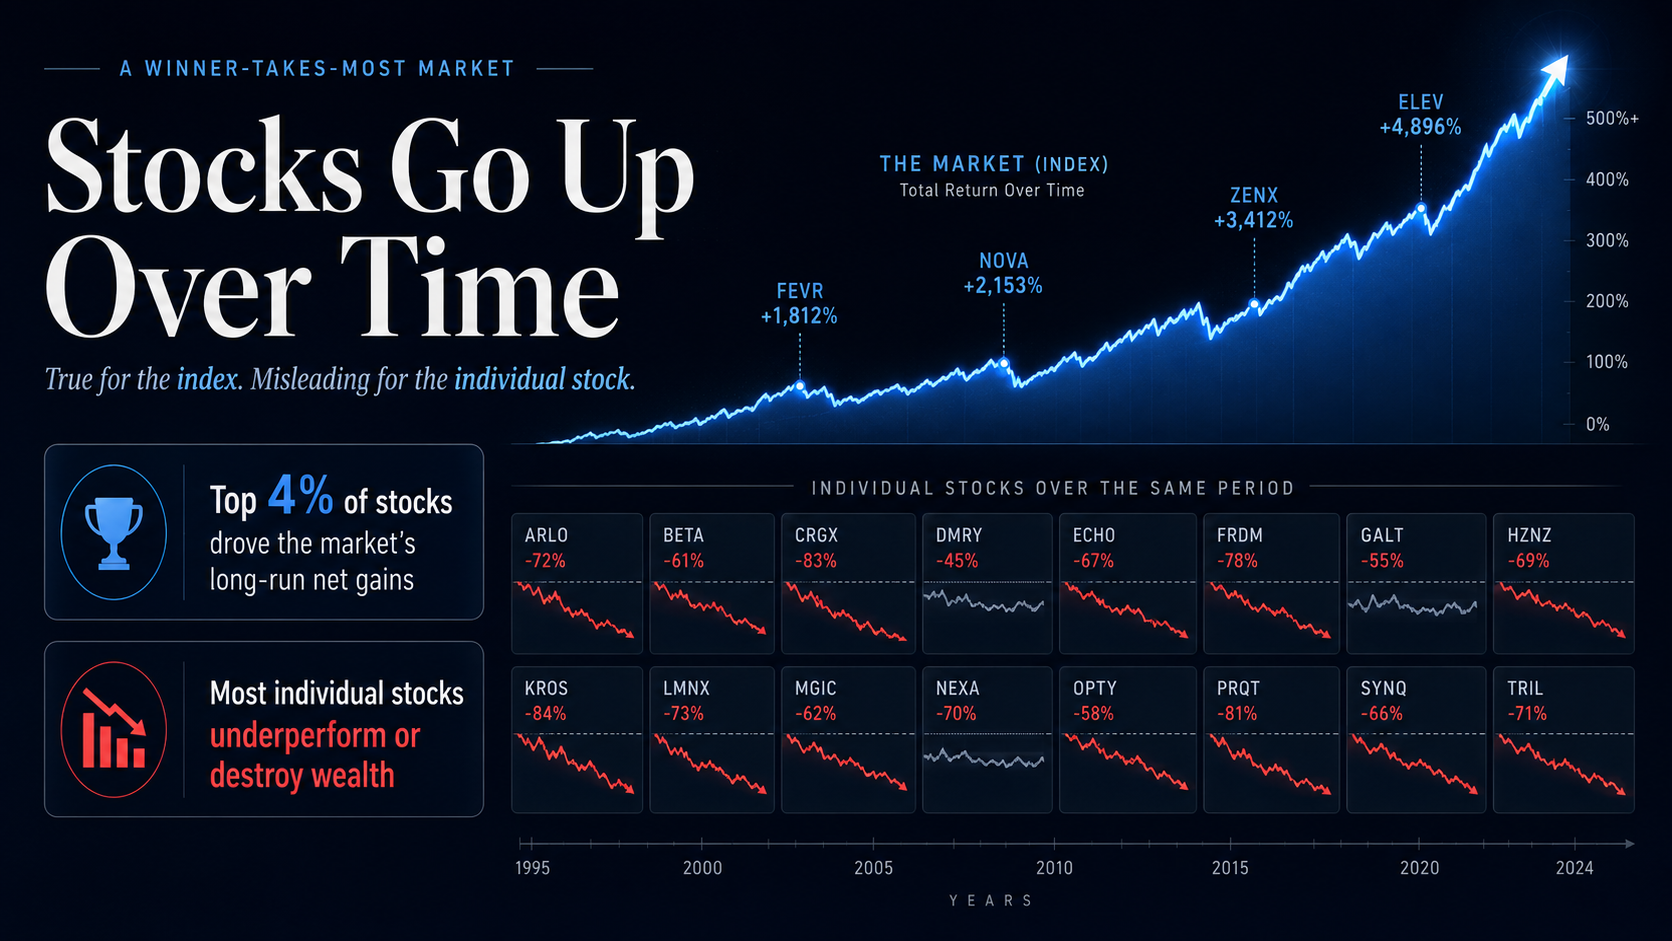
Why “stocks go up over time” is true for the index and dangerously misleading for the individual ticker.
Most investors grow up hearing one simple sentence: “Stocks go up over time.” That statement is true — but only if we are talking about the market as a whole. It is not true for most individual stocks. That difference is everything.
The U.S. stock market has created extraordinary wealth over the last century, but the wealth creation has not been evenly distributed. It has been driven by a surprisingly small number of exceptional companies, while the majority of listed stocks have either underperformed safe cash-like assets, underperformed the market, or lost money outright.
The U.S. stock market is not a democracy. It is a winner-takes-most system.
And if you buy individual U.S. stocks without understanding that, you are playing a very different game from the one you think you are playing.
The uncomfortable truth: most stocks are not long-term winners
Hendrik Bessembinder’s research is among the most important pieces of evidence that every stock picker should understand.
In his 2018 paper, Do Stocks Outperform Treasury Bills?, Bessembinder studied common stocks in the CRSP database going back to 1926. His finding was blunt: four out of every seven common stocks had lifetime buy-and-hold returns below one-month Treasury bills, and the best-performing 4% of listed companies explained the net gain of the entire U.S. stock market since 1926. The rest, collectively, matched Treasury bills.
That means the stock market’s long-term success does not come from “most companies doing well.” It comes from a small number of companies doing exceptionally well.
Bessembinder’s 2023 update (Shareholder Wealth Enhancement, 1926 to 2022) sharpened every one of these numbers. U.S. public stocks created $55.11 trillion in aggregate shareholder wealth between 1926 and 2022, even while 58.6% of the 28,114 individual stocks in the sample reduced rather than increased shareholder wealth — destroying $9.11 trillion in the process.
Inside the winning side, the concentration is brutal:
- Just 72 firms — about 0.26% of the universe — explain HALF of the entire $55 trillion in net wealth created since 1926. That number was 90 firms as of 2016 and 83 as of 2019; the concentration is accelerating, not normalising.
- The top three firms alone account for over 10% of all U.S. shareholder wealth ever created. As of 2022 those three were Apple ($2.68T), Microsoft ($2.09T), and Exxon Mobil ($1.22T), with Alphabet ($1.00T) and Amazon ($764B) rounding out the top five.
- Just 966 firms — 3.4% of the universe — account for 100% of the $55T in net wealth. The other 27,148 firms collectively net to zero. They cancel each other out — every dollar of value one created was destroyed by another.
Put differently: the median U.S. stock since 1926 has lost money in real terms. The market average is positive only because a handful of names did extraordinary work. Or, in Bessembinder’s own words from the 2023 paper: “the degree to which shareholder wealth creation is concentrated in relatively few firms is not only striking, but continues to increase in recent years.”
The same pattern shows up globally. Bessembinder’s global evidence found that, from 1991 to 2020, 55.2% of U.S. stocks and 57.4% of non-U.S. stocks underperformed one-month U.S. Treasury bills, while the top-performing 2.4% of firms accounted for all of the net global stock-market wealth creation over that period.
The lesson is not “stocks are bad.” The index wins because it owns the few massive winners. The average individual stock often does not.
The market is not equally weighted by hope
Many investors talk about “the market” as if every company contributes equally. They do not. Most major equity indices are market-cap weighted or modified market-cap weighted. In simple terms, the bigger a company becomes, the more influence it has on the index. S&P Dow Jones notes that a majority of its equity indices are market-cap weighted and float-adjusted, while the Nasdaq-100 uses a modified market-capitalisation weighting scheme.
This matters because the index naturally becomes more exposed to winners as they grow. Losers shrink. Winners become larger weights. Failed companies disappear. New leaders get added.
That is why an index is not just a static basket of companies. It is an evolutionary machine. It continually reallocates influence toward the companies that survive, scale, and compound. Individual stock picking does not automatically do that for you. If you buy the wrong company and hold it because you believe “stocks always recover,” there is no committee coming to remove your loser and replace it with the next winner. You have to make that decision yourself.
Why this happens: stock returns are extremely skewed
Most people imagine stock returns like a normal bell curve. A few winners. A few losers. Most companies somewhere in the middle. That is not how long-term stock returns work. Long-term stock returns are positively skewed. A stock can only lose 100% of its value, but a winner can rise 1,000%, 5,000%, 10,000%, or more.
That asymmetry creates a power-law outcome: a small number of companies create most of the wealth, while many others disappoint, stagnate, get acquired cheaply, dilute shareholders, or disappear entirely.
The 1999–2002 dot-com bust is the cleanest reference. For every Amazon — which survived a 94% drawdown to become a $2 trillion company — there were dozens of names that simply went to zero. Pets.com, Webvan, eToys, Boo.com, Drugstore.com. Sun Microsystems peaked above $200 billion in market cap in 2000; Oracle bought it for $7.4 billion in 2009. Yahoo peaked near $125 billion; Verizon paid $4.83 billion for it in 2017. Lucent, Nortel, JDS Uniphase, Tellabs, Sycamore — none recovered their 2000 highs.
Bessembinder’s 2023 paper attaches hard numbers to the destruction. The single worst lifetime shareholder-wealth outcome in U.S. stock-market history is Worldcom at -$102 billion. Behind it: Lucent Technologies -$87 billion, Wachovia -$85 billion, Nortel -$55 billion. Even more striking, Rivian Automotive registered -$92 billion in just thirteen months — the second-worst lifetime outcome ever, achieved during a single calendar year on the public markets. The post-2017 destruction list also includes Coinbase (-$47B), Doordash (-$32B), Airbnb (-$28B), Snowflake, Uber, and three EV names (Lucid, Nikola, Rivian). The market cap that disappeared from these names runs into the trillions.
Dimensional Fund Advisors’ research makes this practical. In its study of individual U.S. stocks, Dimensional found that only about one fifth of stocks survived and outperformed the market over 20-year periods. It also found that the median surviving stock underperformed the market across five-, 10-, and 20-year horizons.
That is a brutal statistic. It means that even if a company survives, survival alone is not enough. A stock has to survive and outperform. That is a much higher bar.
Dimensional also found that past winners were not meaningfully more likely than past losers to outperform in the future: stocks that had beaten the market over the prior 20 years had roughly the same subsequent 10-year outperformance rate as stocks that had previously underperformed. A great company yesterday is not automatically a great stock tomorrow.
Active managers struggle with the same math
This is not just a retail-investor problem. Professional stock pickers struggle with it too.
Morningstar’s U.S. Active/Passive Barometer Year-End 2024 found that less than 22% of active strategies survived and beat their passive counterparts over the 10 years through 2024. For active U.S. stock funds specifically, Morningstar reported a 10-year active success rate of 15% — meaning roughly 85% did not survive and outperform their passive peers.
The large-cap space was even tougher. Only 7% of active U.S. large-cap funds survived and beat their average passive rival over the decade through December 2024. In active large-growth, the long-term record was particularly severe: of the funds that existed two decades earlier, nearly 65% closed and only 1% outperformed their average indexed peer.
S&P’s own SPIVA scorecard tells the same story from the other end. As of year-end 2024, 84.7% of U.S. large-cap funds underperformed the S&P 500 over 10 years; over 20 years the figure rises above 90%. Across mid-cap, small-cap, and growth categories, the long-horizon failure rate is similar.
The investor’s behavioural gap matters too. Dalbar’s annual Quantitative Analysis of Investor Behavior reports show that, over rolling 30-year windows, the average U.S. equity-fund investor underperforms the S&P 500 by three to four percentage points per year — a gap that compounds into a halving of terminal wealth. The pattern is consistent: investors enter near the highs, leave near the lows, miss the recovery, and rotate to last cycle’s winners just in time for the new one to begin.
These are professionals and committed long-term investors with teams, data, access to management, models, and decades of experience. Yet most still fail to beat passive exposure over long periods. That does not mean stock picking is impossible. It means stock picking is harder than it looks — and that concentrated stock picking requires discipline, humility, and a clear edge.
In technology, the game is even more brutal
Tech is where the winner-takes-most dynamic becomes extreme. Every major technology cycle rewrites the leaderboard:
- PCs
- Internet
- Mobile
- Cloud
- AI
Each platform shift creates new winners and exposes old weaknesses. Kodak is the classic example — it had deep knowledge of photography and digital imaging, yet its legacy film economics made it difficult to adapt quickly enough to the digital transition. Kodak filed for bankruptcy protection in 2012.
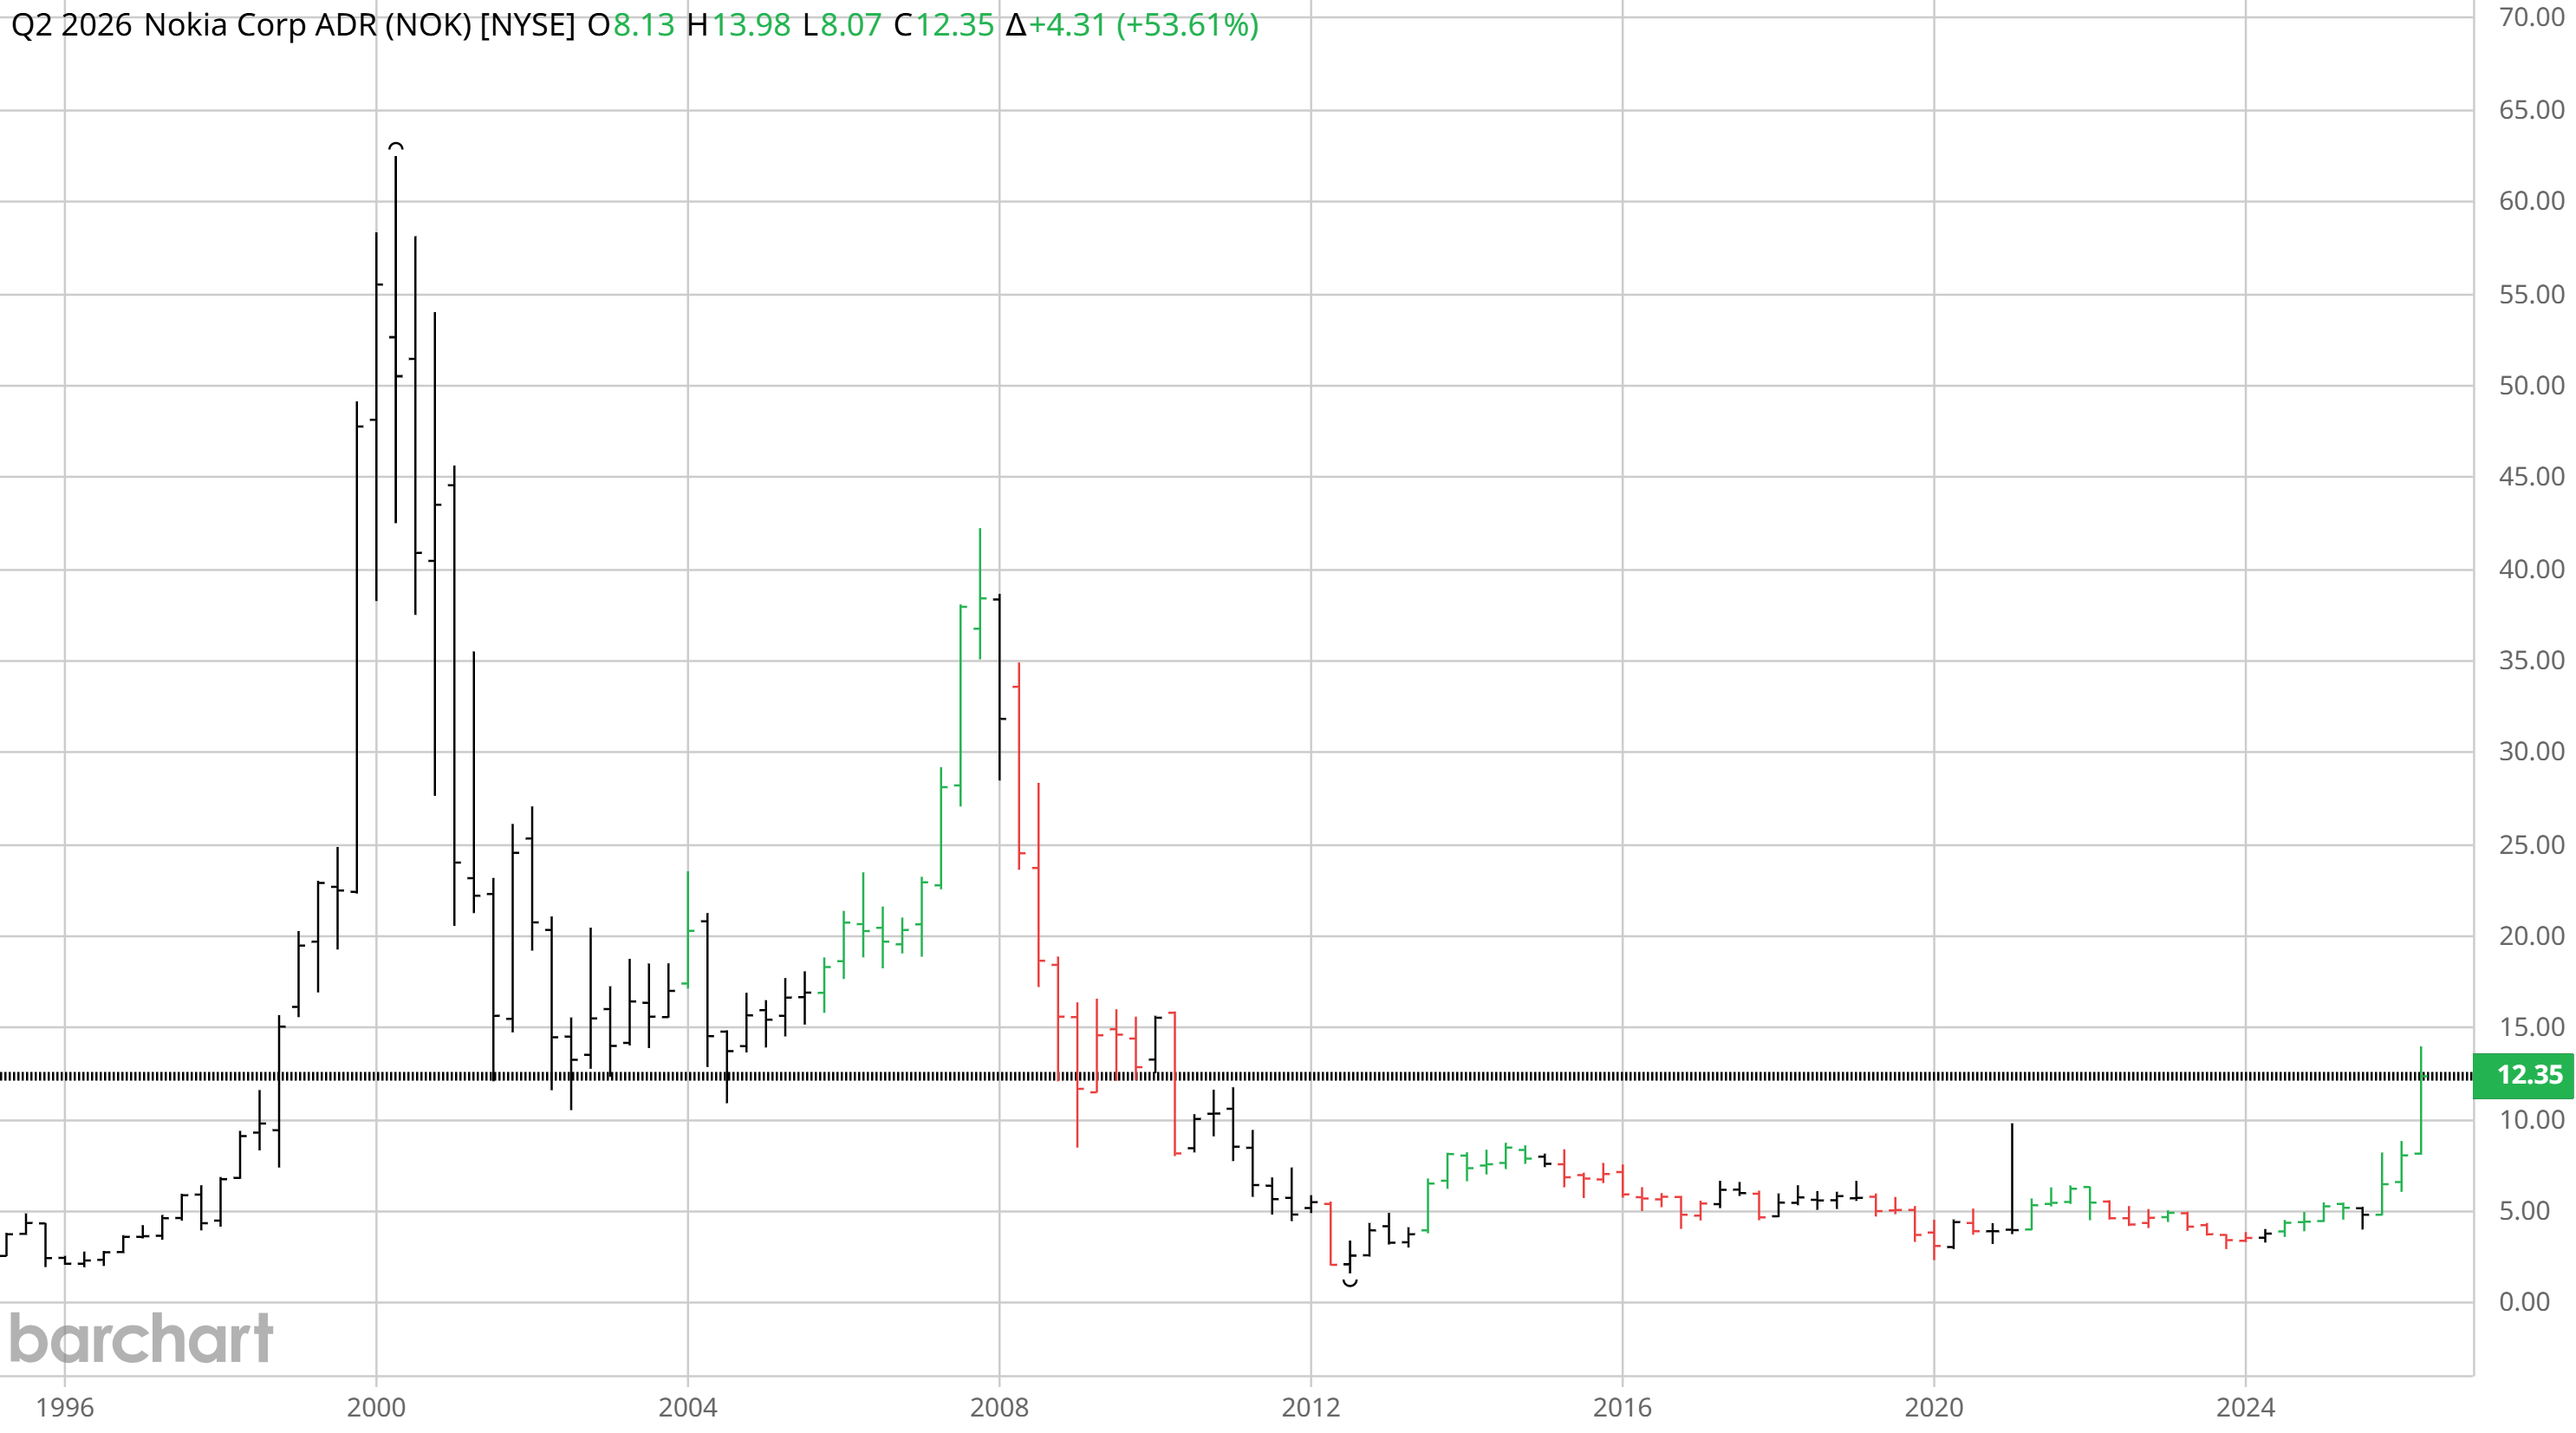
Nokia is another example. At its height, Nokia had more than 40% global mobile-phone market share, but its decline accelerated as the smartphone era shifted value toward software ecosystems, culminating in the sale of its mobile phone business to Microsoft in 2013.
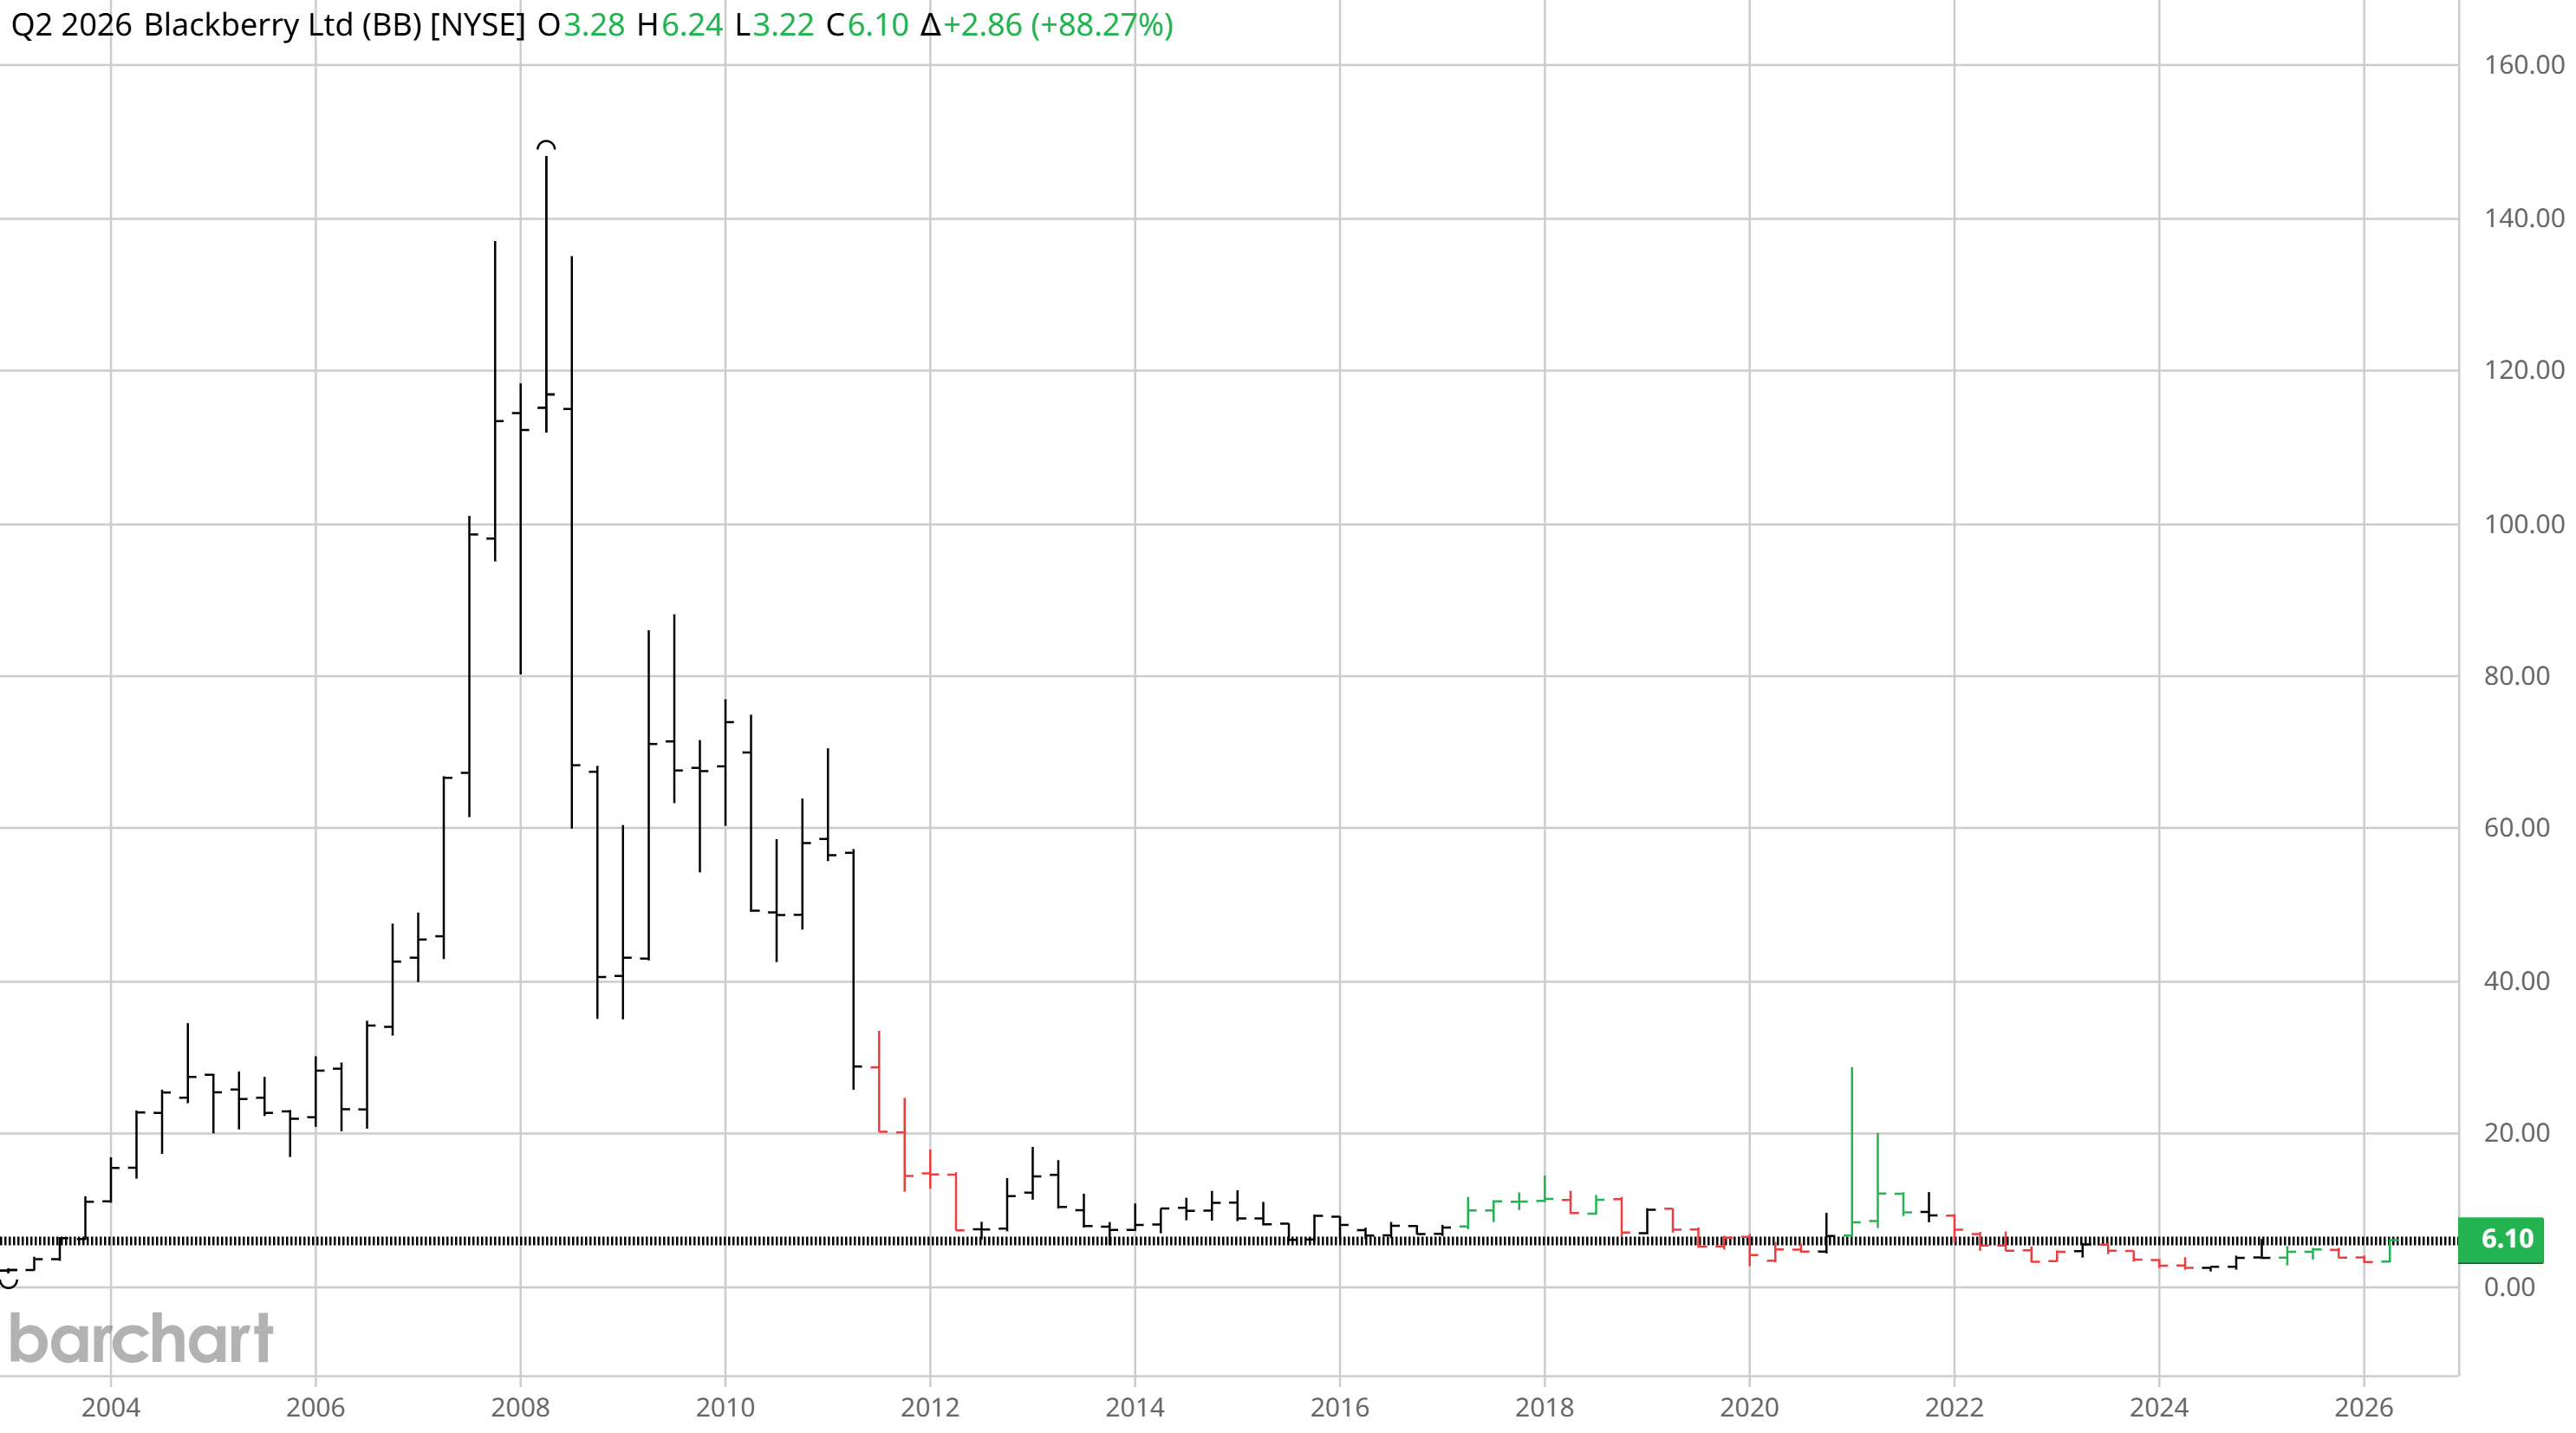
Yahoo, BlackBerry, Intel, Cisco — each shows a different version of the same lesson. Dominance is not permanent. Sometimes a company dies. Sometimes it survives but stops compounding. Sometimes it remains important but loses the economic centre of gravity to a new platform.
Cisco peaked at a market cap of around $550 billion in March 2000. Twenty-five years later, despite a steady, profitable, fundamentally healthy business, it has not reclaimed that price. Intel — once the most valuable semiconductor company in the world — was overtaken by Nvidia, TSMC, AMD, and Broadcom inside a five-year window, then dropped below $100 billion in market cap while Nvidia crossed $3 trillion. Yahoo did everything right by the playbook of 1999 and ended up worth less than 4% of its peak. Each of these companies was professionally managed, technically sound, and genuinely important when the camera clicked. None of that protected the share price.
That is why technology investing is not just about identifying strong businesses. It is about identifying whether today’s strong business is positioned for tomorrow’s platform.
The Nasdaq shows how concentrated tech returns can be
The Nasdaq-100 has been one of the best examples of modern market concentration. From 2019 to 2024, the largest 30 companies in the Nasdaq-100 had an average aggregate index weight of 77% and contributed 88% of the index’s total return on average. In 2024 alone, the top 30 companies contributed 98% of the index’s performance.
This is not an accident. It is how compounding works in markets where scale, network effects, data, distribution, software ecosystems, and capital access matter. The biggest winners get bigger because their advantages compound:
- They attract the best talent.
- They have the lowest cost of capital.
- They can spend more on research and development.
- They can acquire emerging threats.
- They control distribution.
- They own customer relationships.
- They build ecosystems, not just products.
The current leaders will not dominate forever. The names will change. But the structure is unlikely to change. In markets driven by platforms and network effects, the rewards tend to concentrate.
The recycling of the corporate population is faster than most investors think. Of the original 1957 S&P 500, fewer than 60 companies still exist as independent listed entities. McKinsey and Innosight have tracked the average tenure of an S&P 500 constituent dropping from 33 years in 1965 to under 20 years today, with their projection that it will reach roughly 12 years by 2027. The index works because its rules force the recycling. Your portfolio doesn’t — unless you do.
Tech leadership is cyclical
One of the biggest mistakes investors make is assuming that yesterday’s winner will automatically be tomorrow’s winner. That is especially dangerous in technology. Every 10 to 15 years, the market tends to move through a new platform transition.
- The PC era rewarded Microsoft, Intel, Dell, and Cisco.
- The internet era rewarded Google, Amazon, and eBay.
- The mobile era rewarded Apple, Android, Qualcomm, and app ecosystems.
- The cloud era rewarded AWS, Microsoft Azure, Nvidia, and SaaS leaders.
- The AI era is now reshuffling the deck again.
The next transition may come from agentic AI, spatial computing, robotics, quantum computing, autonomous systems, edge AI, new semiconductor architectures, or something investors are not paying enough attention to yet. The point is not to guess every trend. The point is to avoid assuming that leadership is permanent.
High market share can be a strength. But it can also create inertia. Large companies often have legacy margins to protect, bureaucracies to manage, and internal incentives that reward defending the old business rather than building the new one. That is how disruption happens — not because incumbents are stupid, but because they are often rationally attached to the business model that made them successful.
Even the winners had brutal drawdowns
The skew works against patience as much as it works against picking. Even the names that ultimately delivered most of the wealth went through interim drawdowns that would have shaken almost any investor out of the position.
- Microsoft peaked in December 1999 and did not regain that level until October 2016 — a 17-year underwater stretch, with a ~63% peak-to-trough drawdown along the way.
- Amazon fell roughly 94% from December 1999 to October 2001 — split-adjusted from $113 to $5.51. Anyone who held it through that period did so against a wall of media calling them irrational.
- Apple had multiple 50%+ drawdowns through the 2000s — from the iPod-era ramp through the 2008 crisis to the 2012–2013 slump.
- Nvidia lost roughly 65% peak-to-trough in 2022, less than two years before becoming the most valuable company in the world.
- Meta dropped 76% from peak to trough between September 2021 and November 2022, then more than tripled in the following 18 months.
A buy-and-hold investor in any of these names had to be capable not just of identifying the company, but of surviving it. Identifying the winner is half the work. Holding through the drawdown is the other half. “I would have held Amazon” is much easier to say in 2026 than it was in 2001, when the financial press had largely declared the experiment over.
And it isn’t only drawdowns. Some firms with hundreds of billions in lifetime wealth created had their compound wealth-creation reset in real time. Bessembinder’s 2023 paper documents that between 2019 and 2022, Meta Platforms lost $184 billion in lifetime shareholder wealth, Intel lost $118 billion, Disney lost $105 billion, Amazon lost $101 billion, Boeing lost $74 billion, and Verizon lost $61 billion. Each is a company that on paper still prints profits and dominates a category. The market simply re-priced their forward-cash-flow profile downward by hundreds of billions across three calendar years. A position that was a “forever hold” in 2019 was a value-trap-in-progress by 2022 for any of these six. Tesla, in the same paper, briefly hit rank #5 globally with $991 billion in SWC at the end of 2021 — and then dropped roughly $720 billion of that wealth in 2022 alone.
What this means in practice
The lesson is not “never buy individual stocks.” The lesson is do not buy individual stocks casually.
A single stock is not “the market.” A single stock is a concentrated bet on one company’s future cash flows, competitive position, management execution, capital allocation, valuation, and ability to survive disruption. That is a lot of variables.
If you are buying individual stocks, you need to understand the game you are playing. You are not simply betting that “America grows.” You are betting that a specific company will capture enough of that growth, defend its economics, reinvest intelligently, and avoid being disrupted. That is a much harder bet.
How I think about this
This is not advice. It is the framework I run my own portfolio with.
1. Diversify, even within technology
I like technology because it is where a lot of long-term wealth creation happens. But I do not want one stock, one theme, or one narrative to dominate my portfolio. AI may be the current platform shift, but AI itself has many layers — semiconductors, cloud infrastructure, data centres, cybersecurity, software, applications, energy, networking, robotics, consumer interfaces, enterprise automation. Owning only one part of the stack creates hidden concentration risk. Diversification is not an admission that you lack conviction. It is an admission that the future is uncertain.
2. Watch for platform transitions
The biggest winners often emerge when the user interface, computing layer, distribution channel, or cost structure changes. The question is not just “who is winning today?”. The better question is “who becomes more important if the next platform scales?”
- If agentic AI changes how software is used — which companies gain distribution?
- If inference costs collapse — which business models become viable?
- If spatial computing becomes mainstream — who owns the interface?
- If robotics scales — who owns the operating system, sensors, chips, and data?
- If quantum computing eventually matters — who is building the ecosystem?
The market rewards companies that sit at the centre of important transitions.
3. Prefer ecosystem builders
Products can be copied. Ecosystems are harder to replicate. I prefer companies with multiple reinforcing advantages — developer ecosystems, cloud platforms, distribution channels, data advantages, hardware-software integration, network effects, high switching costs, brand trust, capital discipline, R&D capacity. The best companies do not just sell products. They become infrastructure. They become the default. They become hard to leave.
4. Avoid nostalgia plays
Old champions rarely come back just because they were once great. A low valuation is not enough. A recognisable brand is not enough. A glorious history is not enough. The market does not reward nostalgia — it rewards future cash flows. Some former leaders can reinvent themselves, but the burden of proof is high. I need to see evidence of a new moat, a new growth engine, and renewed relevance. Otherwise, it is usually a value trap dressed up as a comeback story.
5. Story stocks = sector leader, never the runner-up
In winner-takes-most markets, the difference between number one and number three can be enormous. The leader gets better economics, better talent, better distribution, better capital access, more strategic optionality, the developer ecosystem, the supply contracts, and the press cycle. The bronze medallist looks cheaper. But cheaper is not always better — sometimes the third-best company is cheap because the market already understands that the economics are going to the leader.
Concretely, in the AI build-out stack as I read it today, this means I buy:
- Nvidia as #1 in GPU compute — not AMD, not Intel, not the custom-ASIC option.
- SK Hynix as #1 in HBM memory — not Samsung, not Micron. The HBM book is sold through 2026 at premium pricing for a reason.
- Teradyne as #1 in semiconductor automated test equipment — not the second-tier ATE names. Memory-test sub-niche goes to Advantest where the constraint is HBM throughput.
- Infineon as #1 in power semiconductors — not the analog runners-up. Every megawatt the AI build-out adds requires the right power semis underneath.
The runners-up — AMD, Micron, KLA, onsemi, STMicro — are good businesses. None of them is currently capturing the marginal dollar of TAM growth in their layer. The discount to the #1 reflects the market’s current read of who gets paid as the layer scales. The market is usually right about this until the day it isn’t, and waiting for that day is most of the disposition-effect tax that patient retail investors quietly pay.
6. Separate the company from the stock
A great company can be a bad investment at the wrong price. A mediocre company can look cheap and still destroy capital. I try to separate three questions:
- Is this a great business?
- Is it a great stock at today’s valuation?
- Does it deserve a meaningful position size?
Those are not the same question. Many investors get into trouble because they answer the first question and forget the other two.
7. Respect position sizing
Because stock returns are skewed, some mistakes are inevitable. The goal is not to be right on every stock. The goal is to avoid one mistake being fatal, while giving genuine winners enough room to matter. A portfolio should be built around the reality that some companies will disappoint, some will stagnate, and a few may do far better than expected. The best investors are not just good at picking. They are good at surviving long enough for their winners to compound.
8. If I go passive, I pick the index very carefully
Not every index is the same. The Nasdaq-100 has been the cleanest live demonstration of the winner-takes-most reality this whole essay rests on. By construction it filters out NYSE listings and most of the slower, smaller, structurally weaker U.S. equity universe, leaving a basket dominated by exactly the kind of platform-scale, network-effect, software-and-semis businesses where the wealth has actually compounded. From 2019 to 2024 the largest 30 names in the Nasdaq-100 contributed an average of 88% of the total return — and in 2024 alone, 98%. That isn’t a flaw. That’s the index doing its job.
I lean further into that filter, not away from it. Two ETFs that take the Nasdaq-100 logic and concentrate it further:
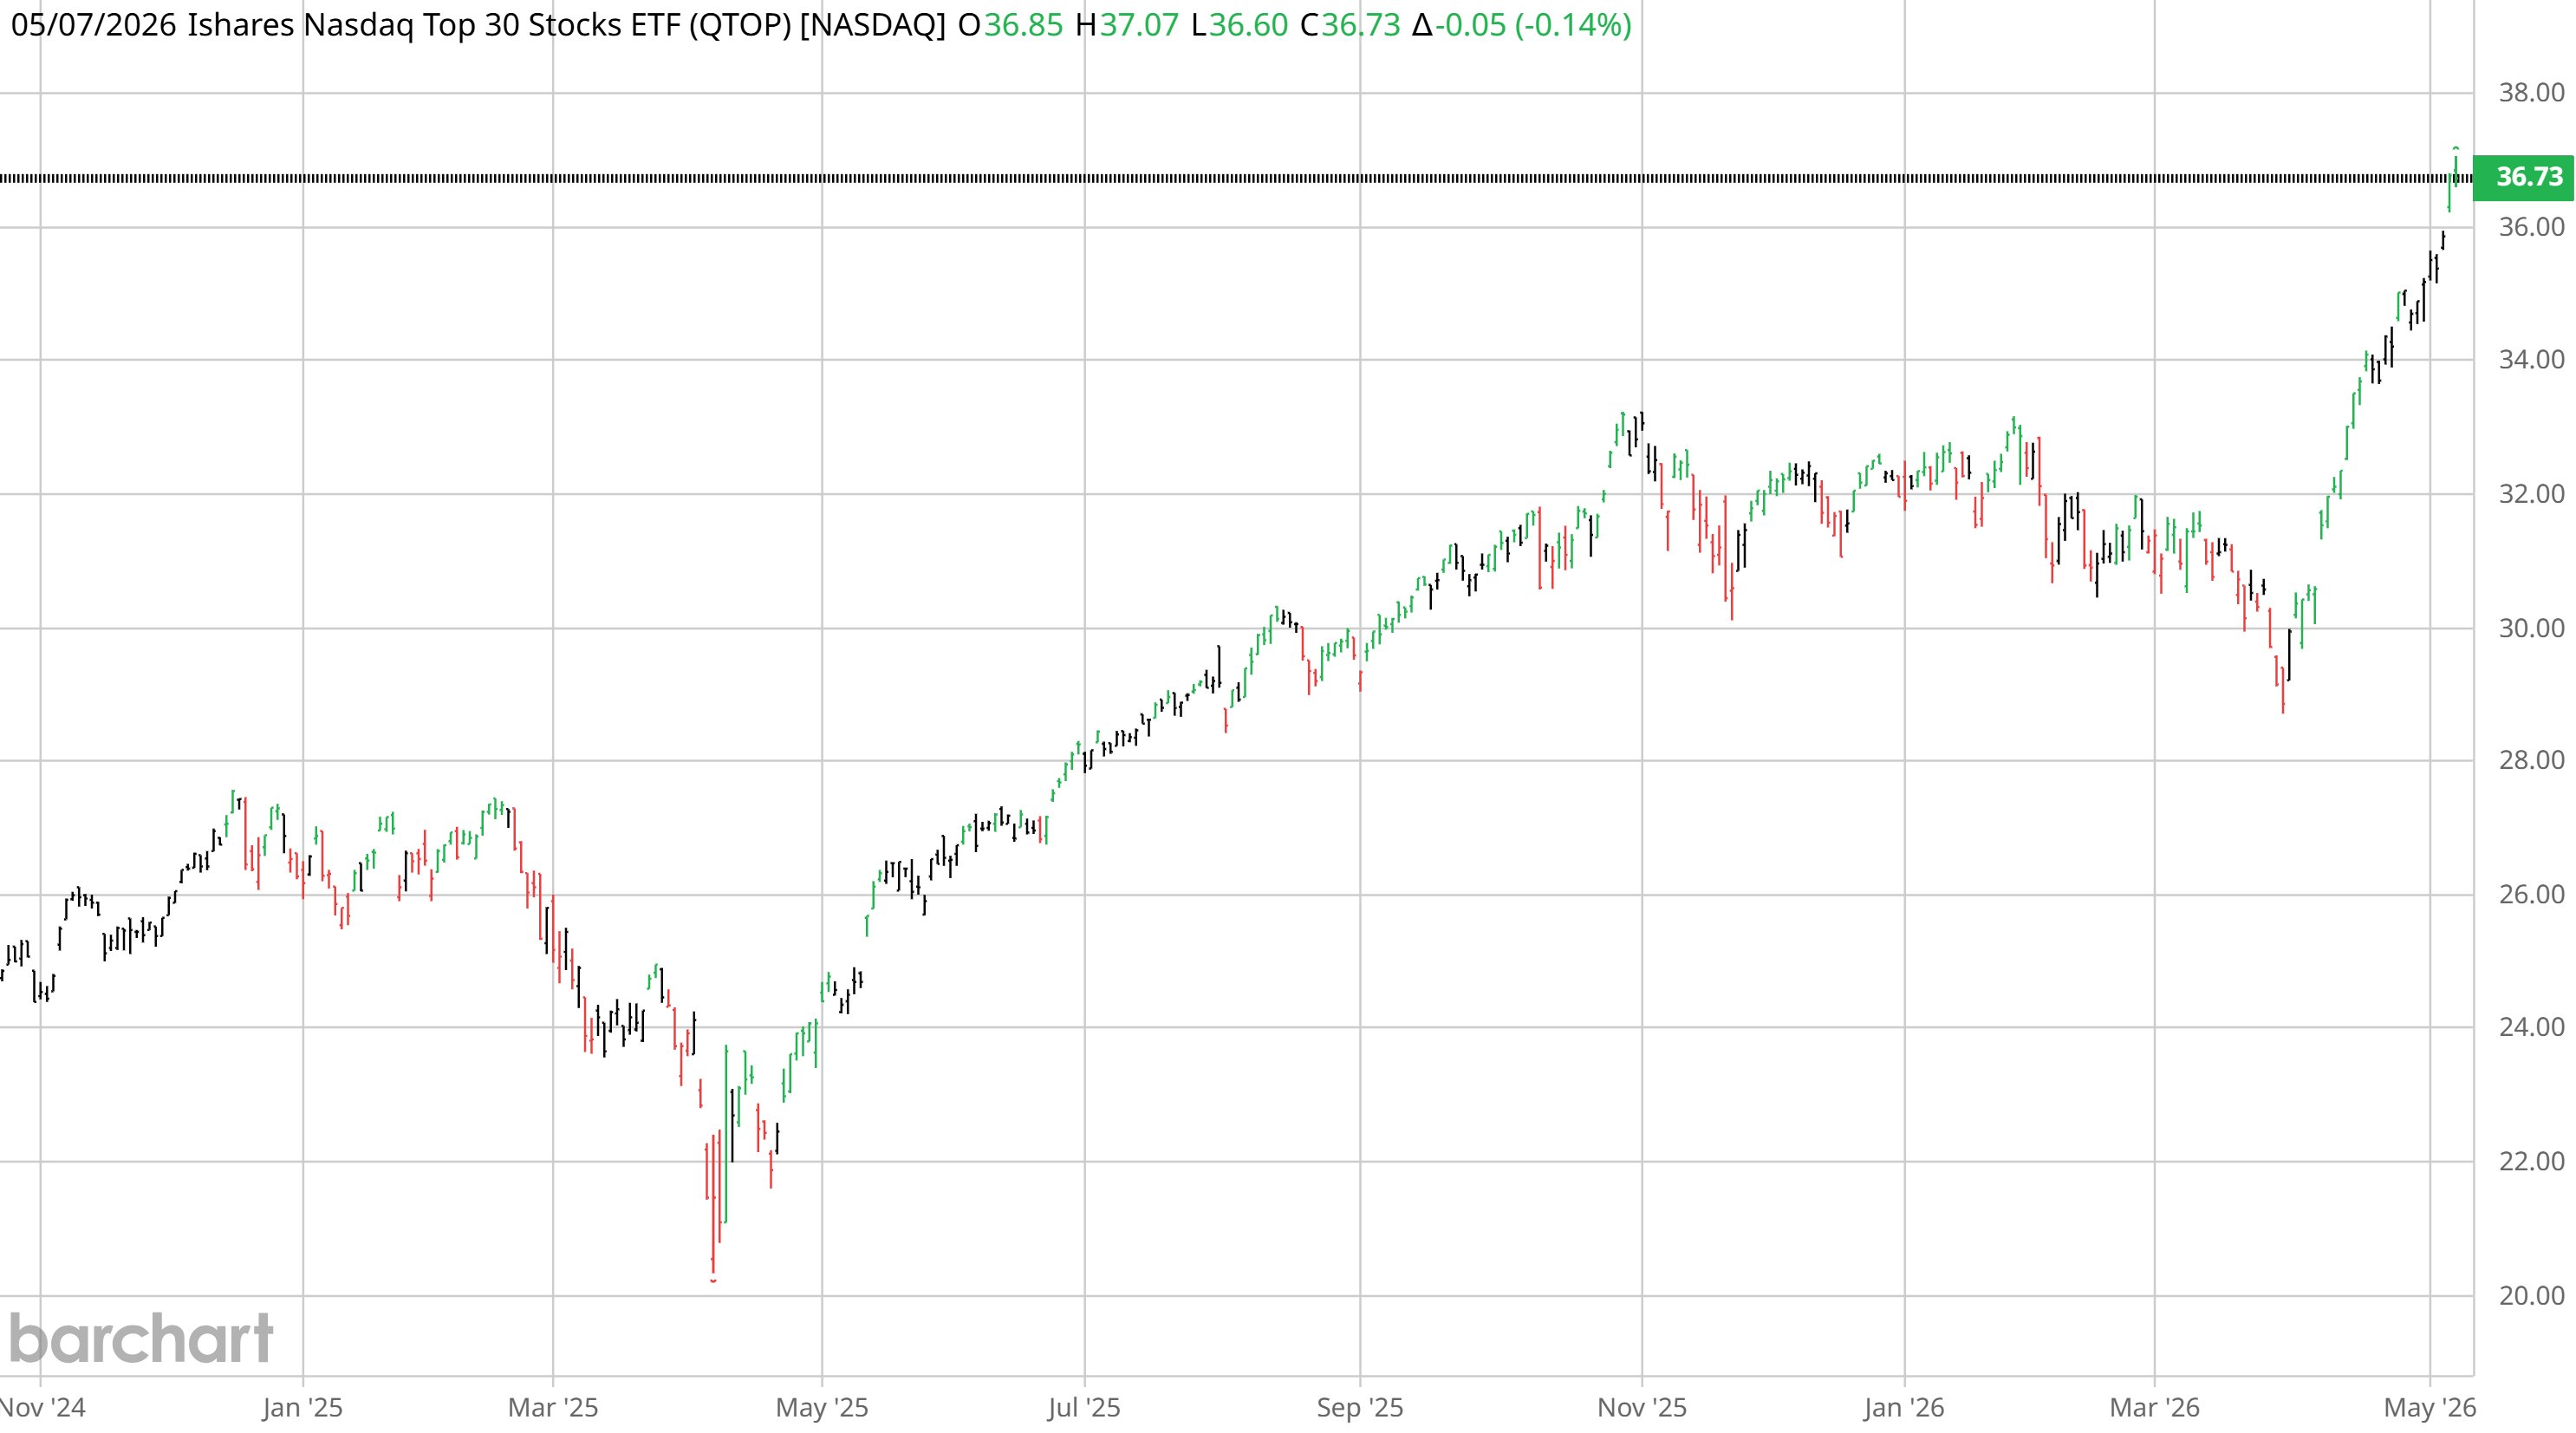
- iShares Nasdaq Top 30 Stocks (QTOP) — owns only the 30 largest names inside the Nasdaq-100. Exactly the cohort that produced 88% of the index’s return on average from 2019 to 2024.
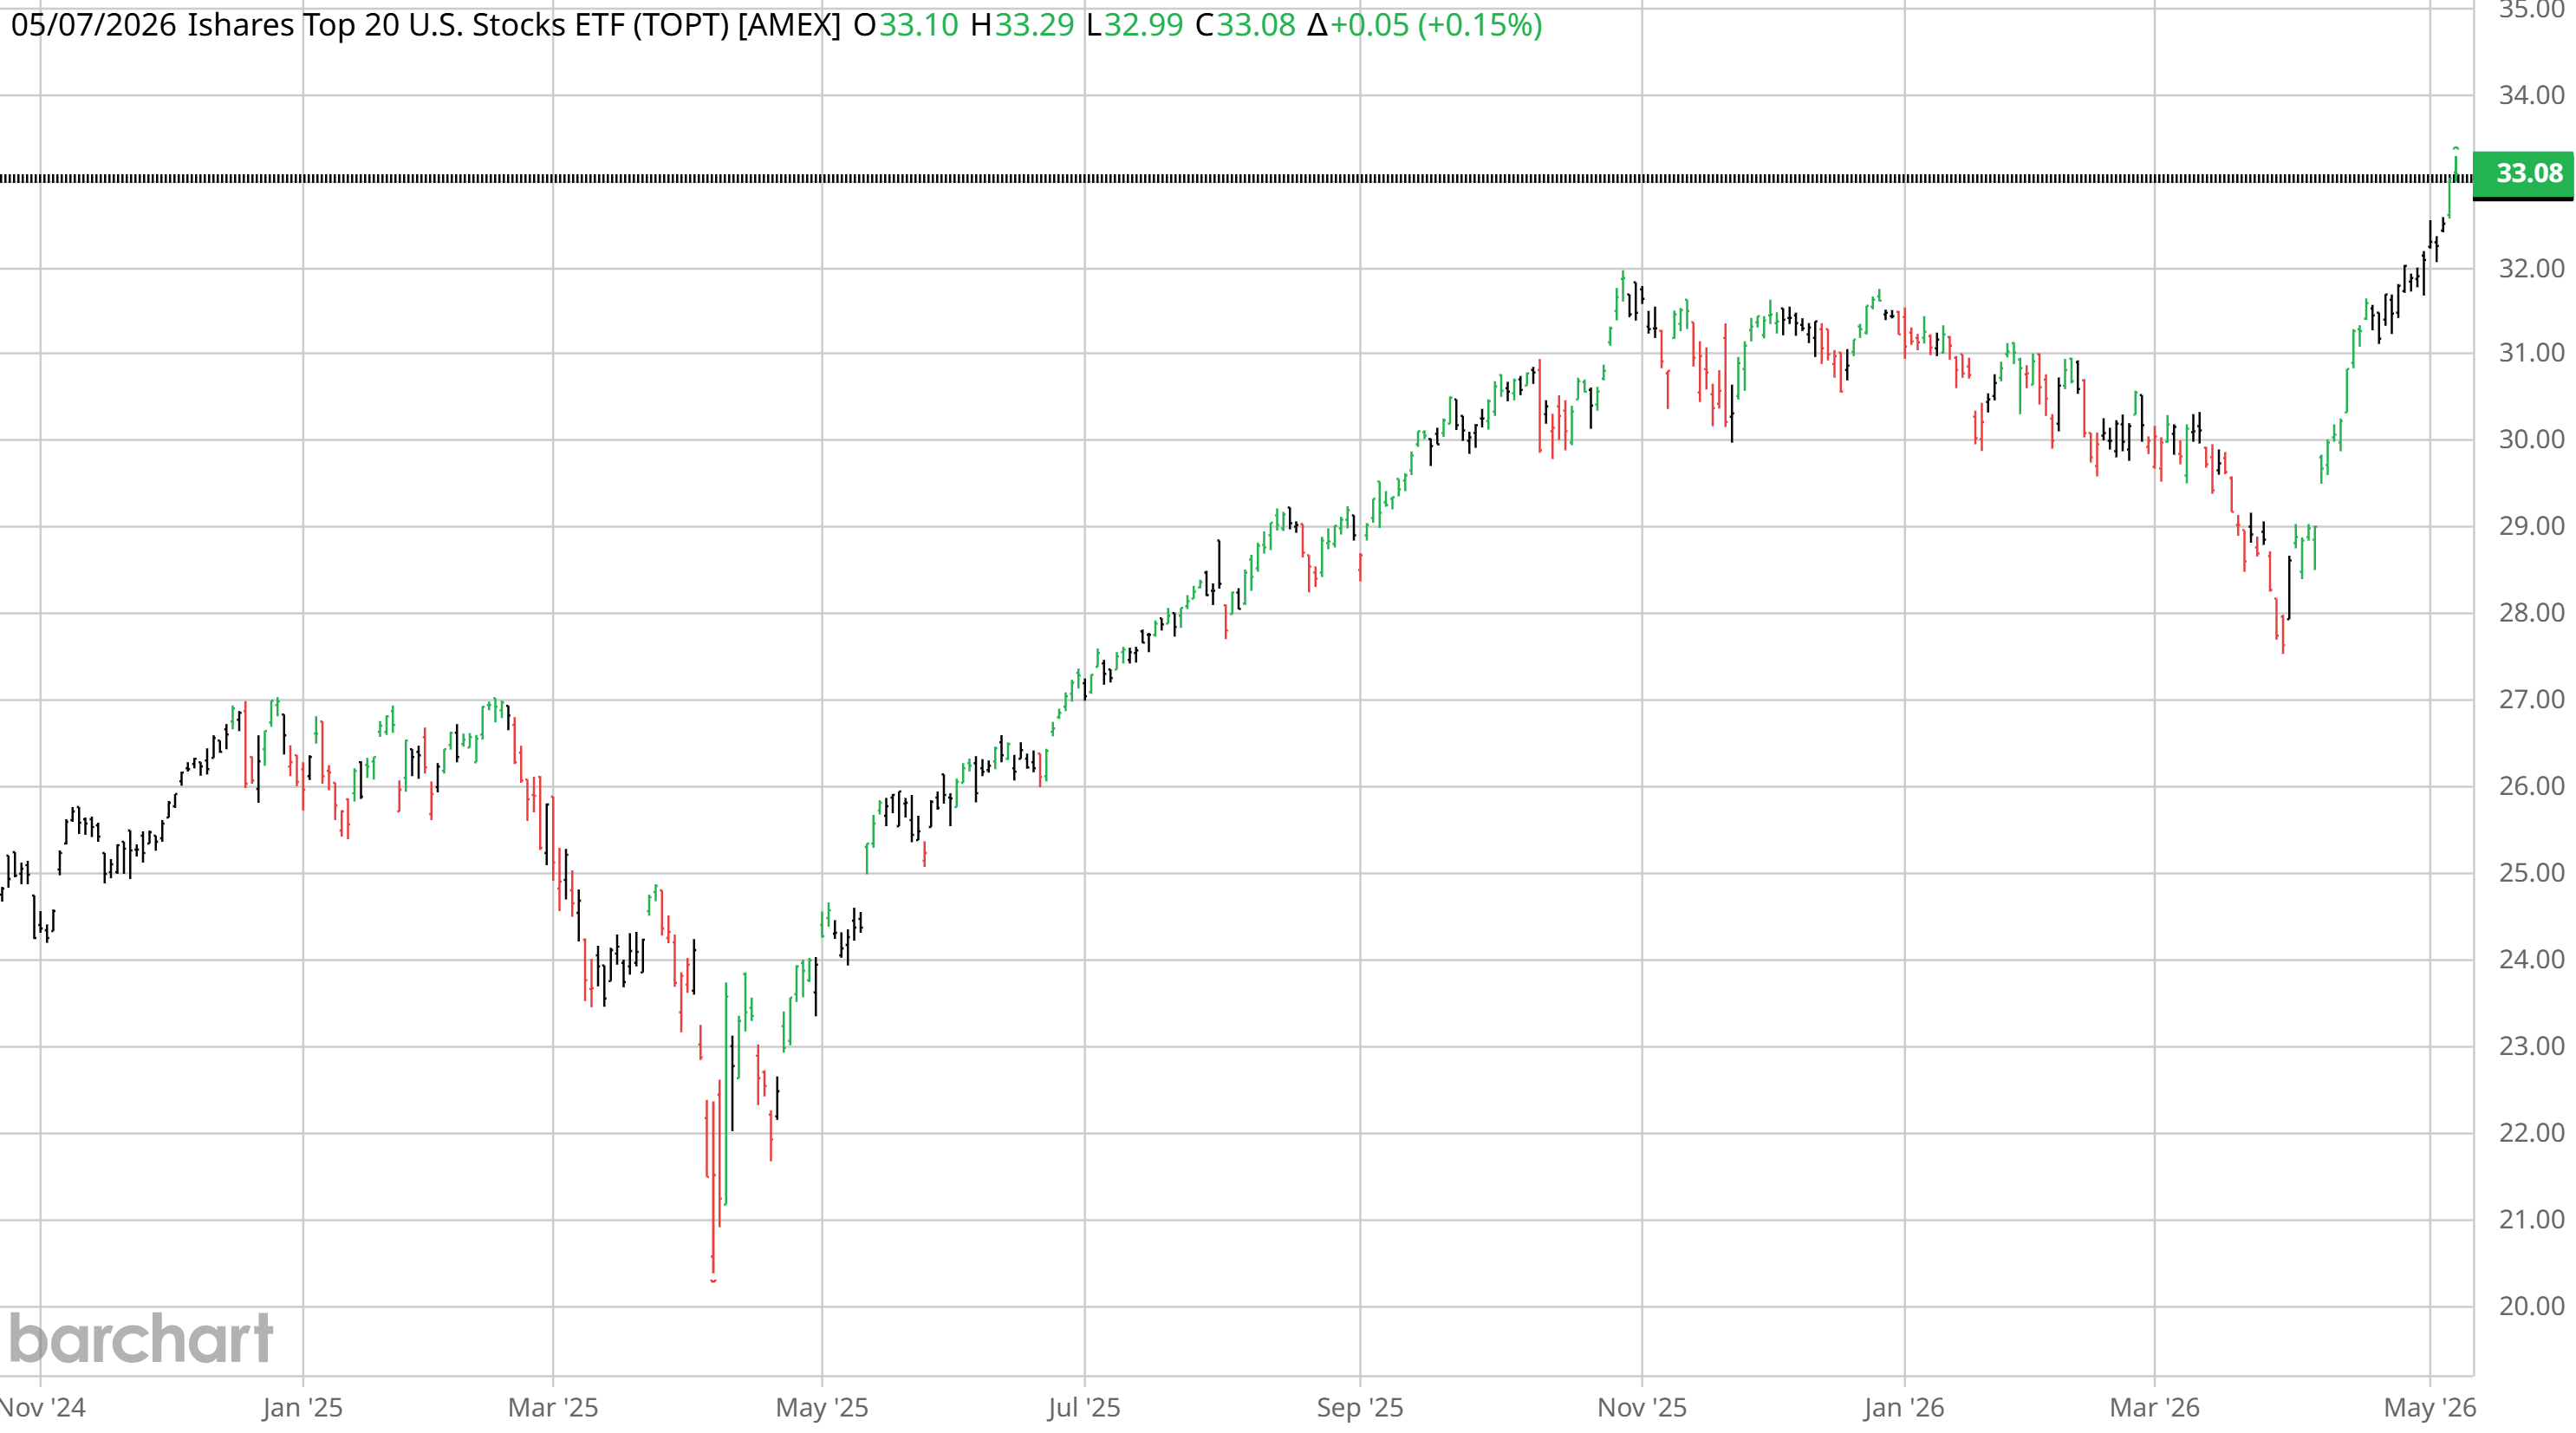
- iShares Top 20 U.S. Stocks (TOPT) — goes further still, owning only the very largest 20 U.S. names. The most concentrated mega-cap exposure available in a single ETF.
Both are constructed around the same observation that drives this entire piece — long-run wealth creation concentrates, and it concentrates more over time, not less.
Both ETFs are issued by iShares — i.e. BlackRock. One issuer, two flavours of the same idea: own the very largest names, weighted toward the very biggest, and let the index do the recycling for you. Simplifying an investing life often comes down to buying the top-notch ETFs, not assembling a hand-picked basket.
Three questions worth sitting with as you look at that TOPT chart:
- Is your portfolio at an all-time high today?
- Did you capture this last leg up in full force?
- And if you have been invested in individual stocks — were they actually the right ones?
If the honest answer to any of those is no, the simplifying move is the one the chart above is making for you. One ticker. Done.
The mirror image of this preference is the Russell 2000. The index is dominated by sub-$3 billion U.S. companies, many of which are unprofitable, structurally challenged, or both. Bessembinder’s destruction list — Rivian, Coinbase, Doordash, Lucid, Nikola, the post-2017 IPO cohort — sits overwhelmingly in this universe. The Russell 2000 contains, by construction, the part of the U.S. equity market most likely to underperform Treasury bills over the long run. I run no Russell 2000 exposure.
The real lesson
The stock market has created enormous wealth. Most individual stocks have not. That is the paradox. The market works because it captures the few extraordinary companies that drive the majority of returns.
The investor’s job is to decide whether they want broad exposure to that process, or whether they have the skill, temperament, and discipline to identify some of those winners directly. Both approaches can work. But confusing the two is dangerous. Buying the S&P 500 is one thing. Buying one stock because “stocks go up over time” is something else entirely.
Final thought
Do not buy a U.S. stock just because the company is famous. Do not buy it just because it used to dominate. Do not buy it just because the ticker feels safe. Do not buy it just because everyone on social media is talking about it. Buy it only if you understand the game:
- Most stocks underperform.
- A small number create almost all the wealth.
- Technology leadership changes faster than investor memory.
- The index quietly replaces losers — your portfolio will not, unless you make it.
The goal is not to own every stock. The goal is to own enough of the future winners — while avoiding overconfidence in yesterday’s champions.