Read · · 21 min read
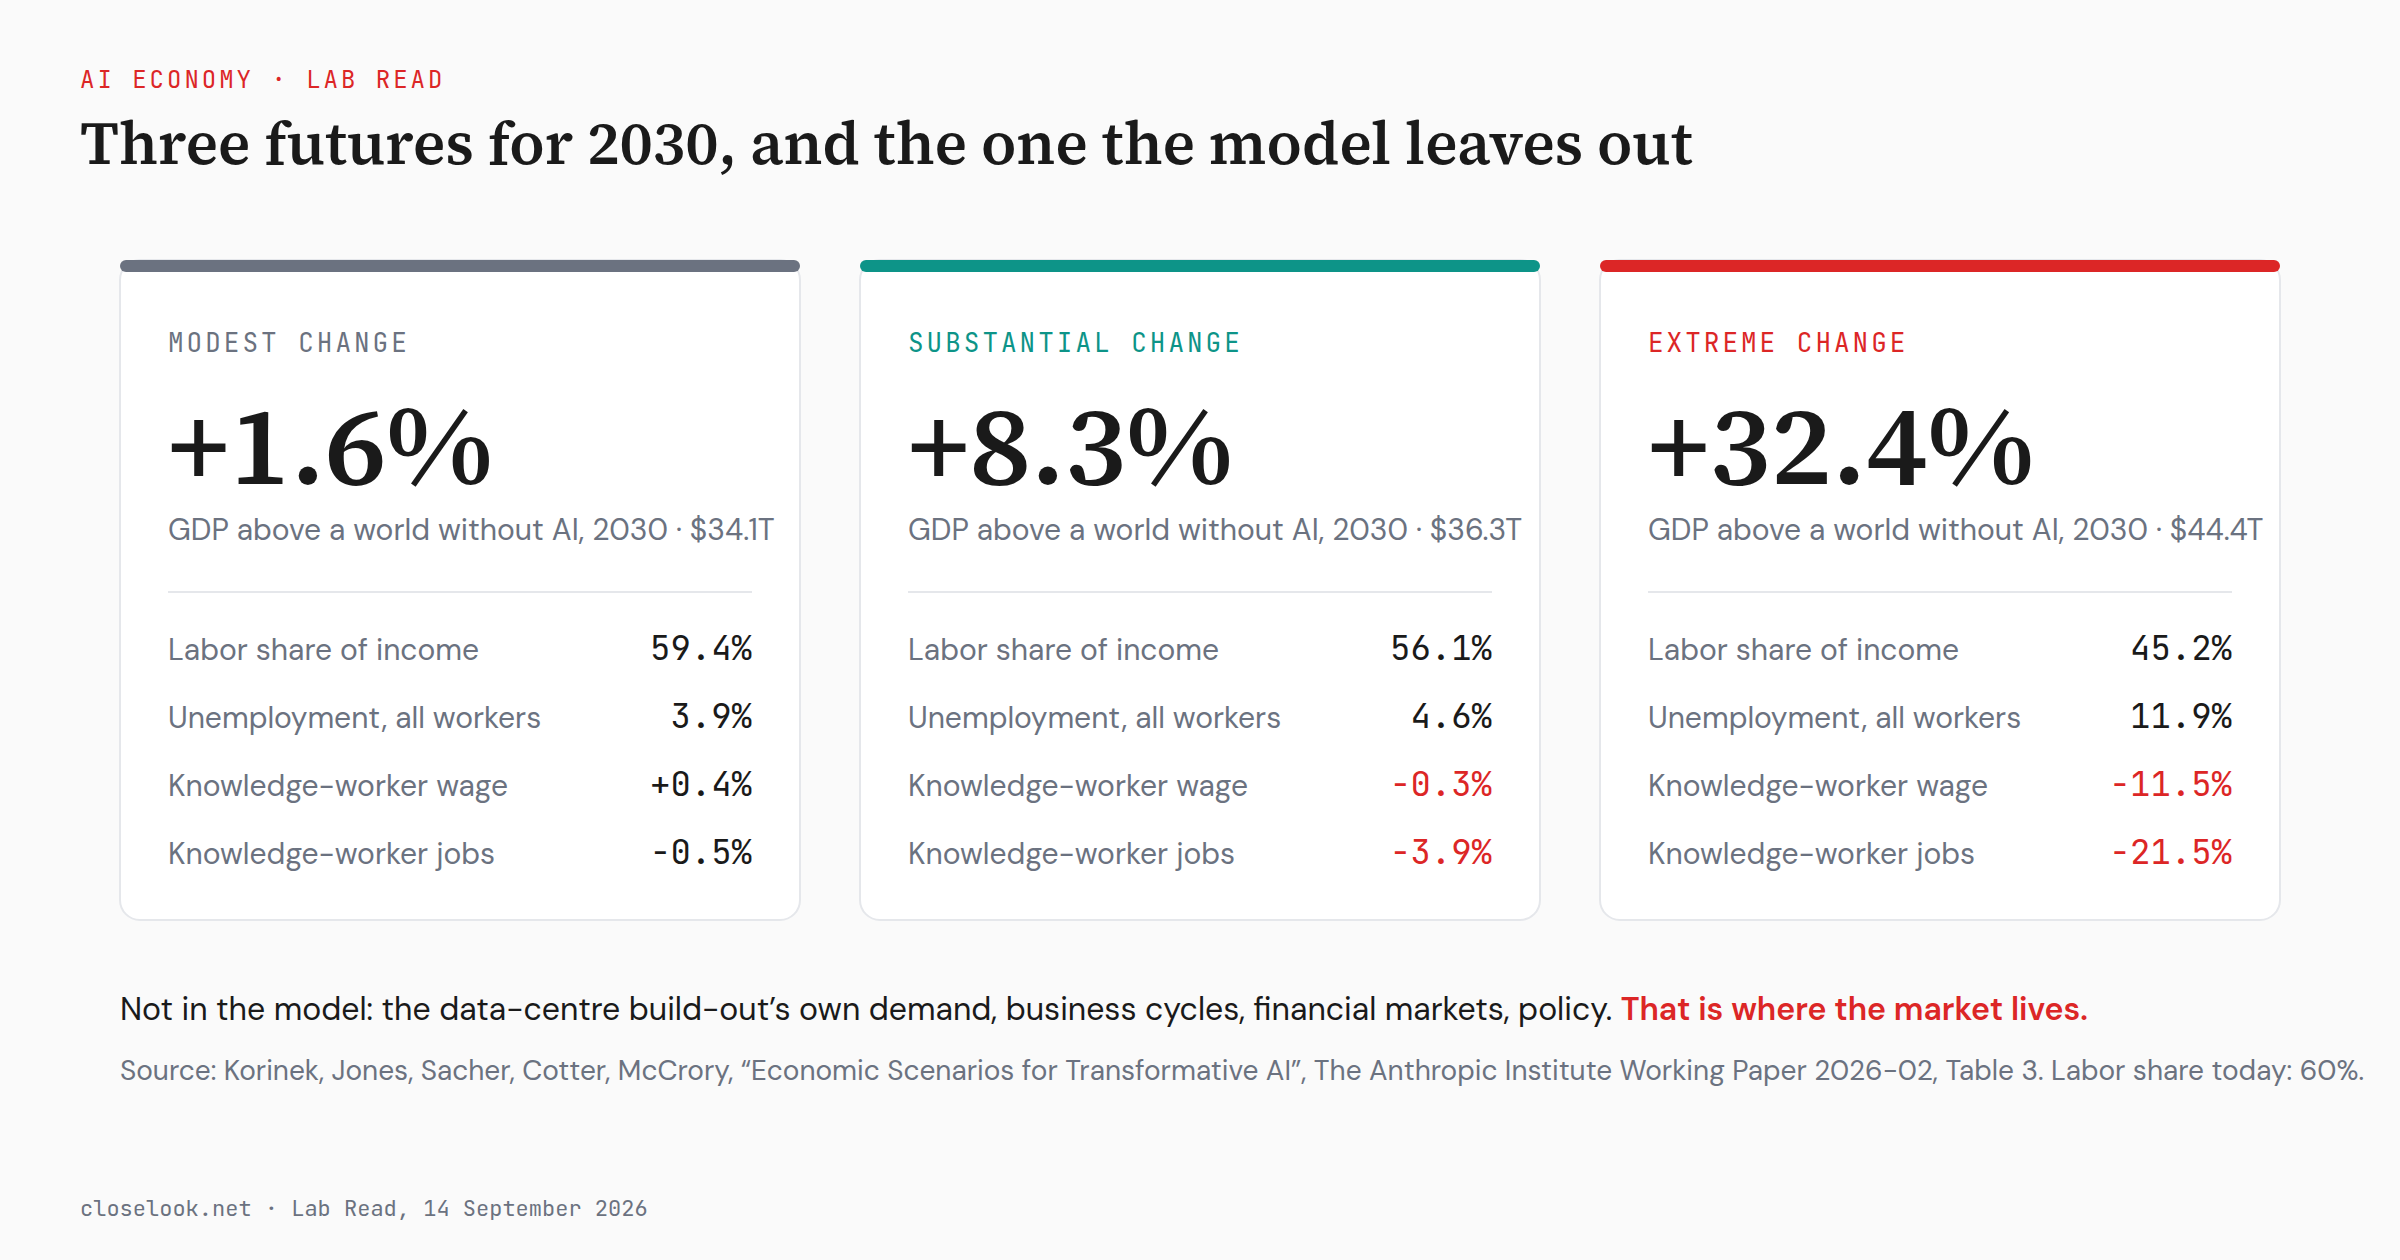
Anthropic’s economists put numbers on modest, substantial and extreme AI: GDP, jobs, wages, the labor share. The build-out that the market prices is not in the model, and that is the read.

A Lab Read on the scenario paper the economists at Anthropic published on 9 September, and on what it leaves out. Diary framing throughout: this is how we read the model and what we watch, not what anyone should do with it. We used the paper, its interactive explorer and the public record; the model’s authors were not consulted.
What the paper does, in one paragraph
On 9 September the Anthropic Institute published a working paper, Economic Scenarios for Transformative AI, by Anton Korinek, Charles Jones, Szymon Sacher, Tess Cotter and Peter McCrory, with an interactive scenario explorer alongside it. It does one thing well: it takes the whole shouting match about what AI does to the economy and turns it into five numbers anyone can argue about. How much knowledge work can AI do. How much of that is it actually used for. Does it do the work alone or with a person. How much faster does the work get done. And how long does a displaced worker take to find a job in another occupation.
Feed the model three settings of those numbers and it returns three American economies in 2030. In the modest one AI is a normal technology and GDP is 1.6% higher than it would have been without it. In the substantial one AI is bigger than the internet, GDP is 8.3% higher and growth in 2030 runs at 5.4% a year. In the extreme one AI does about half of today’s cognitive work, GDP is 32.4% higher, growth hits 15.4% a year, the labor share of income falls from 60% to 45%, and nearly one in five knowledge workers is unemployed.
The authors attach no probabilities. That is the point of the exercise and the reason it is useful to us: it is a map of what would have to be true for each future to arrive, and every one of its inputs is something that will show up in data over the next two years. The paper is also honest about what it leaves out, and one of those omissions is where this diary lives. The data-centre build-out that the Rubin index has tracked to a 91% gain this year is, by the authors’ own account, not in the model.
Headline read: the market has spent 2026 pricing the capital side of the substantial-to-extreme range while the labor market still reads modest. The paper puts numbers on both halves of that gap and says the halves separate after 2027. What it does not price is the thing being built to close the gap.
Inside this study
- Three economies in 2030 — the numbers, one table.
- The five levers — what each scenario assumes, and what the data say today.
- Who gets paid — the labor share, the capital share, and a transfer with no precedent.
- Wages or jobs — the trade-off knowledge workers cannot escape.
- What 10,980 Americans expect — the public lands on the substantial scenario.
- The omission — the build-out is not in the model, and the market lives there.
- Who wants the brakes — Amodei, Altman, Musk, Hassabis, Nadella, the White House and Beijing.
- What it means for the tape — four boards, one model.
- How we hold it — the levers as a watch list.
- Sources.