Read · · 13 min read
AI Stocks — Higher for Longer Splits the AI Trade
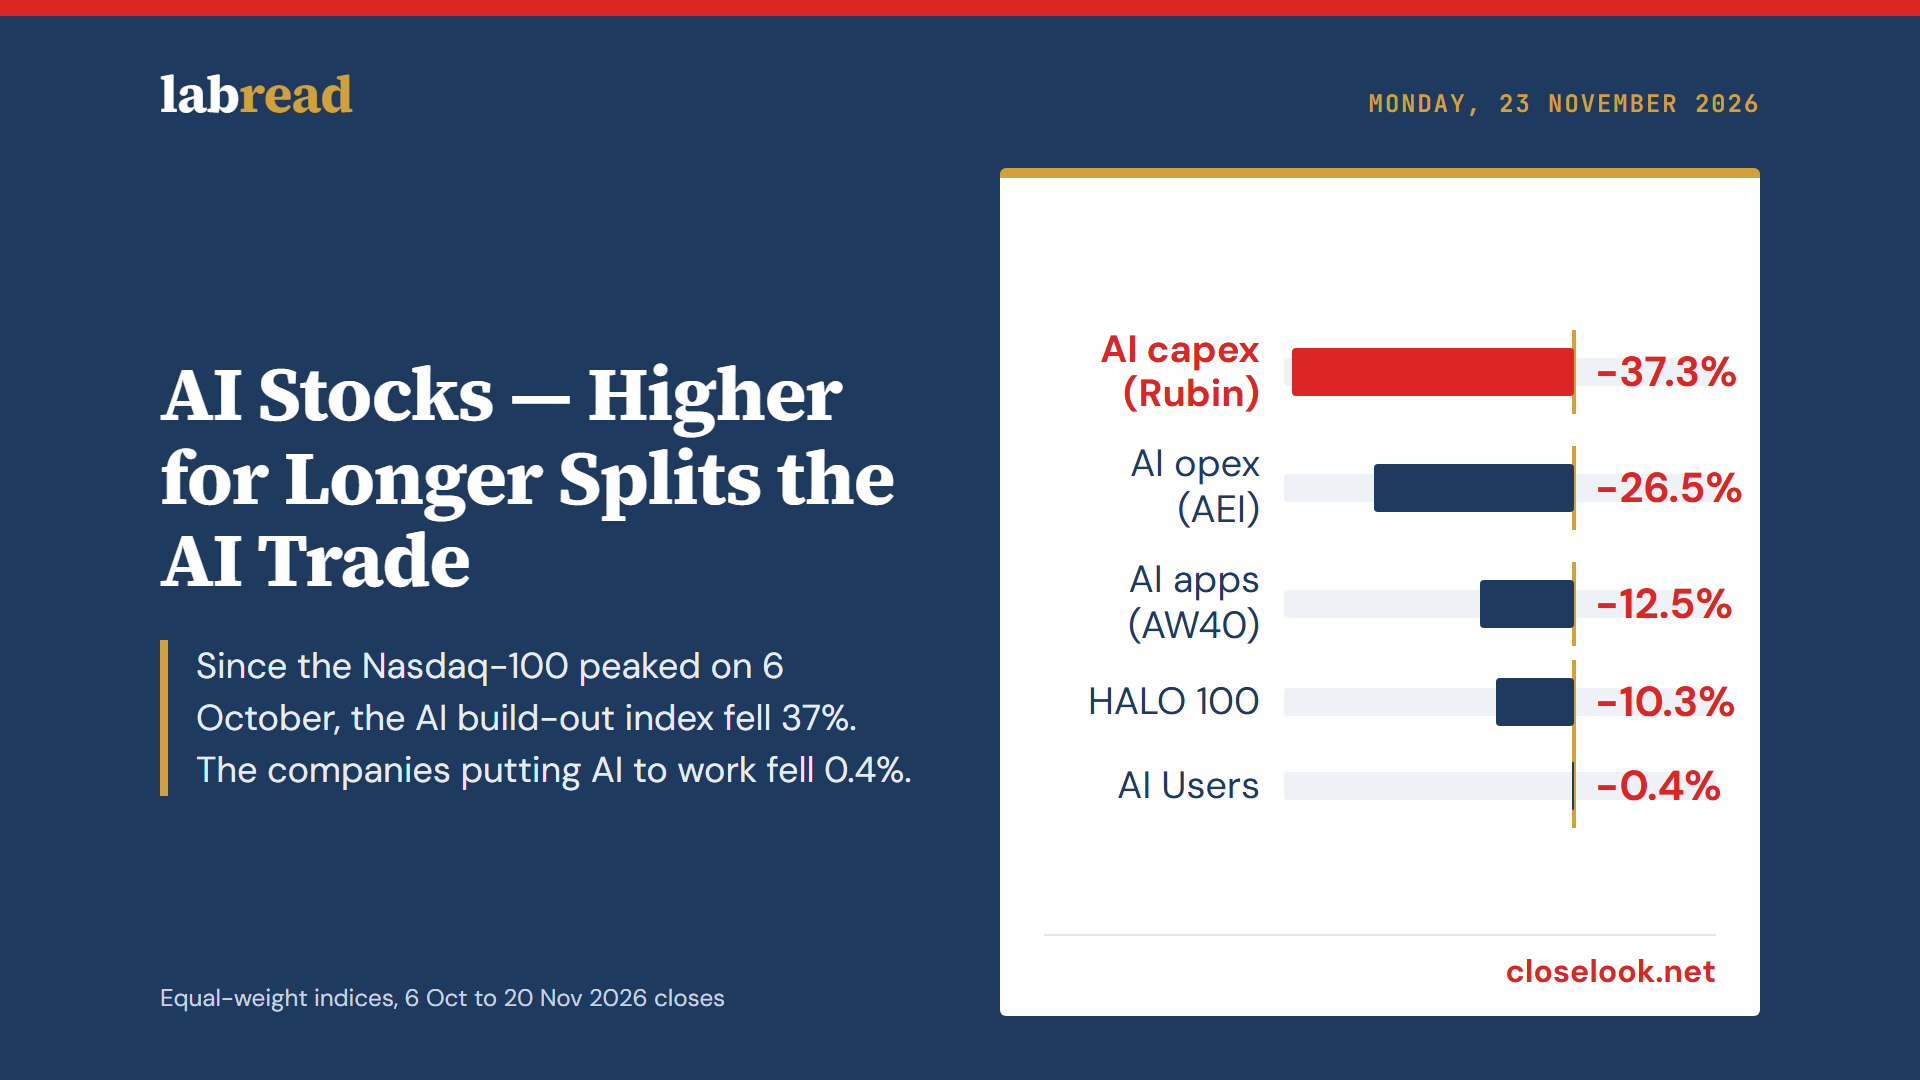
Futures now price a Fed that stays high into 2028. Since the Nasdaq-100 peaked on 6 October the AI build-out index fell 37% and the companies putting AI to work 0.4%. What a lasting extra point of rates does to each layer’s multiple, who has to borrow, how the regions split, and what selling a one-year put paid after the November fall.

A Lab Read on what a Federal Reserve that keeps rates high into 2028 does to the AI trade, layer by layer and region by region, and what selling options pays after the November fall. Prices are the closes of Friday 20 November 2026; rates come from the futures and bill data on our Rate Path board; valuations are median forward price-to-earnings ratios of each index’s members. Diary framing throughout: this is how we read the data and what we watch, not what anyone should do with it.
The cost of money turned in September
For the first half of 2026 the price of overnight money in the US fell. The 30-day average of SOFR, the rate banks pay to borrow against Treasuries overnight, bottomed at 3.59% on 1 June. Through the summer the 30-day, 90-day and 180-day averages sat on top of each other, which is what a quiet policy rate looks like.
Then the Fed raised its target range in September to 3.75–4.00%. The 30-day average, the fastest of the three, climbed first and crossed above the 180-day average on 21 September. On Friday it stood at 3.92%, above the 90-day at 3.84% and the 180-day at 3.76%. When the short average leads the long ones, funding costs are still rising.
The Fed held at its 27–28 October meeting, with two of twelve voters asking for another quarter point. Futures now fully price a quarter-point increase at the 8–9 December meeting, another move in January and at least one more before the end of 2027 (CME FedWatch, as reported by CNBC on 18 November). On the same day Governor Waller said a half-point step in December is probably necessary unless a quarter point comes with a clear signal for January, and that the Fed must reverse the three cuts of 2025 and may need to go further.
How long, not how high
A rate rise that comes back down within a year is a squall. One that stays is a new level, and stocks are priced off the level. The futures strip says this one stays. The three-month SOFR futures price a peak of 4.51% for the quarter from September to December 2027, 60 basis points above today’s overnight rate. The path is flat for a full year, from March 2027 to March 2028. Only a third of the rise is given back after that, and three years out the contract for December 2029 still holds 70% of the move. Our Rate Path board labels that shape “a new level: higher for much longer”.
The durability gauge on the board is the rate priced six to twelve months ahead. It reads 4.45%, 57 basis points above the effective fed funds rate. It climbed 75 basis points in thirteen weeks to 4.74% on 28 September, the steepest build-up of the year.
The chart shows the same story for the second half of 2027. In February futures priced 2.90% for that half-year. The first step came in spring, to 3.87% by late May. The second came around the September hike: 4.55% on 11 September, 4.70% on 2 October, and a high of 4.75% on 13 November. The regime change was the run-up into autumn.
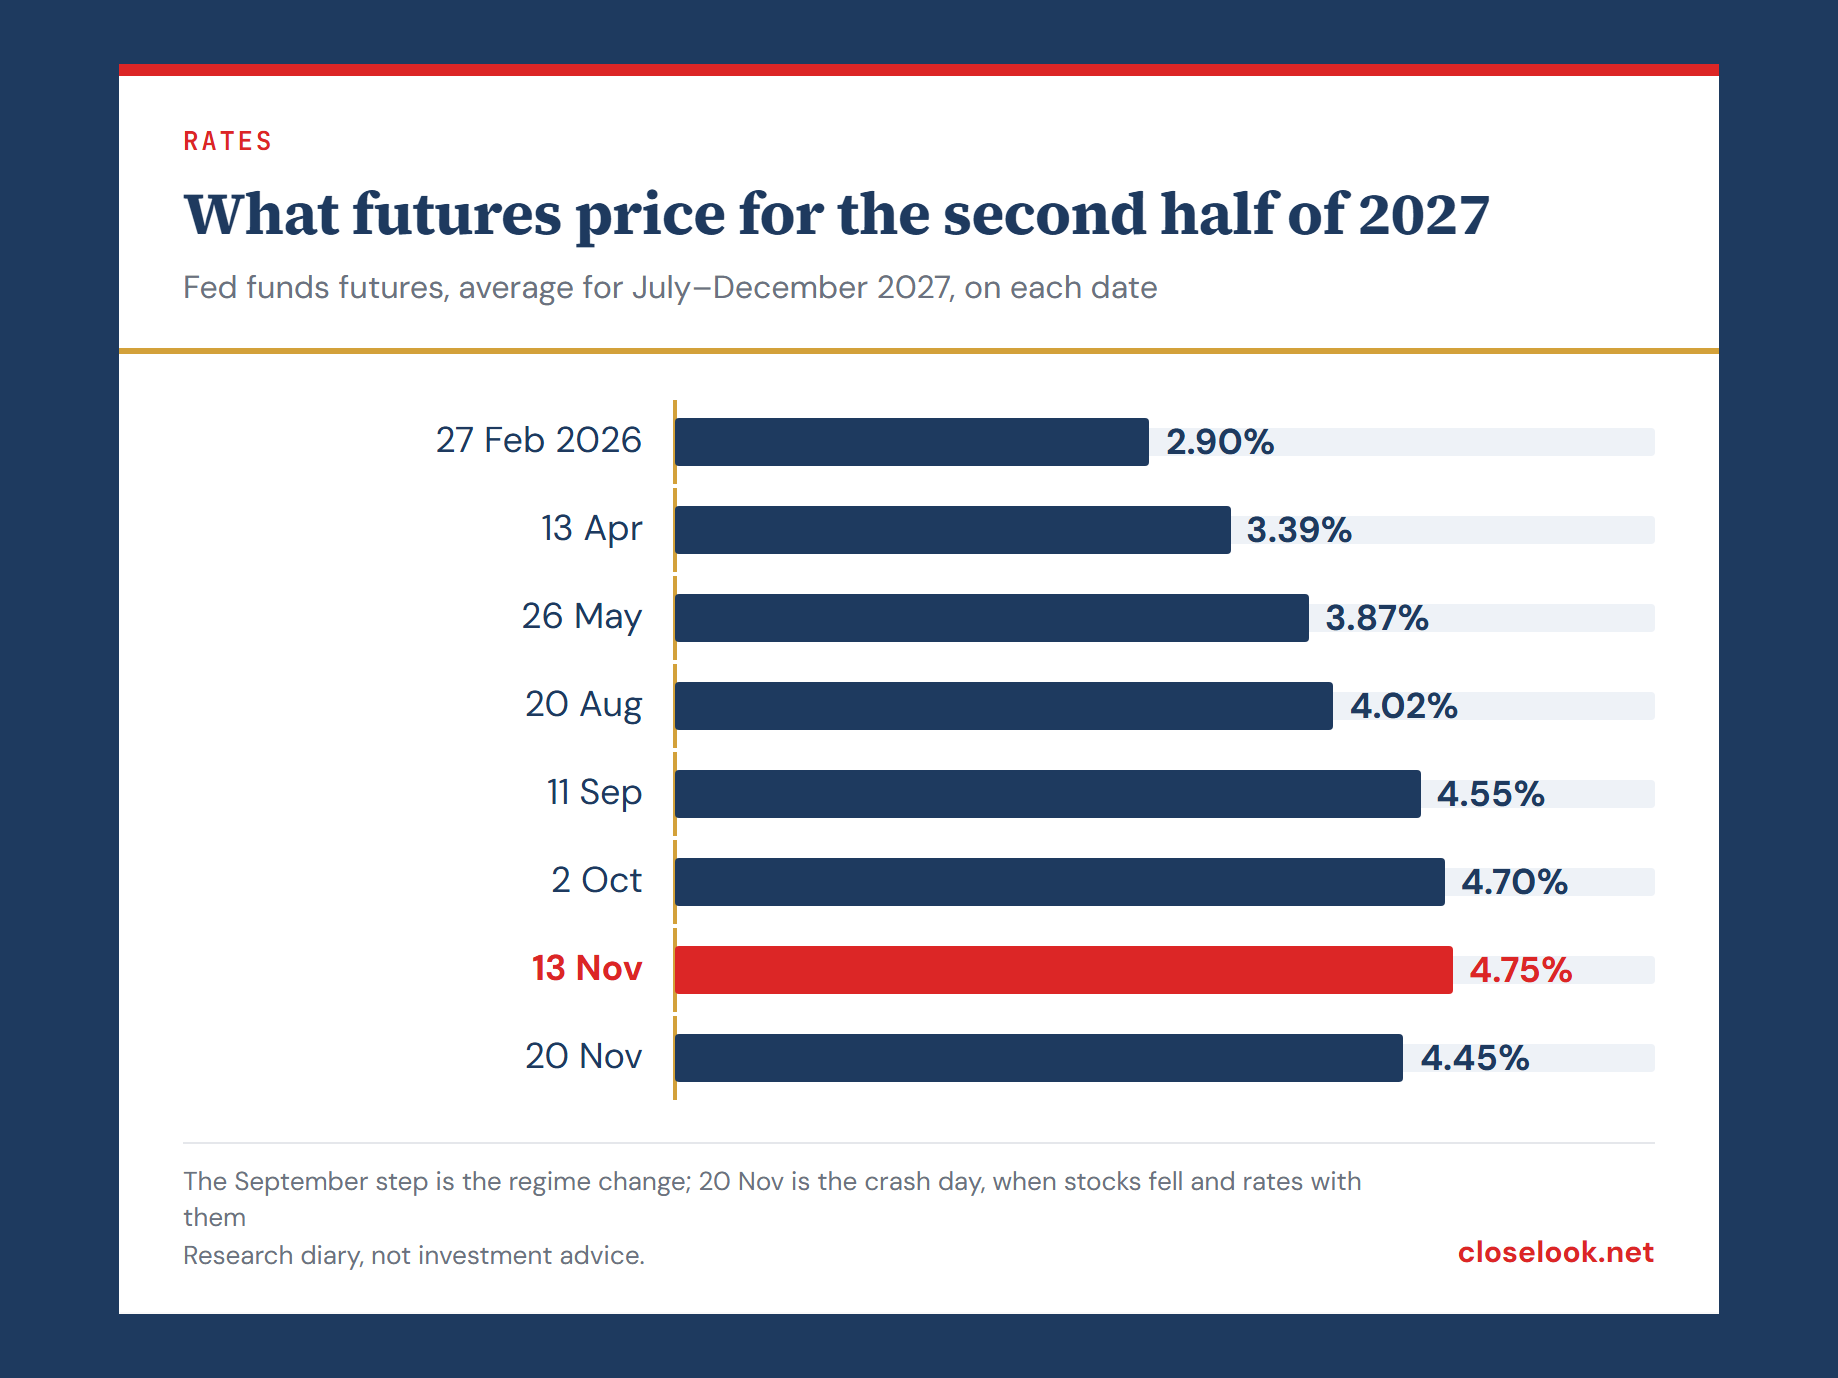
Friday 20 November was the other side of it. Stocks crashed and the second-half-2027 rate fell 19.6 basis points in a day; the six-to-twelve-month gauge fell 18.5, 3.3 times a normal day’s move. That is the usual pattern of a sell-off: money runs to safety and rate expectations drop with stocks. It does not undo a regime by itself. One day lower after a ten-month climb leaves the second half of 2027 priced 155 basis points above where it stood in February.
What a lasting point does to a multiple
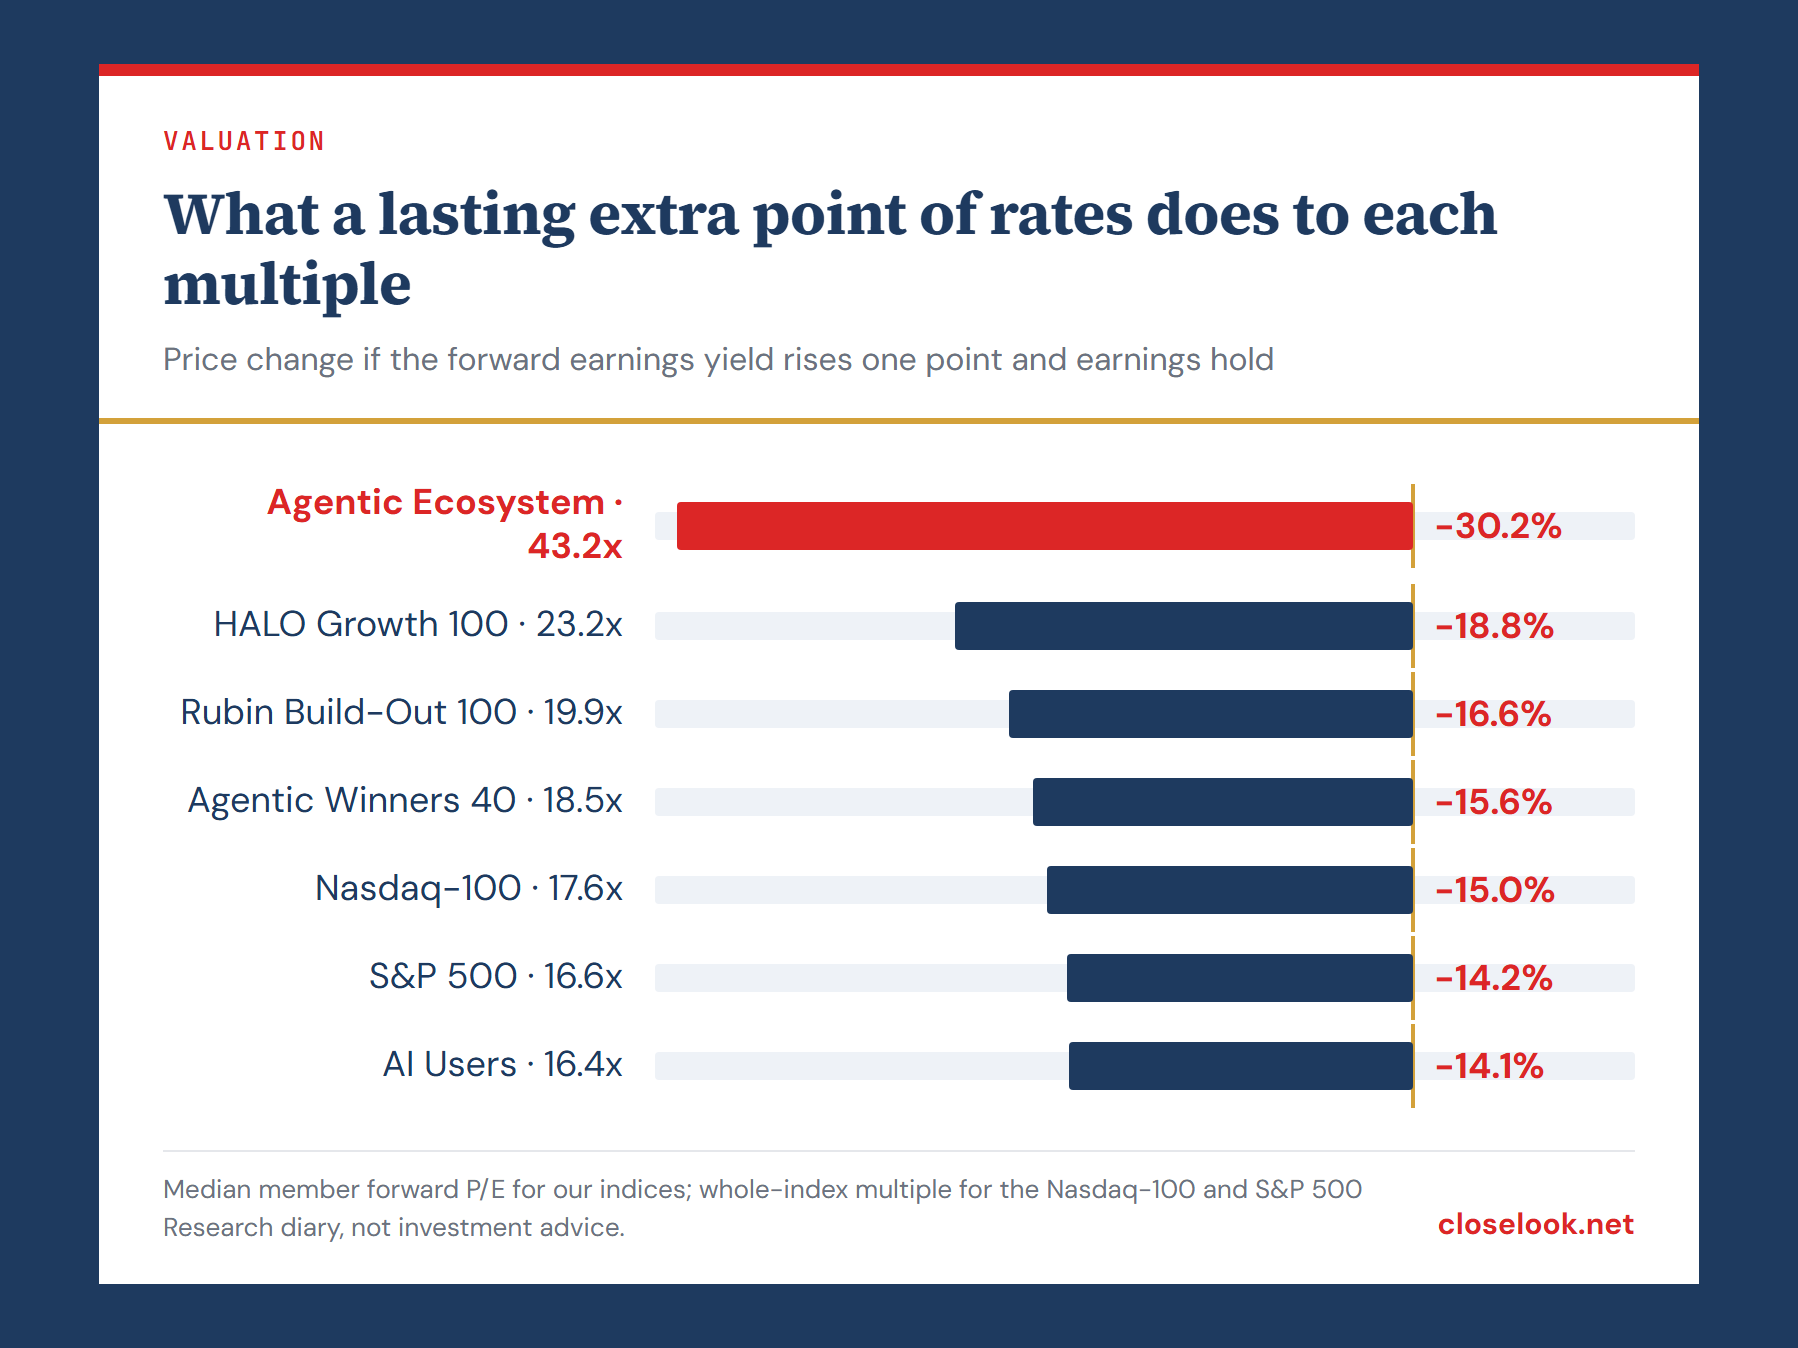
A price-to-earnings ratio is the inverse of an earnings yield: a stock on 20 times earnings yields 5%. If investors demand one extra point of yield for good, because cash and bonds now pay more, the multiple has to fall to the level where the yield is one point higher. With earnings unchanged, the price falls by the same share. The arithmetic is unkind to high multiples: a stock on 16 times loses about 14%, a stock on 43 times loses about 30%.
The S&P 500 trades at 16.6 times forward earnings (FactSet’s forward earnings per share of 5 November, on Friday’s close). Its earnings yield of 6.02% sits 1.11 points above the 10-year Treasury yield of 4.91%. On 31 December 2025 the gap was 0.37 points at 22 times. The Nasdaq-100 as a whole trades at 17.6 times, a premium of 0.77 points; its median member is dearer, at 21.1 times.
A lasting extra point would take the S&P 500 down about 14% and the Nasdaq-100 about 15%; if only half of it sticks, about 8%. A full point plus 10% lower earnings comes to about 23% for both indices, the size of the 2018 fall from peak to low. The 2022 fall, about 35%, needs a dearer index or a deeper earnings cut: the same point and the same cut take an index on 43 times down 37%. Whether this turns out like 2018/19, when the Fed stopped and stocks recovered within months, or like 2022, when it kept going, is the question of this week’s Weekly Signal; the side-by-side is on Rate Impact. So far the Nasdaq-100 has fallen 19.8% in the 33 sessions since its 6 October peak, faster than in either year, and four of the six weeks after the peak were growth scares, with stocks and rate expectations falling together. That is the 2018 pattern.
Gold, bitcoin and long bonds
Assets with no earnings to grow into a higher rate should suffer most when cash pays more. The direction fits. Since the September hike the gold fund GLD is down 19.0% and bitcoin 23.0%. From their highs the gold fund is down 34.9% (29 January 2026) and bitcoin 52.9% (6 October 2025).
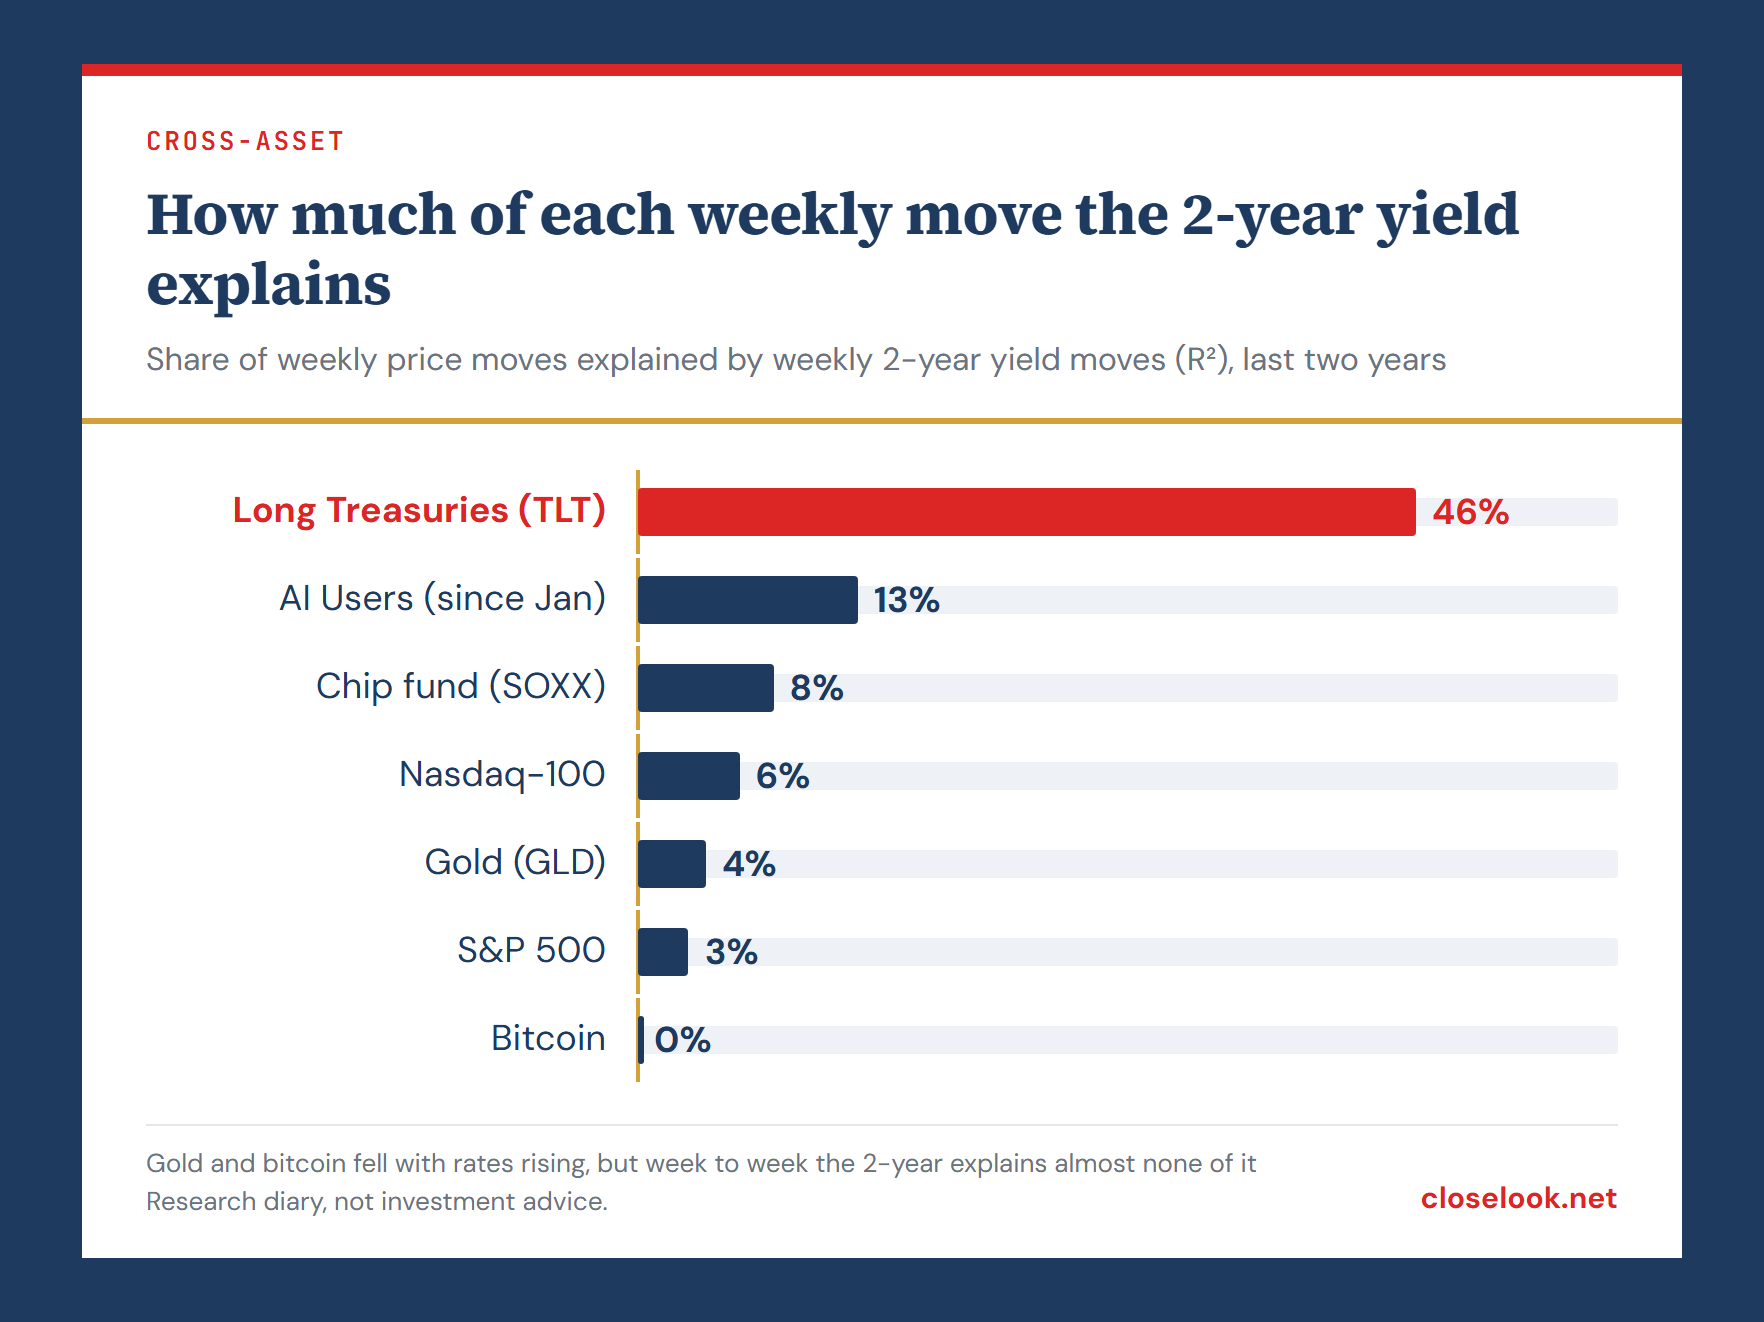
The weekly data is less tidy. Over the last two years, weekly moves in the 2-year Treasury yield explain 46% of the weekly moves in long Treasuries, which is what a bond does. They explain 4% of gold’s weekly moves and none of bitcoin’s. For the Nasdaq-100 the figure is 6%, for the chip fund 8%. Rates set the level that stocks and gold are measured against, but week to week the price of bitcoin and gold follows its own buyers. Both broke their trend lines from the 2022 lows on their own schedule, as our bull-markets Lab Read showed last week.
For a reader of rates, the cleanest transmission is in two places: long bonds, and multiples. Gold and bitcoin are better read as positioning trades that a rising rate made more expensive to hold than as rate instruments.
Inside the AI trade: four layers, four multiples
We follow the AI economy through four indices, one per layer of who earns from it. Rubin Build-Out 100 holds the capital spending: chips, chip equipment, power and cooling. The Agentic Ecosystem holds the running costs: model labs, AI clouds, networks, data platforms and security. Agentic Winners 40 holds the platforms and software that sell AI. AI Users holds 40 companies that put AI to work in their own business, from banks and retailers to drug makers and IT services firms.
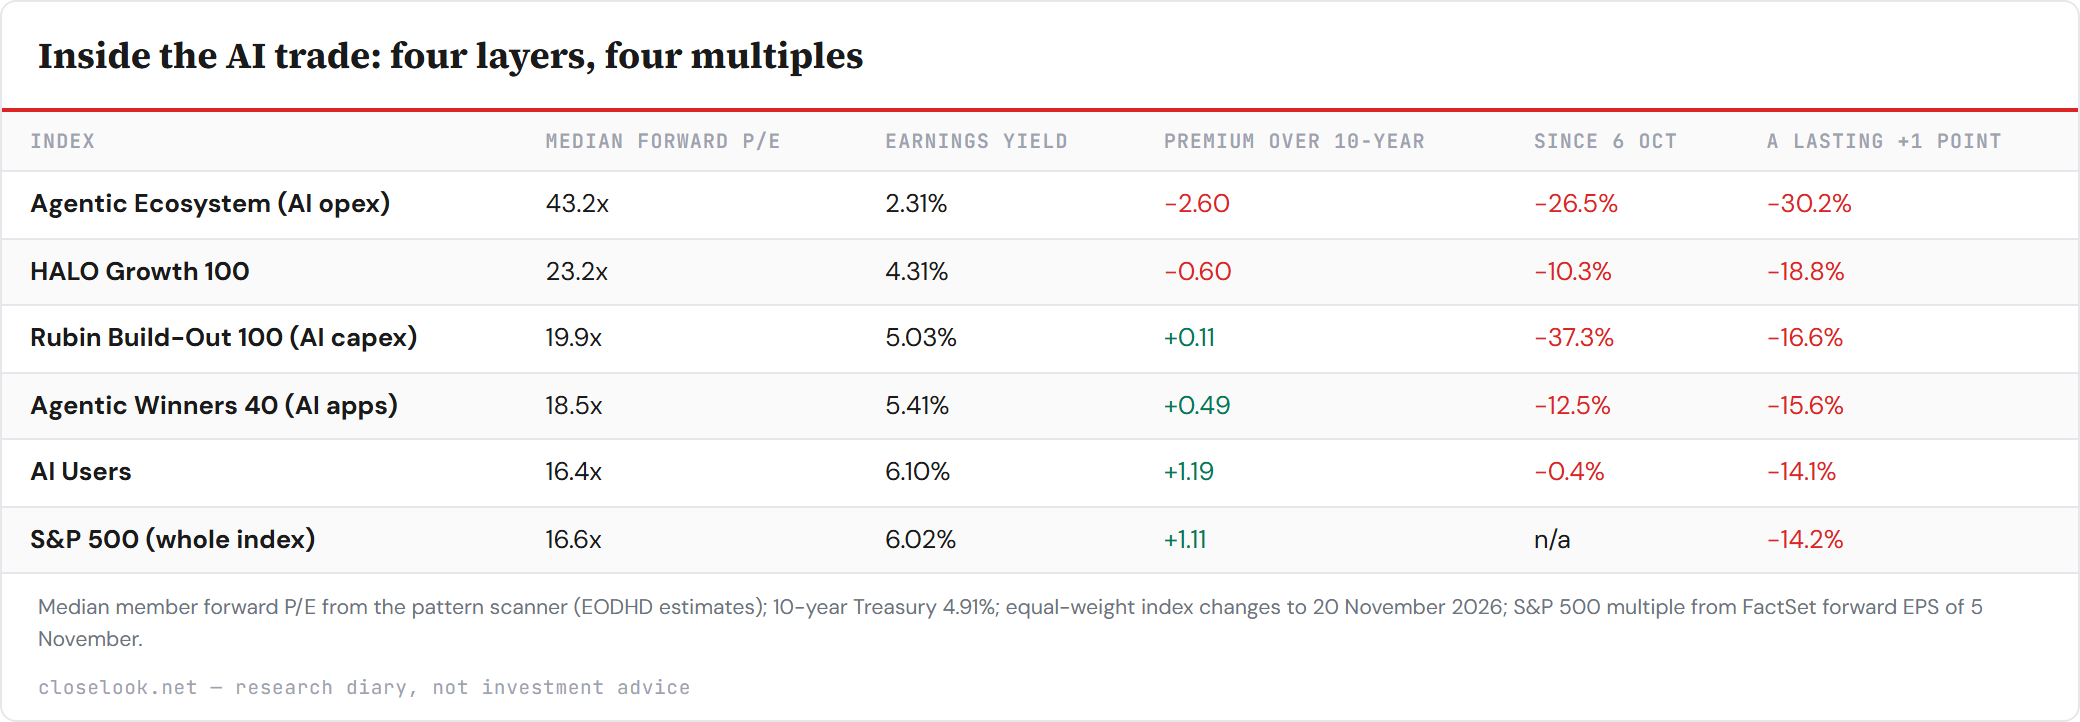
Table as text
| Index | Median forward P/E | Earnings yield | Premium over 10-year | Since 6 Oct | A lasting +1 point |
|---|---|---|---|---|---|
| Agentic Ecosystem (AI opex) | 43.2x | 2.31% | −2.60 | −26.5% | −30.2% |
| HALO Growth 100 | 23.2x | 4.31% | −0.60 | −10.3% | −18.8% |
| Rubin Build-Out 100 (AI capex) | 19.9x | 5.03% | +0.11 | −37.3% | −16.6% |
| Agentic Winners 40 (AI apps) | 18.5x | 5.41% | +0.49 | −12.5% | −15.6% |
| AI Users | 16.4x | 6.10% | +1.19 | −0.4% | −14.1% |
| S&P 500 (whole index) | 16.6x | 6.02% | +1.11 | n/a | −14.2% |
Median member forward P/E from the pattern scanner (EODHD estimates); 10-year Treasury 4.91%; equal-weight index changes to 20 November 2026; S&P 500 multiple from FactSet forward EPS of 5 November.
Two layers broke and two held. The AI opex index is the dearest by far: its median member earns 2.31% on its price, less than overnight cash, so its holders are paying for profits several years out. That is the layer a longer rate hurts most on paper, and it fell 26.5% from the Nasdaq-100’s peak.
The capex layer looks cheaper, at 19.9 times, and still fell hardest, 37.3%, and 44.4% from its 22 June high. Its forward earnings are the earnings of a build-out at full speed: Micron trades on about four times forward earnings. The market is questioning those earnings, not the multiple. Higher funding costs for the customers who pay for the build-out are one reason it would.
AI Users barely moved. It is the cheapest index, with a premium over the 10-year of 1.19 points, and the only one of ours where weekly rate moves leave a measurable mark: since January it has slipped about 9% per point of 2-year yield, with the 2-year explaining 13% of its weekly moves. The rate link is visible there, and it is small.
Who pays for the build-out
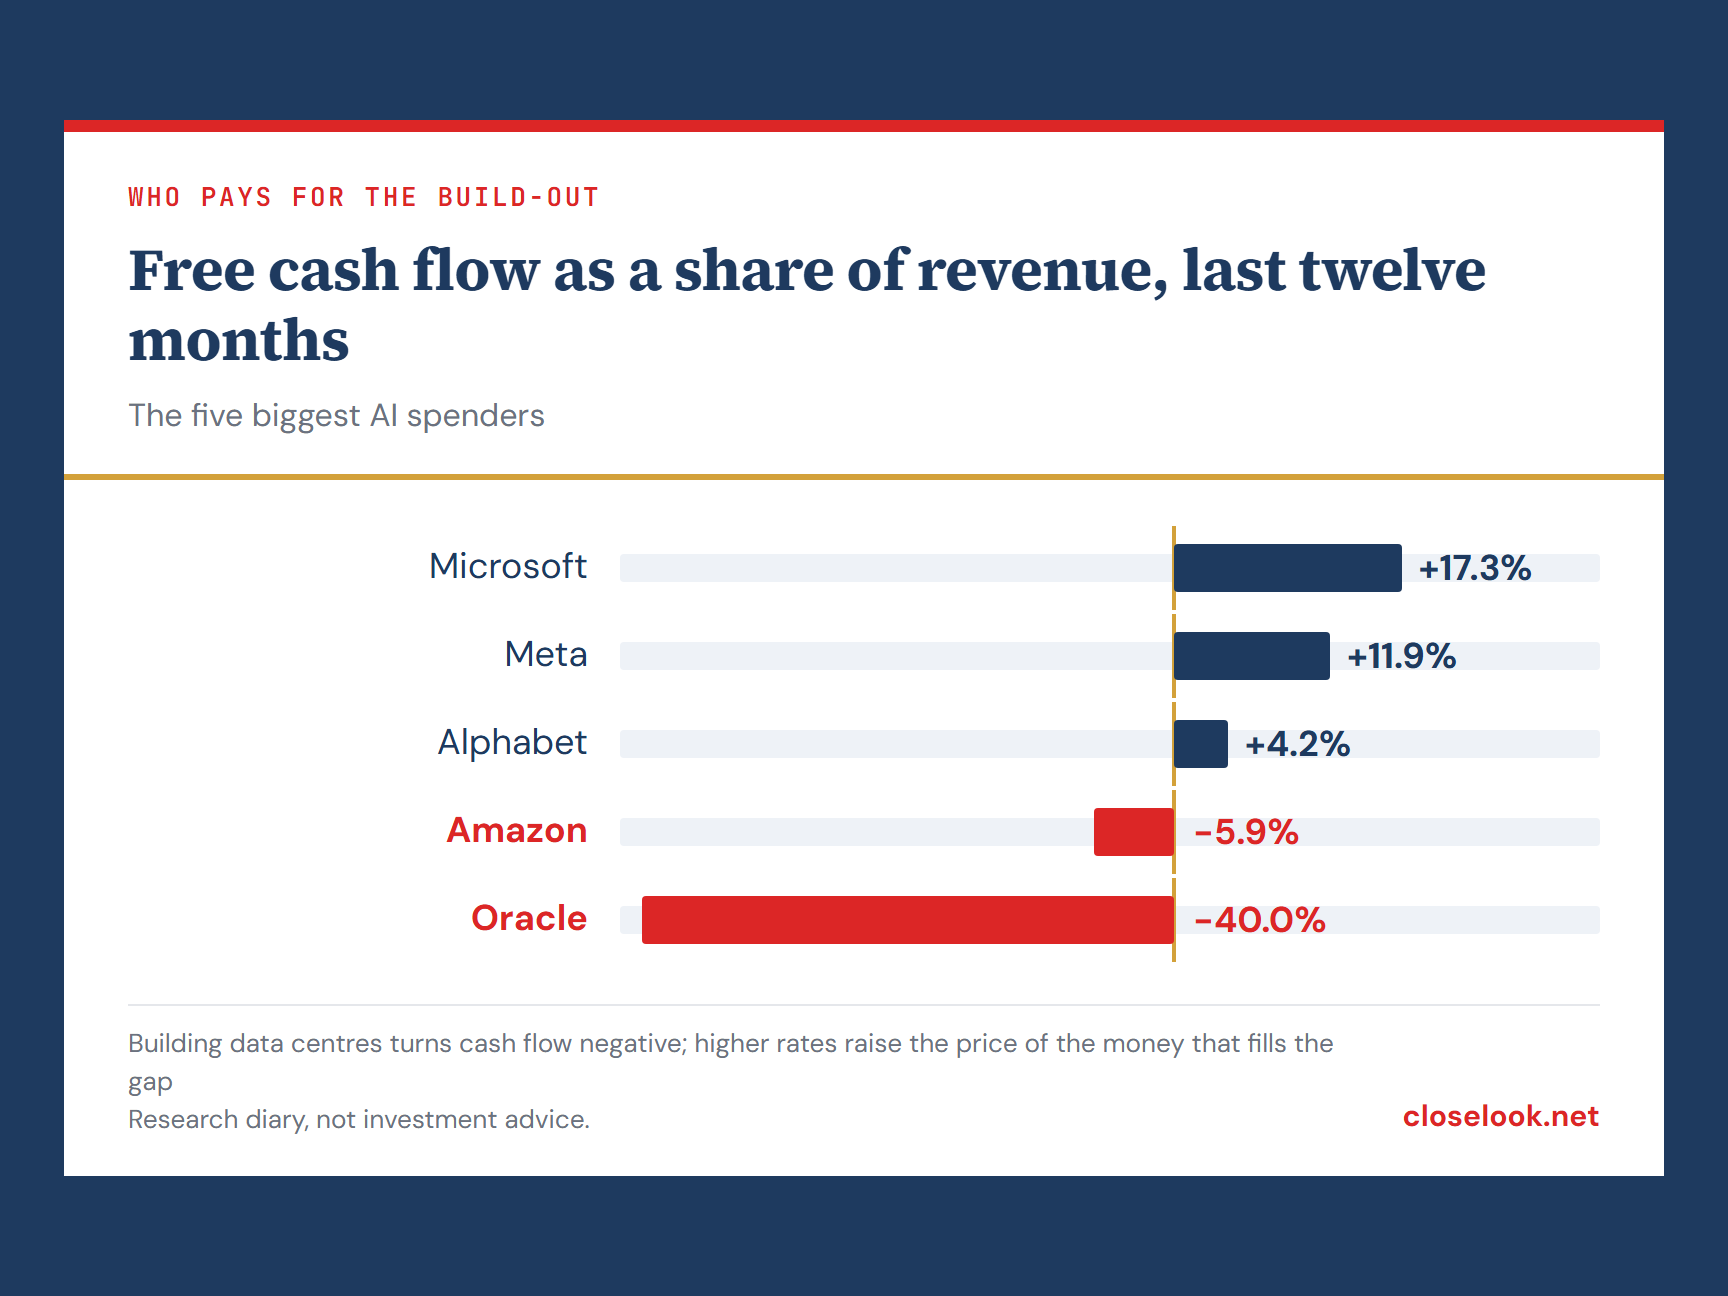
Higher for longer is a valuation problem for some companies and a funding problem for others. The build-out is paid for by a handful of spenders, and for three of the five biggest the free cash flow, the cash left after running the business and building data centres, is thin or negative. Over the last twelve months Microsoft kept 17.3% of revenue as free cash, Meta 11.9% and Alphabet 4.2%. Amazon’s free cash flow was negative, at −5.9% of revenue, and Oracle’s was −40%. A second data vendor shows lower figures for Alphabet, Meta and Oracle. When the cash runs out the gap is filled with bonds, loans and leases, at today’s rates. The Fed’s October minutes noted that most participants saw AI-related debt growing through “complex and opaque financing structures”.
The same test runs through our indices. Among US-listed members volatile enough to interest an option seller, we checked three things: a market value of at least $10 billion, net cash or net debt of no more than 1.5 times operating earnings before depreciation, and free cash flow of at least 10% of revenue. In the capex index, 43 of 70 names fail one of them, many on size. In AI opex 12 of 27 fail, in AI apps 13 of 26, among AI Users 1 of 8. The AI clouds fail by the widest margin: Nebius carries net debt of 14.2 times its operating earnings and CoreWeave 11.9 times. For them a longer high rate is a refinancing schedule, and it arrives whatever the multiple does.
US, Europe and Asia
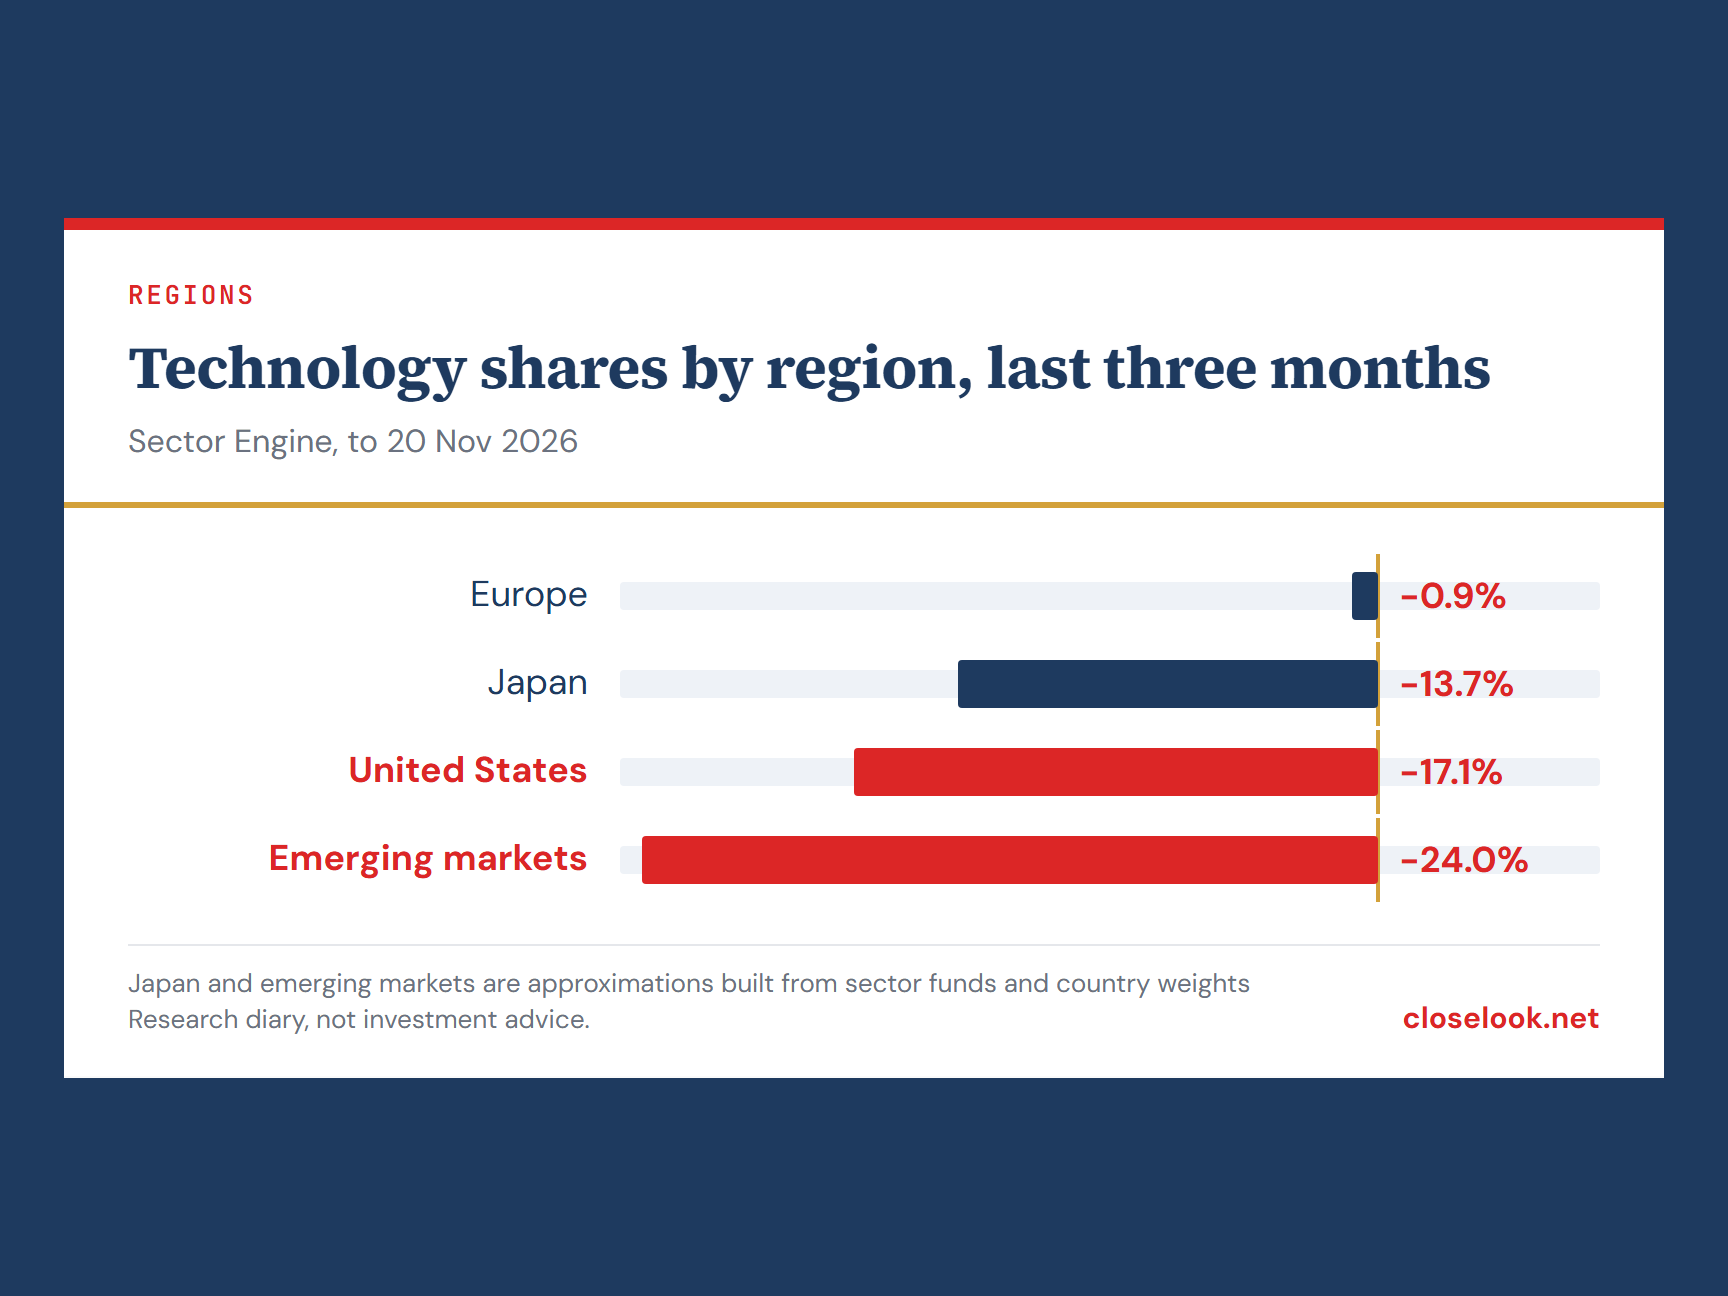
The fall in technology shares was not even across the world. Over the three months to 20 November, technology lost 0.9% in Europe, 13.7% in Japan, 17.1% in the US and 24.0% in emerging markets, according to our Sector Engine; the Japan and emerging-market figures are approximations built from sector funds and country weights. Europe held best. Emerging-market technology, where the chip and memory makers of Taiwan and Korea weigh most, fell most.
The physical layer of AI sits in Asia. Of the 130 members of the Rubin index, 25 are listed in Japan, 11 in Taiwan and 3 in Korea; 22 are European and 62 American. The power side shows the same split: utilities gained 3.4% in Europe over the three months and lost 0.5% in the US. Industrials fell 11% to 15% in every region, which reads as a global capex slowdown being priced, not a US one.
This piece reads the US rate path. How the European Central Bank and the Bank of Japan answer is outside the data here, and a different path abroad would change the regional picture faster than anything in this section.
The barbell, as a method
A barbell holds the two ends and skips the middle. In a market that prices a higher rate for longer, the safe end pays again: overnight cash earns 3.91%, and the futures-implied rate to December 2027 averages about 4.4%. Everything at the risky end has to beat that. The S&P 500’s earnings yield of 6.02% and the AI Users index at 6.10% do; the Nasdaq-100 at 5.68% does narrowly; the AI opex index at 2.31% does not, and only grows into its price if its earnings rise fast for years.
The middle that suffers is everything priced off a long rate: long bonds, the only asset here where the 2-year explains half the weekly moves, and long-dated growth that yields less than cash. Our weekly data puts the line between the ends in a specific place for 2026. The companies putting AI to work and the companies with cash to spare are on the safe side of it. The layers that need years of growth or fresh borrowing are on the other.
The editor’s own books run a version of this, logged on Portfolios: cash that earns the short rate, puts sold against that cash, calls written on shares held. That is a record of what one investor does, not a template.
Selling volatility after the fall
When stocks fall, options get expensive. A put gives its buyer the right to sell a stock at a fixed price, the strike, and its seller collects a premium for promising to buy at that price. After the November fall, 129 of the 164 US-listed members of our four AI indices carried implied volatility of 45% a year or more.
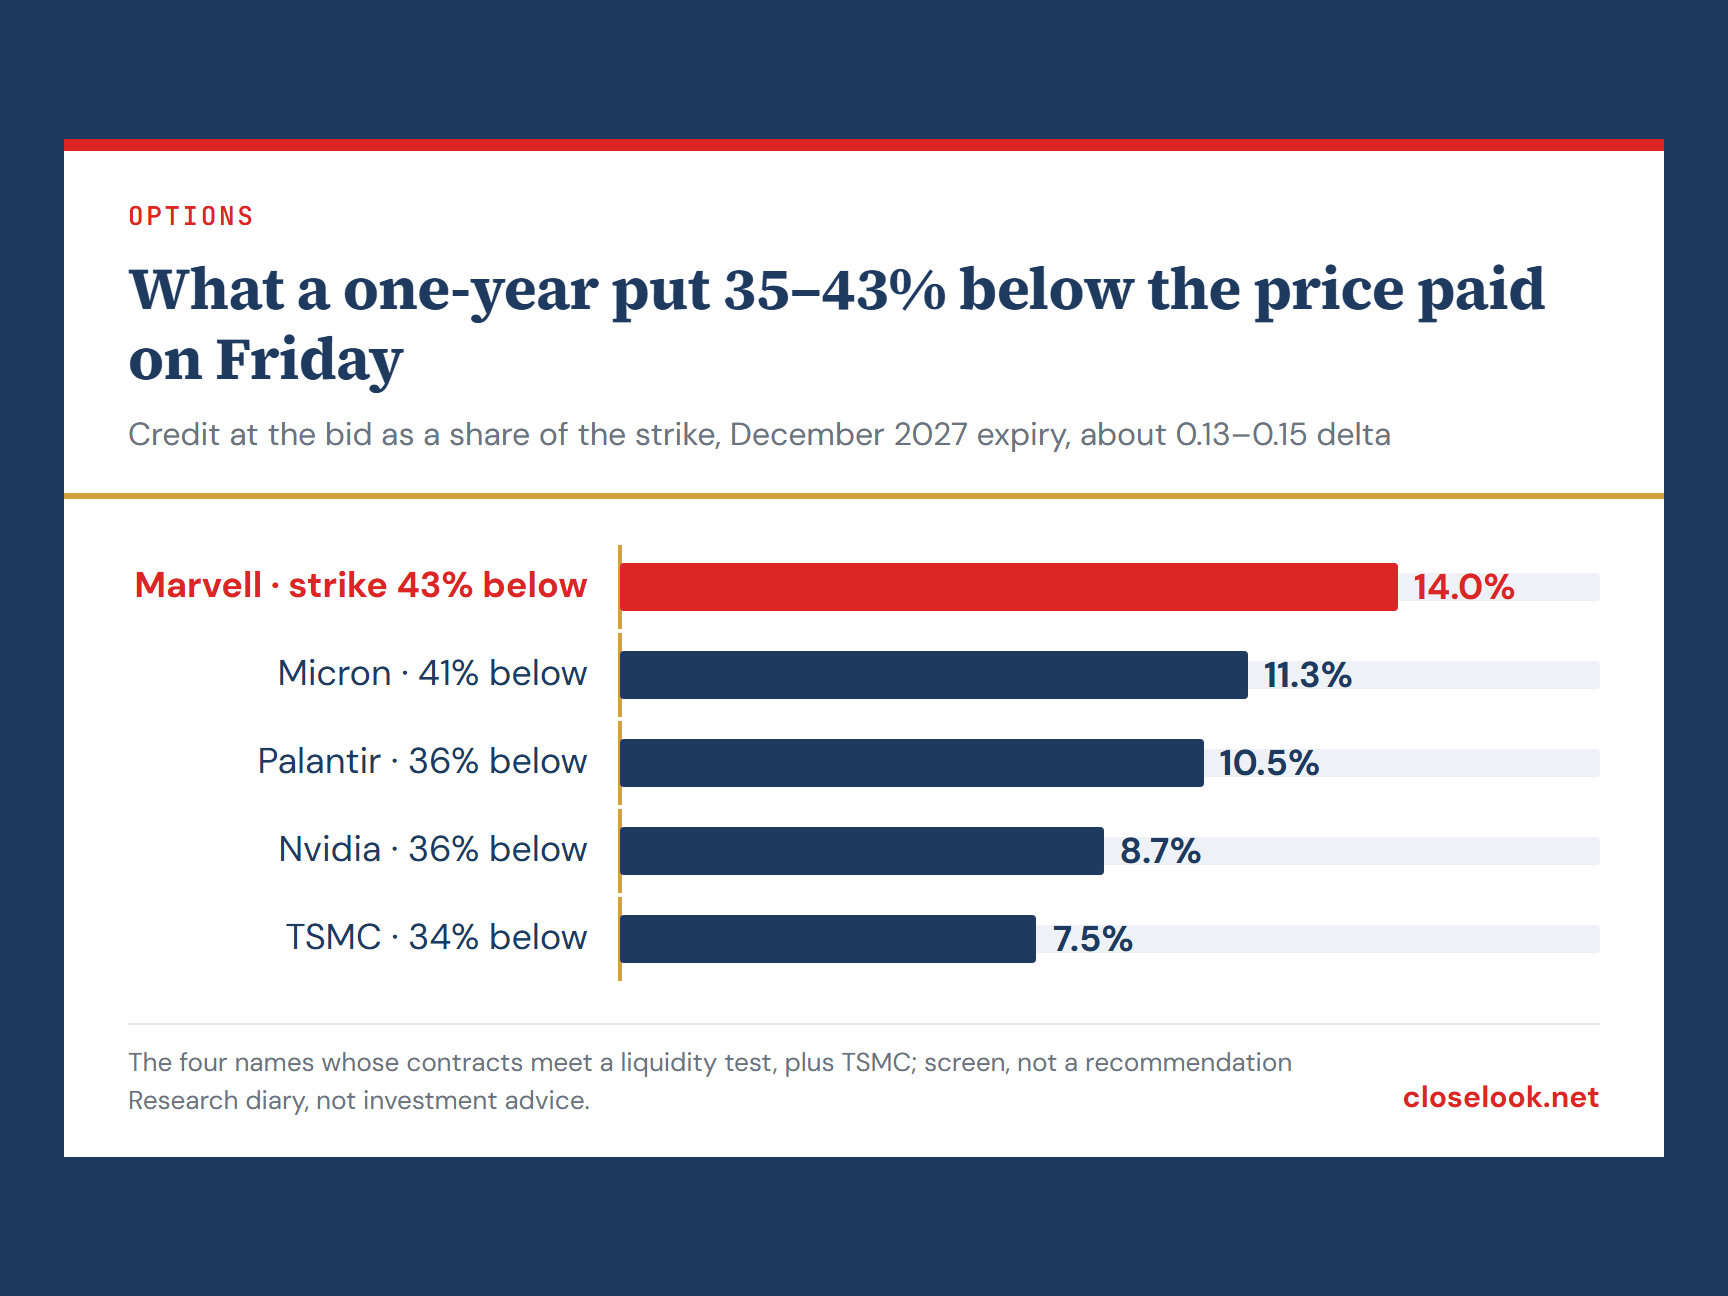
We read puts expiring in late 2027 with a strike far below Friday’s price: a delta of 0.10 to 0.15, which the option market prices as roughly a one-in-seven to one-in-ten chance of the stock ending below the strike. On the 55 names that pass the size, debt and cash-flow test, those strikes sit 28% to 44% under the price. Selling one at the bid would collect up to about 15% of the strike, among them Marvell 14.0%, Micron 11.3% and TSMC 7.5%, and less on the calmer software names. Only four of them trade with tight prices and real open interest at a year out: Marvell, Micron, Palantir and Nvidia.
A common rule is to take half the premium and roll into a new contract. On these puts half does not come quickly. With price and volatility unchanged, time alone halves the value of a December 2027 put after 155 to 196 days. Faster takes a rally of 15% to 39% within 60 days, or implied volatility 10 to 25 points lower within 30 days. Calls on the same names a similar distance up pay little: at most 3.3% of the price at the bid. After a fall the market pays for protection against the next one.
The premium pays for a real risk. The same names fell this year by as much as the strikes sit below today’s price: SK Hynix 48% from its high, Micron 51%, Vertiv 56%. A put 40% below the price is a promise to buy after a fall the past year has already delivered once.
What would change the read
- The duration: the six-to-twelve-month gauge falling back toward 25 basis points over fed funds, from 57, would turn a new level back into a hump.
- The Fed on 8–9 December: a half-point step, or a quarter point with a signal for January, extends the plateau; a quarter point with no guidance shortens it.
- The dearest layer: the AI opex index’s premium over the 10-year turning positive, from −2.60, would mean its prices or the yield have done the adjusting.
- The cash flow: free-cash-flow margins at the five big spenders turning back up would take the funding question off the capex layer.
- The split itself: AI Users falling with the build-out, rather than holding, would mean the market has moved from pricing rates to pricing a slowdown.
Higher for longer is three things at once: a level, a duration and a test of who can pay for themselves. On Friday’s closes, the AI trade has priced the first, half-priced the second, and is only starting on the third.
How we measured
Overnight rates and averages: New York Fed SOFR series via FRED. Rate path and durability gauge: three-month SOFR futures and 30-day fed funds futures (CME, via Yahoo Finance), as on Rate Path. Fed decisions and market pricing: our macro-facts record, from dated reports. Index levels: Closelooknet index workers, equal-weight composites. Forward P/E and free-cash-flow margins: the Closelooknet pattern scanner (EODHD fundamentals); the second vendor is Yahoo Finance. S&P 500 forward earnings: FactSet Earnings Insight, 6 November 2026. Weekly rate regressions: Rate Impact, the last two years of weekly closes. Regional sector returns: the Closelooknet Sector Engine. Options: Yahoo Finance end-of-day chains on 20 November 2026; implied volatility and delta recomputed from each bid/ask midpoint with the futures-implied rate to expiry. Gold and bitcoin: Yahoo Finance closes of GLD and BTC-USD.