Daily Pulse · · 10:45 CET · 7 min read · macro · TLT


In this edition
Pattern alerts
- TLT 80.46-minus-1.58-10-year-5.114-5-year-touched-5-first-since-2007 BEARISH
- SHY 2-year-4.90-plus-67bp-in-21-sessions-leads-the-curve-bear-flattener BEARISH
- KRE 70.38-minus-5.9-in-a-month-banks-fall-while-rates-rise-amber WARNING
- IWM 281.92-minus-5.4-in-a-month-floating-rate-borrowers-marked-down BEARISH
- UUP dollar-index-101.1-plus-2-in-a-month-yields-and-dollar-up-together-no-debt-scare NEUTRAL
The five-year Treasury yield touched 5% on Wednesday for the first time since 2007, and the ten-year closed at 5.114%, up nearly fifteen basis points in one session. A basis point is a hundredth of a percentage point. This morning Japan's ten-year government bond yield jumped to 3.08% in Tokyo's first session after three days of holidays, and the German ten-year is at 3.57%, the highest of the past year. Rates are rising everywhere at once. The question that decides what this means for stocks is simple: are yields rising because the economy is strong, or because investors are starting to worry about how much the US government owes? Today's diary entry runs the tests, maps the levels in the US, Europe and Japan, and reads what the futures market expects the Fed to do in 2026 and 2027.
The curve: the short end is doing the pushing
The yield curve is the line that joins the yields of short and long government bonds. Which end moves first tells you who is behind a sell-off. When short-dated yields rise fastest, investors are pricing a central bank that keeps raising rates, usually because growth and inflation are strong. When long-dated yields lead, investors are demanding extra pay for lending to the government for decades, and that is where debt worries show up.
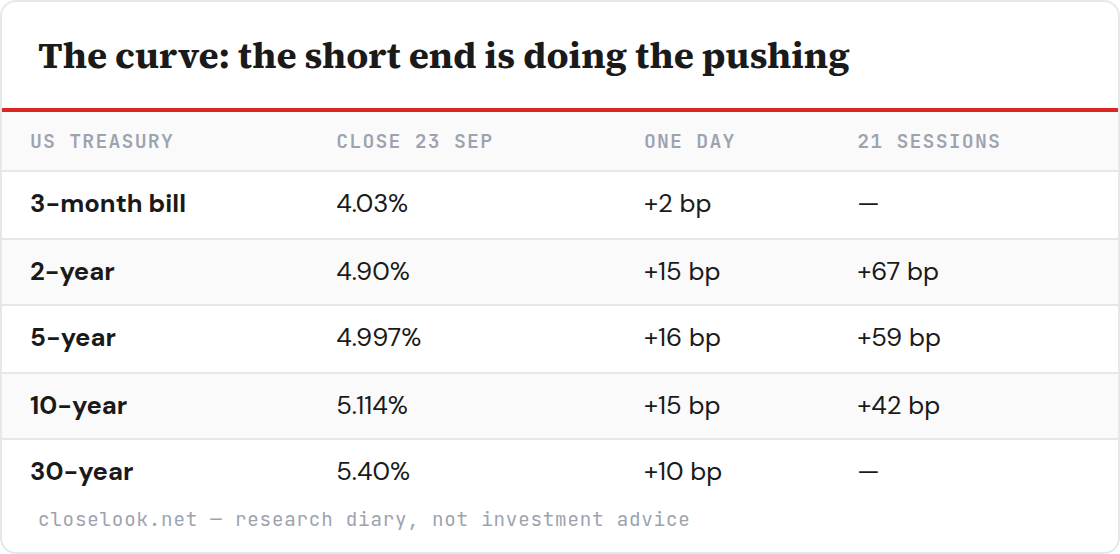
Table as text
| US Treasury | Close 23 Sep | One day | 21 sessions |
|---|---|---|---|
| 3-month bill | 4.03% | +2 bp | — |
| 2-year | 4.90% | +15 bp | +67 bp |
| 5-year | 4.997% | +16 bp | +59 bp |
| 10-year | 5.114% | +15 bp | +42 bp |
| 30-year | 5.40% | +10 bp | — |
Every point on the curve, from the three-month bill to the thirty-year bond, closed Wednesday at its highest level of the past twelve months. The ten-year and the thirty-year closed at their highest since 2007; the five-year touched 5% for the first time since then.
Over the past month the two-year rose 67 basis points and the ten-year 42. The gap between them, the most-watched slope of the curve, narrowed from 47 basis points to 21. Economists call a curve that flattens while yields rise a bear flattener. It is the signature of a Fed that has started raising rates, which it did on 16 September for the first time since 2023, taking its range to 3.75–4.00%, and of a bond market that expects more. The two-year now sits about 90 basis points above the top of that range.
C — free account
The free C account unlocks the full Daily Pulse — every section of this read.
One tap with Google or one email — no password, no card. You are signed in until you sign out, on this browser, from then on.
Join the Look — freeAlready joined on this browser? The full edition shows automatically — if it doesn't, sign in again here. Looking for the archive, portfolios and realtime? That is C+.
One more block on our desk — tomorrow's levels and what we're watching into the next session. Join the Look — it’s free.