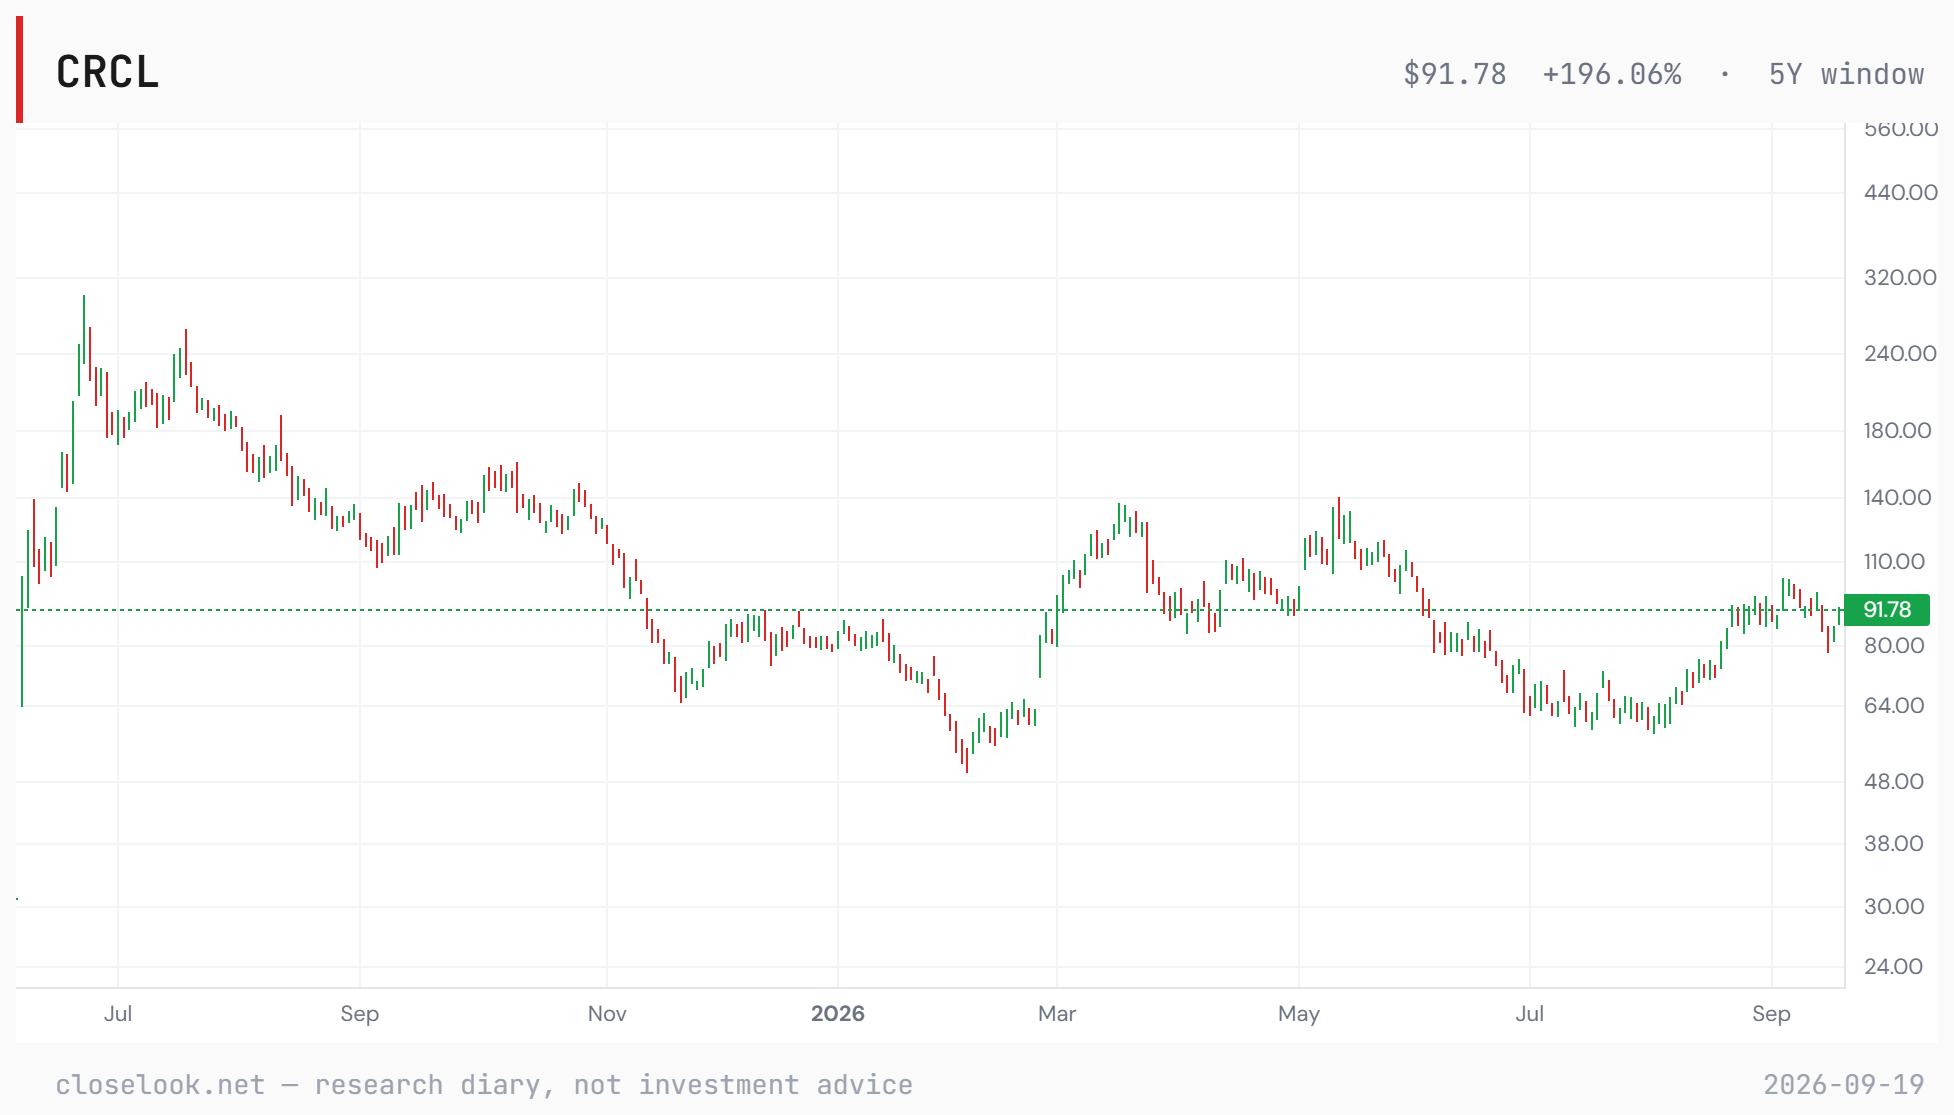
What is Circle Internet Group, Inc. (CRCL)?
Circle Internet Group, Inc. trades as CRCL on the US exchange (US) in the Closelooknet research universe, as of the registry build of 2026-10-31.
Is CRCL in a Closelooknet index?
Not currently — Circle Internet Group, Inc. is tracked in the Closelooknet research universe but is not a constituent of a Closelooknet functional index as of 2026-10-31.
Where does CRCL trade against its moving averages?
Circle Internet Group, Inc. trades 16.9% below its 50-day and 15.7% below its 200-day moving average (12.4% below its 20-day). As of 2026-10-30 — a technical state from the nightly Closelooknet bake, not advice. The Technical tab carries the full row.
How does Circle Internet Group, Inc. compare with its peers?
Against its peer group (Capital Markets · US), Circle Internet Group, Inc. (CRCL) sits 48.2% below its 52-week high, 16.9% below its 50-day average; Futu Holdings Ltd (FUTU) is 50.6% below, PJT Partners Inc (PJT) is 23.1% below, Figure Technology Solutions, Inc. Class A Common Stock (FIGR) is 72.3% below, as of 2026-10-30. Put any of them next to CRCL in the chart grid (2×1 or 2×2) and the page lays the companies side by side: performance, trend, valuation, margins and our money-flow reading.
How does Circle Internet Group, Inc. trade when bond yields rise?
Over the past year Circle Internet Group, Inc. had a beta of 1.32 to TLT, the long-dated Treasury fund — it shows only a loose link to bond moves, higher than 92% of US names. On the 10 sessions in which long bonds fell most it moved −5.34% on average, against −0.74% for the S&P 500. As of 2026-10-30; The "How it trades on rate days" block on this page carries the lines.
Where has Closelooknet written about Circle Internet Group, Inc.?
Circle Internet Group, Inc. appears in 2 Closelooknet pieces as of 2026-10-31, most recently Daily Pulse: Bitcoin and Gold — The Has-Been Breaks Out, the Darling Rolls Over (2026-09-21); Weekly Signal: Bitcoin — New Life for the Coins and the Stocks (2026-09-20). What Closelooknet said most recently: Friday's closes from the Closelook data lake: Table as text Name Friday close Friday Strategy (MSTR) 153.92 +16.4% Marathon (MARA) 13.24 +13.8% Coinbase (COIN) 194.25 +11.7% Robinhood (HOOD) 119.82 +9.1% Riot (RIOT) 23.75 +8.6% Hut 8…
(Daily Pulse, 2026-09-21). The "Mentioned on Closelooknet" block on this page lists the long reads, the reference entries and the dailies that name it.
What does Circle Internet Group, Inc. do?
Circle runs the infrastructure behind the USDC stablecoin, covering the tokens themselves, custody and reserve services, a payments network for moving them, and an open blockchain built to carry that activity. It also issues EURC and works with tokenised funds through the same rails. The company floated in 2025 and is based in New York. There is no peer group recorded for Circle in our data yet; the comparison the market draws most often is with Tether, the other large stablecoin issuer, on reserve backing and network reach. (Company snapshot of 2026-09-17.)
Where does Circle Internet Group, Inc. sit in the AI build-out?
Circle sits outside our Rubin index, which tracks the AI hardware build-out; it belongs instead to the stablecoin and digital-payments corner of the wider universe closelook.net follows alongside chip and infrastructure names. Circle holds no seat in our index and carries no Closelooknet score yet, so neither module strength nor weakness can be read from it; the diary logs its chart structure and analyst-rating shifts as they come in. (Company snapshot of 2026-09-17.)
What has Wall Street done on Circle Internet Group, Inc. recently?
The most recent analyst action on Circle Internet Group, Inc. on the Closelooknet wire is a price target by Mizuho on 2026-10-26 (target 43). 5 actions on the analyst wire since 2026-08-13: 1 upgrade, 4 target changes. Analyst actions are third-party opinions recorded by the wire, not Closelooknet readings. The “The Street on this name” block on this page lists the moves; the full feeds are the analyst wire and the earnings wire.
What does this page show?
A live price chart with SMA overlays and drawing tools for CRCL, performance metrics, index-membership context and the Closelooknet structure read — an investment research diary view, not investment advice.