Weekly Chart Pick · 2026-11-20
AI Chips — the leader gives back half its rise since 2022; we expect the bottom between here and $100
Flat to down for more than a year, then 47.5% off its October record in seven weeks, 19.3% of it after a report that beat on every line. On the Fibonacci lines of the bull leg that began in late 2022, Friday’s close of $125.53 sits just under the halfway mark. We expect the bottom between here and $100, with the stock at 13.5 times trailing earnings: its lowest multiple since 2013, and lower than before the AI boom.
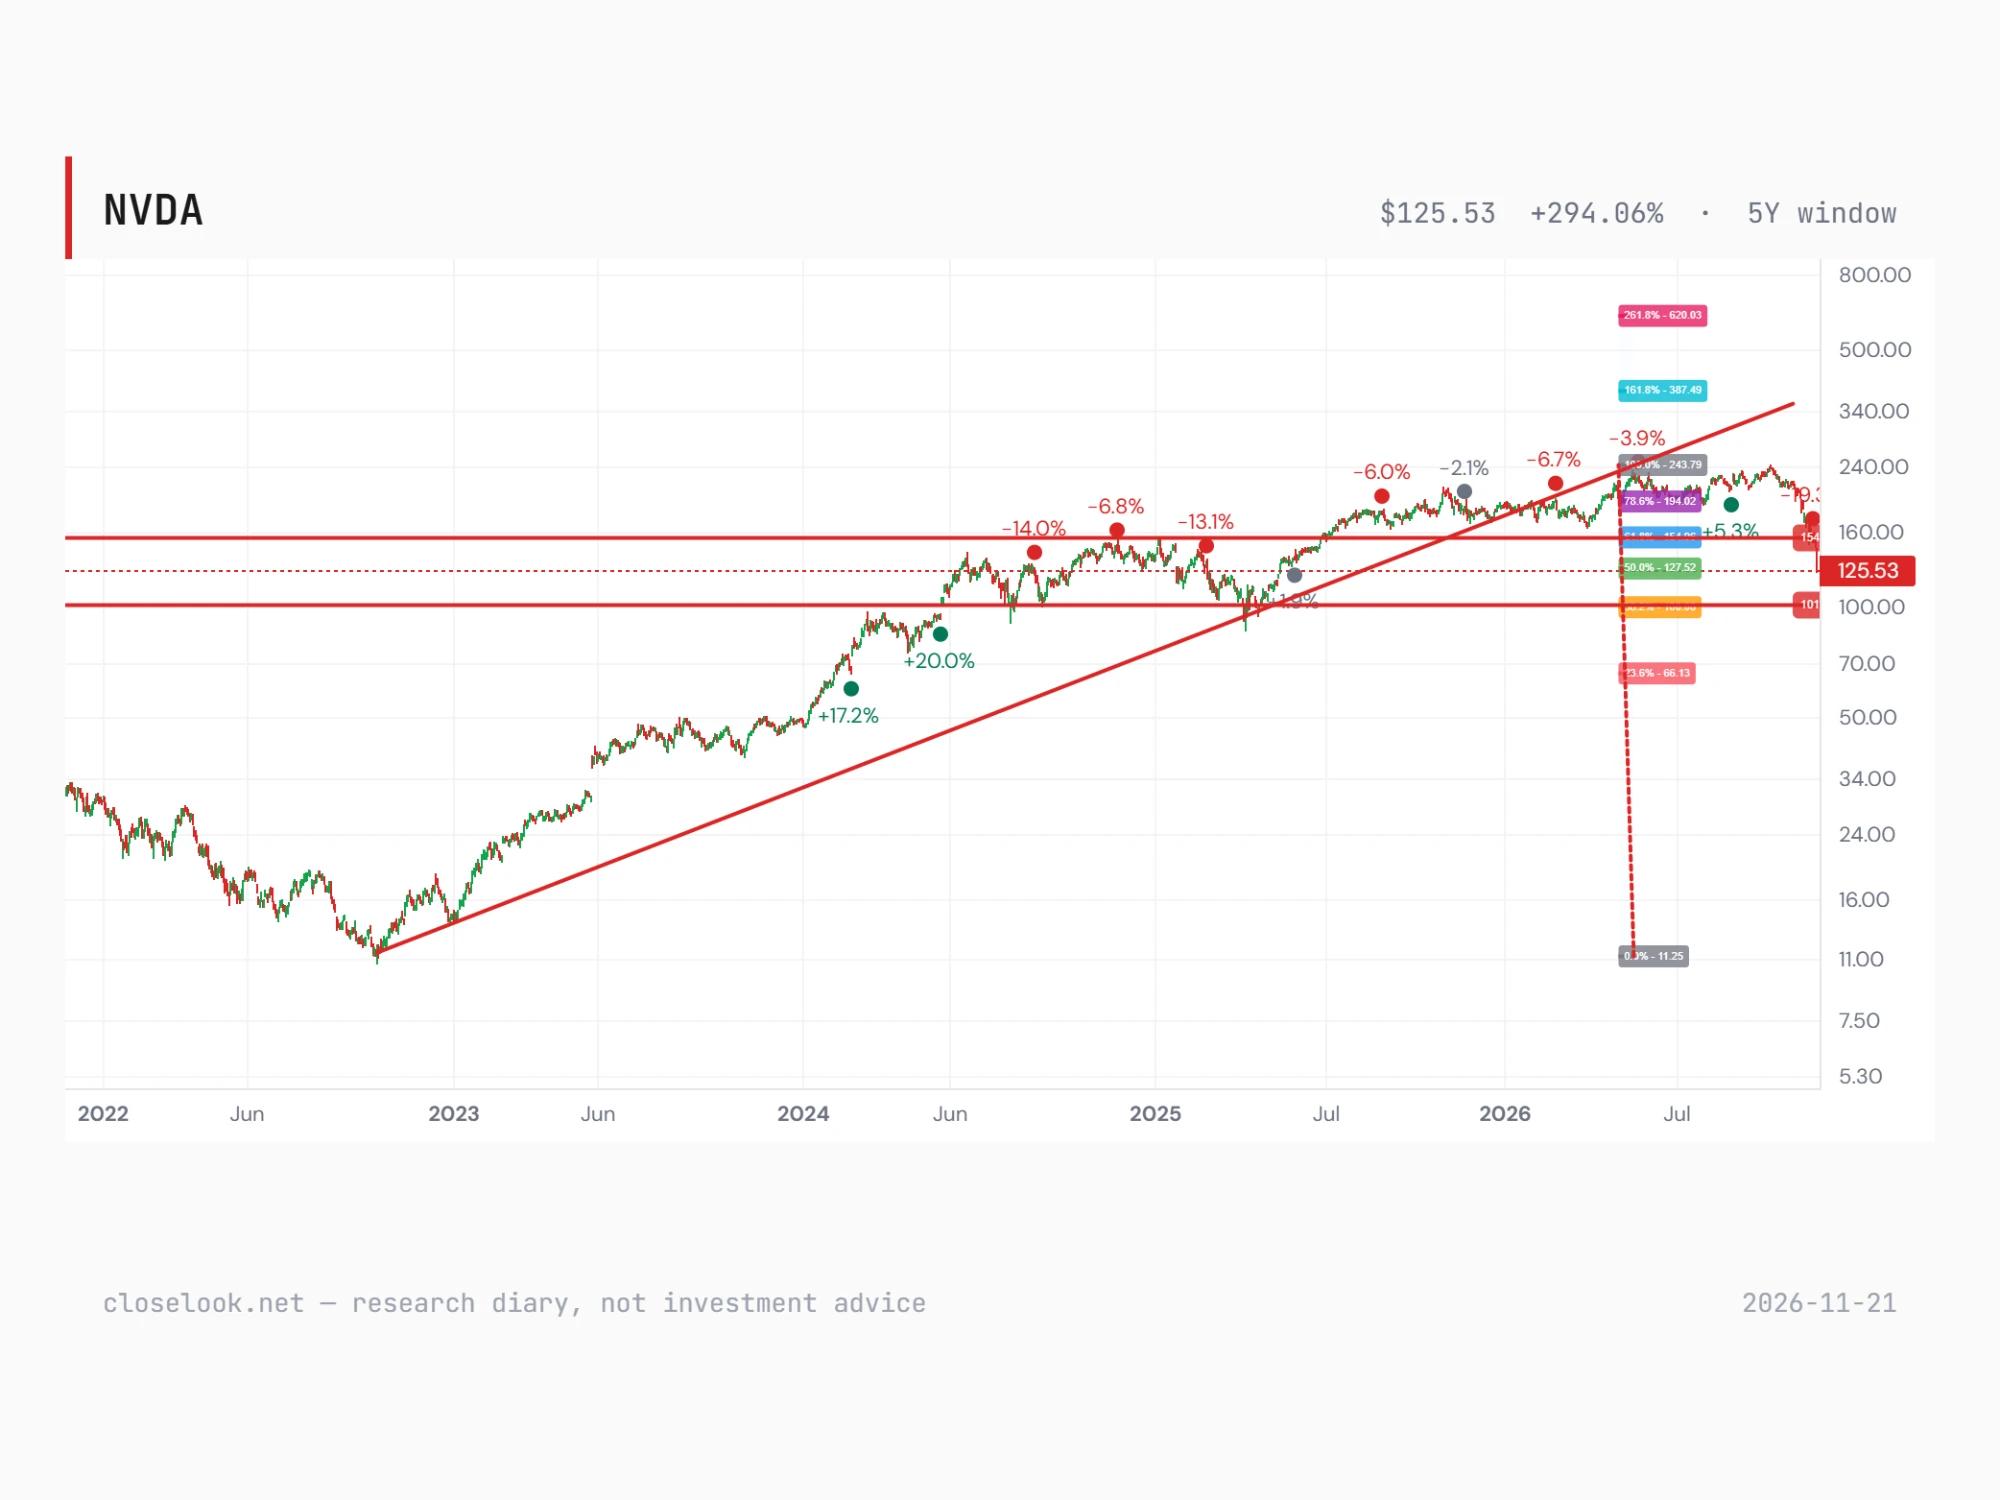
- Half the bull leg given back: on our chart the rise from about $11 in October 2022 to $243.79 in October 2026 has its halfway line at $127.52. Friday’s close of $125.53 sits just under it, 47.5% below the record close of 6 October.
- We expect the bottom between here and $100, the 38.2% line of the same rise. Friday’s low of $124.50 stopped three cents above a price gap the stock left on 13 May 2025. Above, the 61.8% line near $155 is the first ceiling a recovery has to take back.
- Flat, then down, for more than a year: from August 2025 to September 2026, 84% of closes fell between $165 and $215. The October record faded within weeks, and a year ago the stock closed at $180.64.
- Cheaper than before the AI boom: 13.5 times the earnings of the last four quarters, the lowest since April 2013 by our calculation, against 66 times at the end of November 2022. Price to sales of 8.4 is the lowest since June 2019; on analysts’ estimates for the fiscal year to January 2028 it trades at about 7.6 times.
- Sold on a beat: revenue of $115.8 billion against about $109 billion expected and above the company’s own forecast; three sessions later the stock was 19.3% lower. Since 6 October it fell further than the chip fund SOXX (−37.2%), AMD (−34.7%) and Broadcom (−19.0%).
- Our own plan, diary not advice: adding in steps from here, selling cash-secured puts at the money or at the $100 strike, and buying back covered calls written against the shares.
NVDA Nvidia last close 125.53 (2026-11-20)
The Setup
The claim: the stock is close to its low. We expect the bottom between Friday’s close of $125.53 and $100. Three things point there. The chart has given back half of the bull leg that began at the October 2022 low. The valuation is lower than it was before the AI boom. And the last week of selling came on a report that beat on every line, and on a Friday without news.
The chart. The editor draws the Fibonacci retracement of the whole rise, from about $11 in October 2022 to $243.79 in October 2026. Its 50% line sits at $127.52, its 38.2% line at $100.08 and its 61.8% line at $154.96. Two horizontal lines mark the same zone, near $155 at the top and near $101 at the bottom. Friday closed in the middle of it, just under the halfway line. The rise had stalled long before October. The stock first closed above $180 on 4 August 2025, and until the end of September 2026, 84% of its closes fell between $165 and $215. The rising line from the 2022 low broke in early February 2026, and the record of 6 October, $239.24, faded within weeks: on 30 October the stock closed at $204.64.
The valuation. Over the last four quarters the company earned $9.31 a share, 131% more than in the four before. At $125.53 that is 13.5 times earnings, the lowest trailing multiple since April 2013 by our calculation (company earnings per share, Yahoo closes). At the end of November 2022, before the AI boom, the same measure stood at 66, and its median from 2017 to then was 53. Even the low of the 2018 crypto bust, 16.9, was higher. Price to sales of 8.4 is the lowest since June 2019, and on the analysts’ average for the fiscal year to January 2028 (34 analysts, data vendor) the stock trades at about 7.6 times. In May our heresy on the first 50% argued that P/E screens cannot see a re-rating while it happens; today the same screens show the stock cheaper than at the start of it. The question is whether the earnings hold.
The setup: the business delivered and the stock was sold. On Tuesday 17 November the company reported revenue of $115.8 billion, up 103% from a year earlier and above the top of its own forecast, and guided the current quarter above what analysts carried in. It was the eleventh report in a row above estimates on both revenue and earnings. Three sessions later the stock stood 19.3% lower, the largest fall in the eleven reports on our earnings record.
What the market sold. Not the quarter. The outlook carries a gross margin of 71% to 72%, down from 74.9%, and assumes no data-center revenue from China. Since 12 November the company has an interim chief executive, after Jensen Huang resigned without a reason given (company release). On 16 November the Commerce Department published a rule under which data centers in Singapore, Malaysia, Thailand and Indonesia need a US license to buy advanced AI chips (Bloomberg). In the week of the resignation the stock lost 12.75% while AMD and Broadcom gained about 18%.
Friday had no news. The stock fell 14.0% to $125.53, the largest one-day fall since 27 January 2025, on a day when the chip index SOX lost 10.7%, the Nasdaq-100 5.6% and the S&P 500 3.7%, and gold and Bitcoin fell with stocks. The export rule, the departure and the report were all known on Thursday (Midday 10 of 20 November). Volume was 626 million shares, 2.4 times the 20-day average.
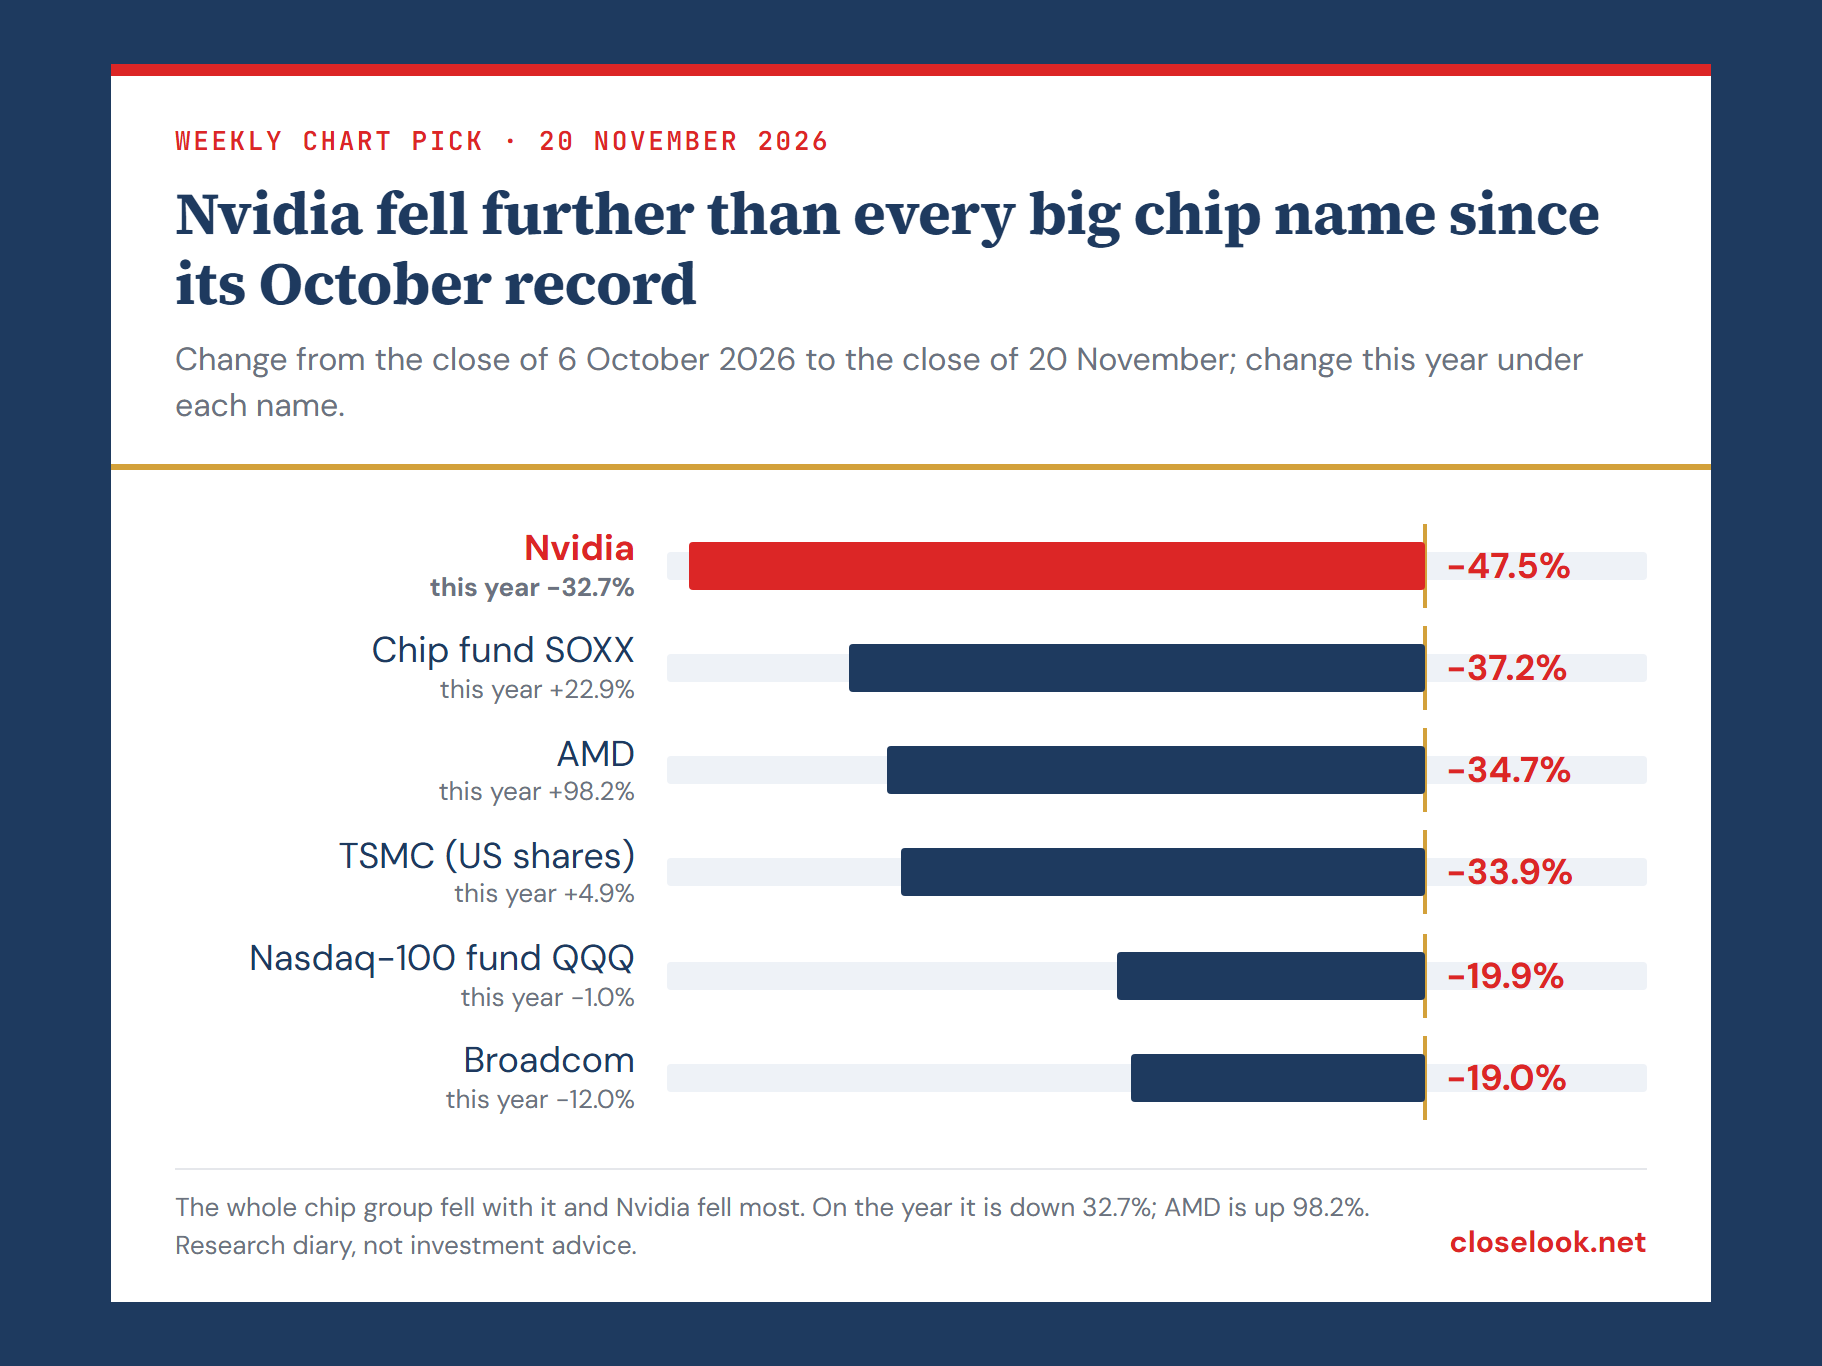
Inside our indices and in the bond market. Over the month the stock trails the Rubin Build-Out 100 by 21.4 points and the Agentic Winners 40 by 24.4 points; its own chip-design sleeve in Rubin lost 21.3%, the stock 40.8%. The company’s 3.5% bond due 2050 yields 6.67%, 37 basis points more than 20 days ago (Credit Stress Tape): the bond market is repricing the build-out along with the shares.
What we do at this level (diary, not advice). The diary already holds the stock, bought higher: the AI Buildout and Hypergrowth books own 100.24 shares each at an average of $182.38, 31.2% under water, and the Derivatives book is short one $175 put for December 2028, sold at $32.19 and now priced at $59.60. Our plan from here: we add in steps rather than at once, because the editor expects the low inside a zone, not at one price. We sell cash-secured puts at the money, near $125, or at the $100 strike; a put pays a premium now and obliges the seller to buy the shares at the strike if the price is below it at expiry, and cash-secured means the money for that purchase is set aside. And we buy back any covered calls written against the shares, because they would cap the gain if the bottom holds and the stock recovers.
In the Closelooknet readings
Said plainly: this is Nvidia (Nasdaq: NVDA), the designer of the graphics processors and rack systems that AI data centers are built on. It sits in two of our indices: the Rubin Build-Out 100, in the Design layer among the chip architects, and the Agentic Winners 40, in the Megacap Gateway tier. Since 12 November the company is led by Colette Kress, interim chief executive, who stays chief financial officer; Jensen Huang resigned that day with immediate effect, and the board is searching with internal and external candidates (company release, 12 November). The diary holds the stock; the positions are listed below.
52-week range (closes): 125.53 – 239.24
The latest print
Last report — Tuesday 17 November after the close. Revenue of $115.8 billion, up 20% from the previous quarter and 103% from a year earlier, against about $108.96 billion expected (data vendor) and above the top of the company's own forecast of $108.0 billion, plus or minus 2%. Adjusted earnings of $2.68 a share against $2.48, and an adjusted gross margin of 74.9%. Data-center revenue was $107.6 billion, up 110%. For the fourth quarter, which has an extra week, the company guides to revenue of $130.0 billion, plus or minus 3%, against about $124.4 billion expected, with no data-center compute revenue from China and a gross margin of 71% to 72% (company release; expectations Proactive). Colette Kress presented the quarter as interim chief executive.
The reaction. After hours on Tuesday the stock rose as high as $161.70, 4.0% above Tuesday's close of $155.46. Wednesday it closed at $150.96, Thursday at $145.98 and Friday at $125.53: −19.3% in three sessions, the largest fall in the eleven reports on our earnings record. Eleven reports, eleven beats on both lines; three sessions later the stock was up more than 3% twice, within 3% twice and down more than 3% seven times.
The report before — 26 August. Revenue of $96.2 billion and a forecast of $108.0 billion for the third quarter. It was the only report since May 2024 that the market paid for: +5.3% in three sessions, when the outlook read as demand ahead of what the company could ship.
Next report — about 24 February 2027 (data vendor date; the company has not announced it yet).
The fundamentals
A selection from the stock page, with the valuation recalculated at Friday’s close. The profile is a rare one: top-decile profitability and growth in our universe, a balance sheet with almost no net debt, and a multiple that prices neither. The weak module is earnings quality: cash flow runs below reported profit, accruals are high and inventory grew 46.9 points faster than sales, which puts the stock near the bottom of our universe on those three measures. The Beneish M-score of −1.37 sits above the −1.78 line the formula treats as a warning; the formula weighs sales growth heavily, so it is a screen, not a finding.
Nvidia by the numbers
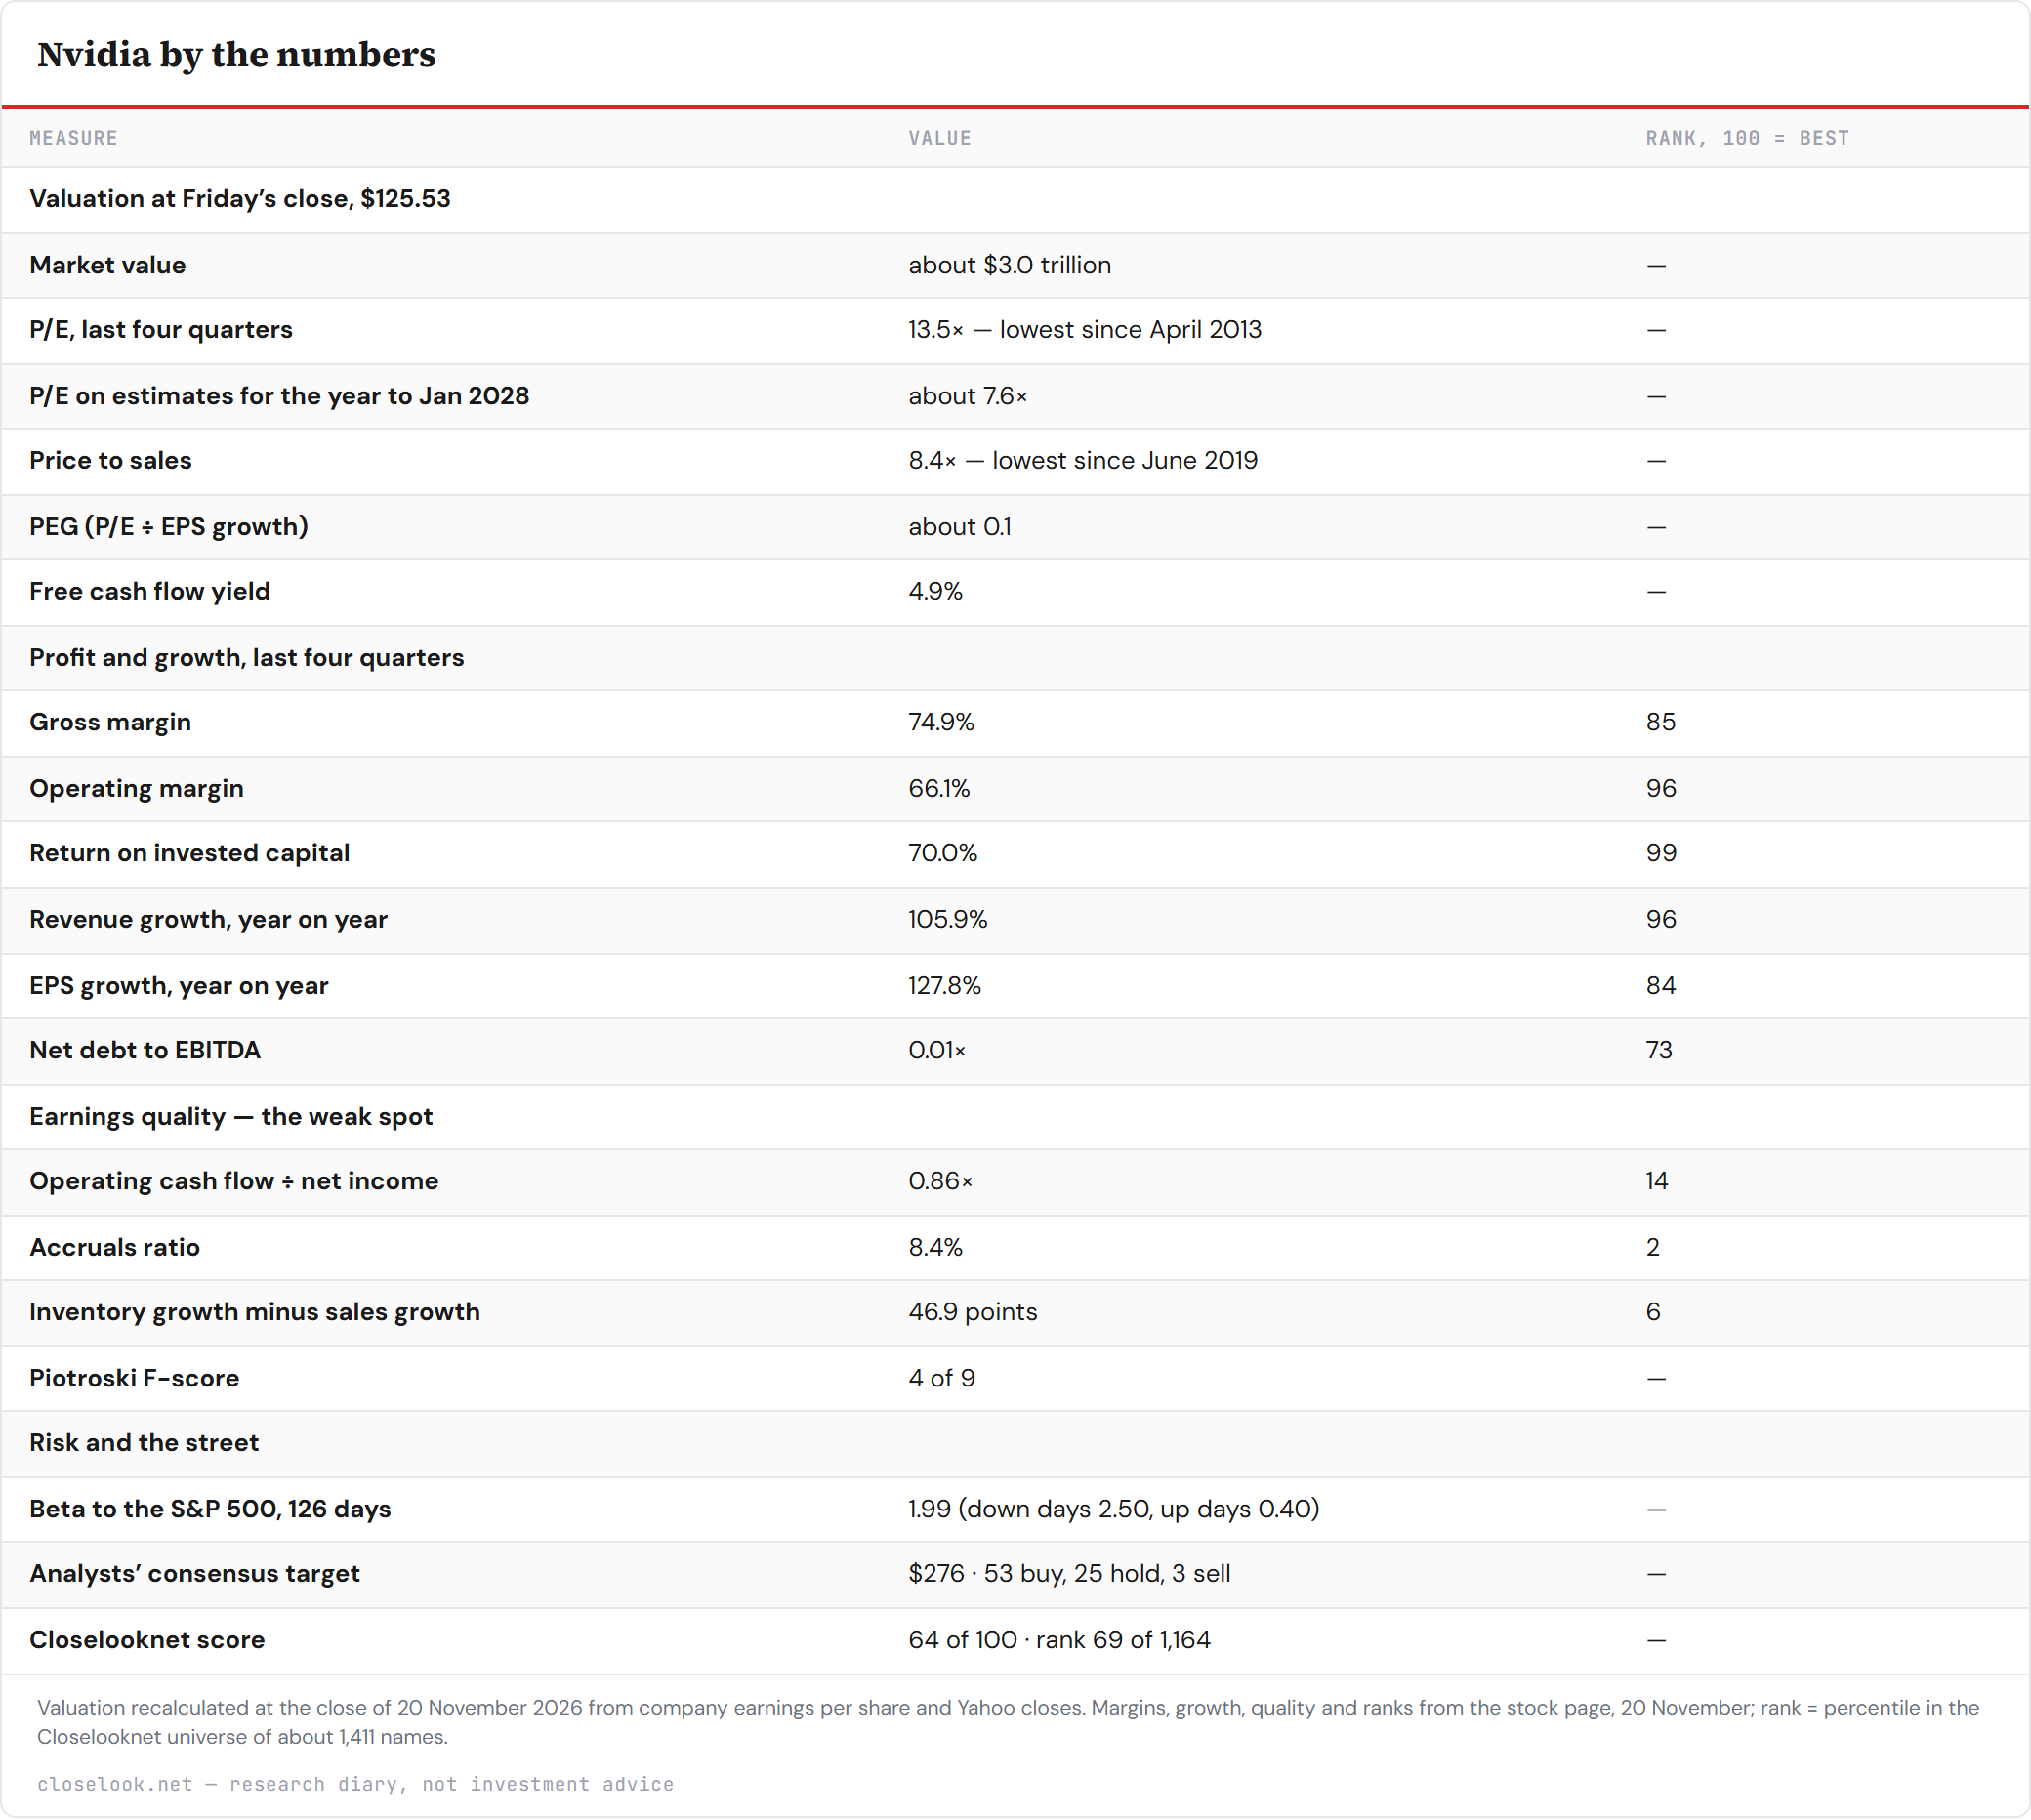
Table as text
| Measure | Value | Rank, 100 = best |
|---|---|---|
| Valuation at Friday’s close, $125.53 | ||
| Market value | about $3.0 trillion | — |
| P/E, last four quarters | 13.5× — lowest since April 2013 | — |
| P/E on estimates for the year to Jan 2028 | about 7.6× | — |
| Price to sales | 8.4× — lowest since June 2019 | — |
| PEG (P/E ÷ EPS growth) | about 0.1 | — |
| Free cash flow yield | 4.9% | — |
| Profit and growth, last four quarters | ||
| Gross margin | 74.9% | 85 |
| Operating margin | 66.1% | 96 |
| Return on invested capital | 70.0% | 99 |
| Revenue growth, year on year | 105.9% | 96 |
| EPS growth, year on year | 127.8% | 84 |
| Net debt to EBITDA | 0.01× | 73 |
| Earnings quality — the weak spot | ||
| Operating cash flow ÷ net income | 0.86× | 14 |
| Accruals ratio | 8.4% | 2 |
| Inventory growth minus sales growth | 46.9 points | 6 |
| Piotroski F-score | 4 of 9 | — |
| Risk and the street | ||
| Beta to the S&P 500, 126 days | 1.99 (down days 2.50, up days 0.40) | — |
| Analysts’ consensus target | $276 · 53 buy, 25 hold, 3 sell | — |
| Closelooknet score | 64 of 100 · rank 69 of 1,164 | — |
Valuation recalculated at the close of 20 November 2026 from company earnings per share and Yahoo closes. Margins, growth, quality and ranks from the stock page, 20 November; rank = percentile in the Closelooknet universe of about 1,411 names.
Our company score reads 64 of 100, rank 69 of 1,164: quality 94, growth 88, balance sheet 88, valuation 55, capital allocation 51, momentum 27, earnings quality 20. The board added $150 billion to the buyback in September, and the company returned $28.1 billion to shareholders in the last quarter.
The chart, read by hand
Trend: Five-year view, log scale. The editor’s Fibonacci retracement runs from $11.25 at the October 2022 low (0%) to $243.79 at the October 2026 high (100%): 23.6% at $66.13, 38.2% at $100.08, 50% at $127.52, 61.8% at $154.96, 78.6% at $194.02. Two horizontal lines frame the zone that matters, near $155 and near $101, and Friday’s close of $125.53 sits in the middle, just under the halfway line. The rising line from the October 2022 low, which the April 2025 low came back to, broke in early February 2026; the October record was made far below it. Since then the stock has given back the whole move of 2025 and 2026: it went through the 61.8% line on 18 November and reached the 50% line on Friday. The editor’s read: the stock is retracing the full bull leg that began in late 2022, and the bottom forms between here and $100. The dots mark the reaction three sessions after each report, from our earnings record: green up more than 3%, red down more than 3%, grey in between; nine of the last eleven were red or grey.
Oscillators: The editor’s chart carries no oscillator, so the machine layer speaks here. The 14-day RSI reads 15.0, the lowest in ten years of daily data; the stochastic sits at its floor (1.7) and the MACD is below its signal line. The stock is 31% under its 20-day average, 39% under its 50-day and 38% under its 200-day. It sits at the lower edge of all three regression channels the stock page draws, six standard deviations under the 360-day one. The pattern scanner reads the tape as mean-reverting (Hurst exponent 0.43, regime score 15 of 100), and its wave read, still a beta, labels the fall since October an A-B-C correction with wave C in progress. Directional Flow stands at +7.7, down 20.7 points in 21 sessions. One reading did not hold: the scanner’s support zone at $164.66, which had held in 85% of 13 earlier episodes on this stock, gave way on 13 November.
Elliott Wave count: No wave count drawn for this edition — the read rests on the Fibonacci lines of the rise from 2022 and the two horizontal lines near $155 and $101. The scanner’s machine count (beta) sees an A-B-C correction in its last leg.
Key levels: $194.02 — the 78.6% line of the rise from 2022 · About $155 — the 61.8% line ($154.96) and the upper horizontal line, close to the top of 2024 and early 2025; the stock closed under it on 18 November, and it is the first level a recovery has to take back · $127.52 — the 50% line; Friday closed just under it · $124.47 to $123.00 — the price gap of 13 May 2025; Friday’s low of $124.50 stopped on its top · About $100 — the 38.2% line ($100.08) and the lower horizontal line; the floor of the zone where the editor expects the bottom, and the strike of the puts in our plan · $94.31 — the April 2025 low close ($86.62 during the day); a close below ends this read
What the machines say
Technical snapshot (as of 2026-11-20) — vs 20d -30.8% · vs 50d -39.4% · vs 200d -38.3% · off 52w-high -47.5% · stochastic K 1.7 / D 4.8 · New 52-week low
Pattern engine (scan 2026-11-20) — directional-flow 8/100, neutral, decelerating up (5d -9.5%, 21d -20.7%)
Closelooknet scores (as of 2026-11-20) — composite 64/100 · momentum 27/100
Machine blocks render only where our engines actually cover the name — nothing is padded.
The risks, equal billing
What would prove us wrong. A close under about $100, the 38.2% line, would mean the low is further down than the editor expects; under $94.31, the April 2025 low close, the read is wrong, and the next line on the chart is the 23.6% retracement at $66.13. The machines have been wrong here once already: the support zone at $164.66, which had held 85% of the time, gave way on 13 November. The business risks are real too. The outlook takes the gross margin down three points. The company is run by an interim chief executive, and the release of 12 November gave no reason for the departure. China is out of the outlook, and since 16 November a license rule covers four Southeast Asian countries. Earnings quality is the weakest module of our score, with cash flow below profit and inventory growing faster than sales. The beta profile is fragile: over 126 sessions the stock moved about 2.5 times as much as the S&P 500 on its down days and 0.4 times as much on its up days. And a cheap multiple can get cheaper if analysts cut the estimates the forward multiple rests on.
Our forecasts
Next 2–4 weeks: The editor expects the bottom to form between Friday’s $125.53 and about $100, the zone between the 50% and the 38.2% lines of the rise since 2022. After seven down days in a row and an RSI of 15, a sharp bounce can come at any time and can fail. A close back above $127.52 would be the first sign that the low is in; a close under $100 would say it is lower than we expect.
The report of about 24 February 2027: The bar is the outlook again: this quarter the company beat on both lines and guided above estimates, and the stock still fell 19.3%. On our earnings record a beat has been sold seven times in eleven reports; a beat that is paid for would be the first sign that the market believes the margins again.
12 months: If the low forms in the $100–$125 zone, the way back runs through the 61.8% line near $155, the level the stock lost on 18 November, and then the 78.6% line at $194.02. At 13.5 times trailing earnings the stock prices a fall in profits; if earnings merely hold near today’s level, we read the valuation as the case for that recovery. We keep this view until a close under the April 2025 low of $94.31 says otherwise.
Diary views, not advice — held publicly alongside the scored record.
Why publish this name? Because our Directional Flow readings are what let us say it: stocks with this or a similar setup have often — historically — done well over the following twelve months. That is the engine's backtested observation about the past, not a forecast; past performance may not be an indication of future performance. Which is exactly why every pick is scored publicly against the tape from today, at one week, one month, three, six and twelve. 12-month view, written 21 November 2026 from the close of 20 November ($125.53). Diary, not investment advice.
Closelooknet publishes an investment research diary, not investment advice. Every pick is scored publicly against the tape at 1w/1m/3m/6m/12m from publication — the record, not the single call, is the product.
Open the live NVDA terminal → All picks & the running record →
A note from the editor: the Weekly Chart Pick is free. Its price is one click — add Closelooknet as a preferred source on Google, and you support this work in Google Discover and Search every time you read.
Google opened in a new tab. Add Closelooknet there, then come back to this tab — the Chart Pick unlocks the moment you return.
The preferred-source setting lives in your Google account — if Google asks you to sign in first, you will land on the selection page right after. Google does not tell us whether you saved the selection. Clicking “Done” unlocks the Weekly Chart Pick on this device for 12 months.