Heresy · 08:30 NY
The First 50% Trap — Closelook Heresy
Why classical valuation metrics — and classical portfolio rules — break the moment a secular bull is real.
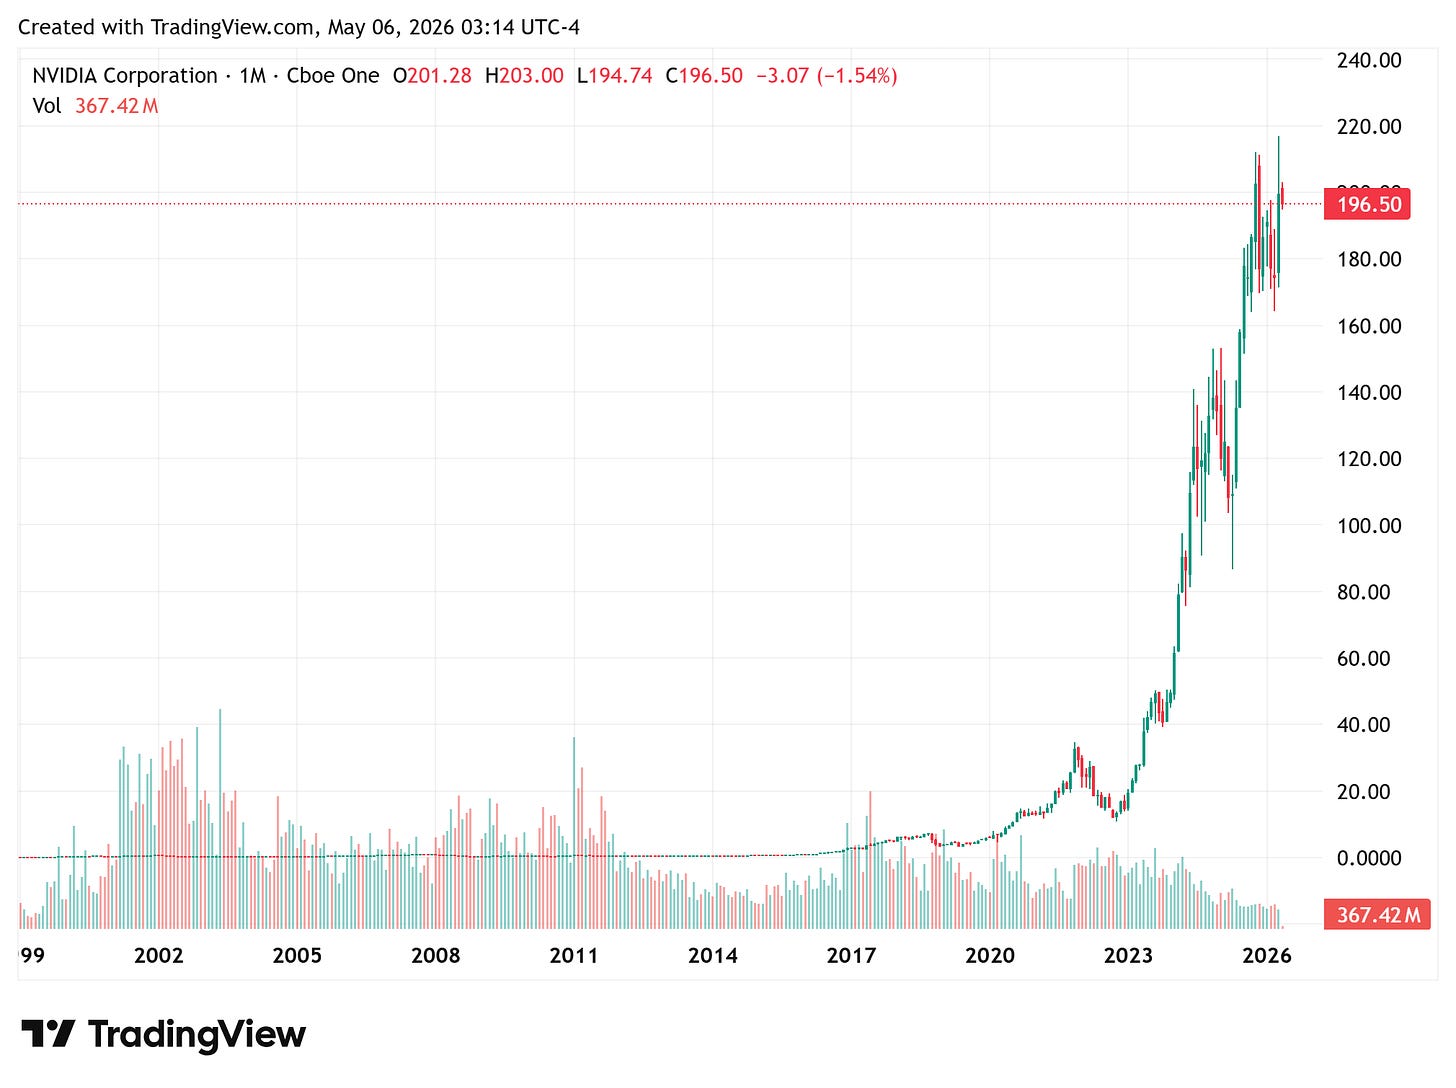
There's a moment in every great tech story when the average investor exits. Not at the top. Not near it. Typically at +50%. The PnL looks good, the gut whispers don't be greedy, a well-meaning advisor quotes Kostolany. What no one says out loud: those first 50% on a Microsoft, Amazon, or NVIDIA ride were never half the journey. They were the first five percent.
Classical analysis cannot see this
P/E, EV/EBITDA, and the whole valuation toolkit were built for businesses with predictable, mean-reverting earnings power. Apply it to a re-rating in real time, and it screams "expensive" at every step that compounds. Stanley Druckenmiller has been blunt about this for forty years: "Never, ever invest in the present." The screens are always the last to know. This applies to new entrants and to incumbents being re-rated alike — a young name has no comparables; an old name has comparables that no longer apply.
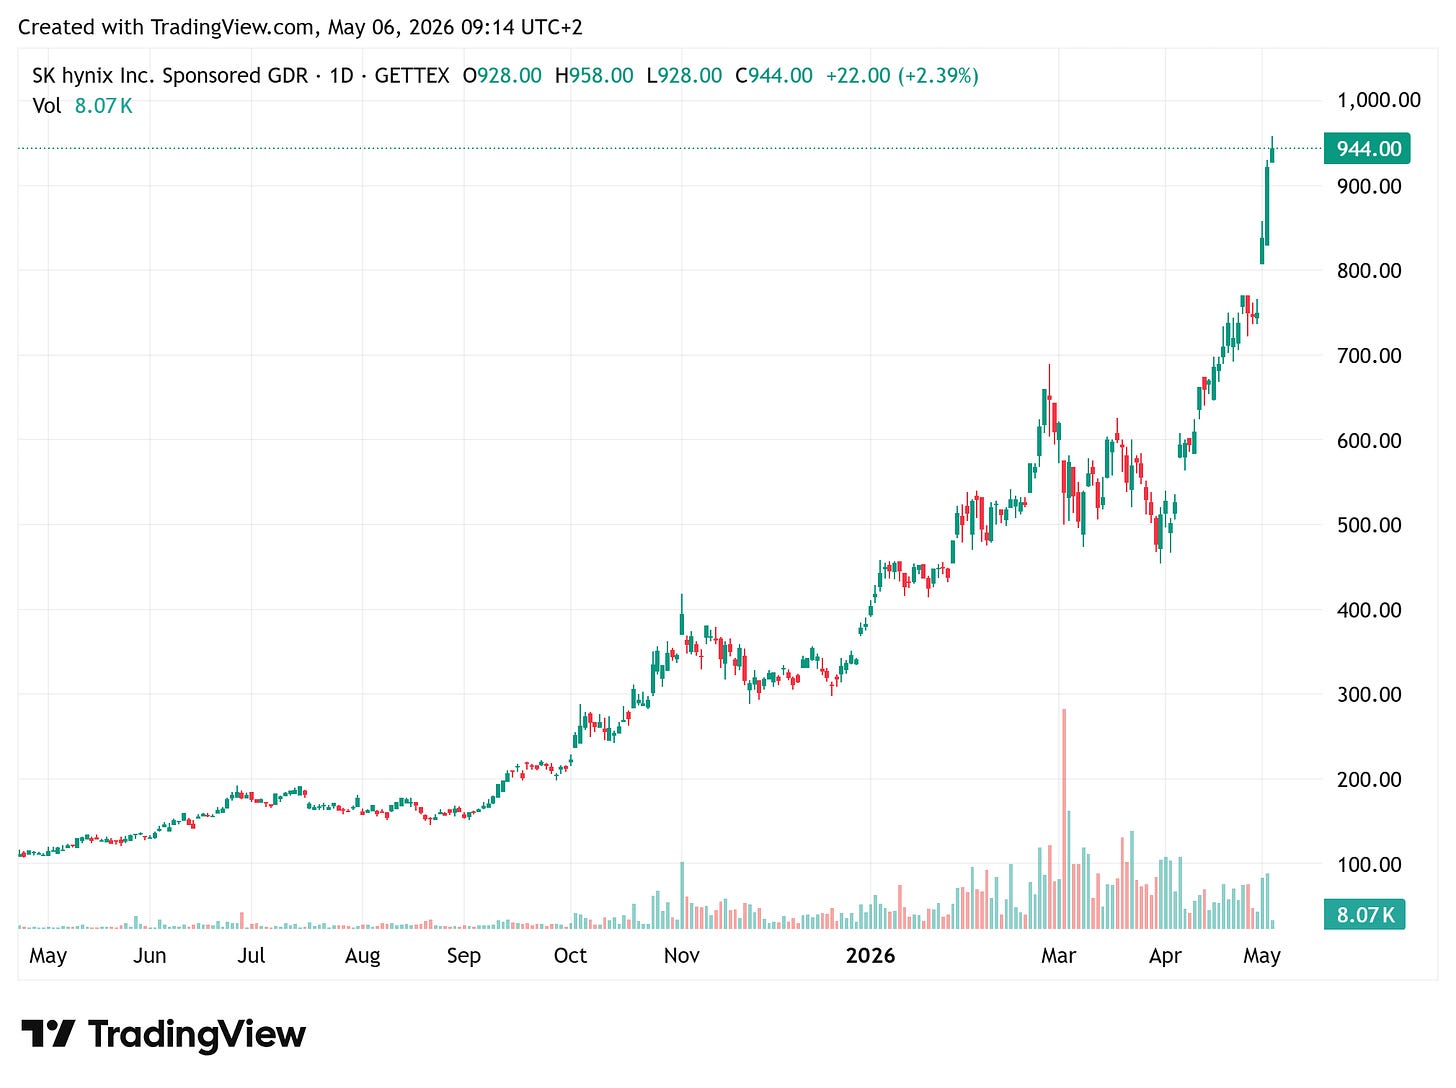
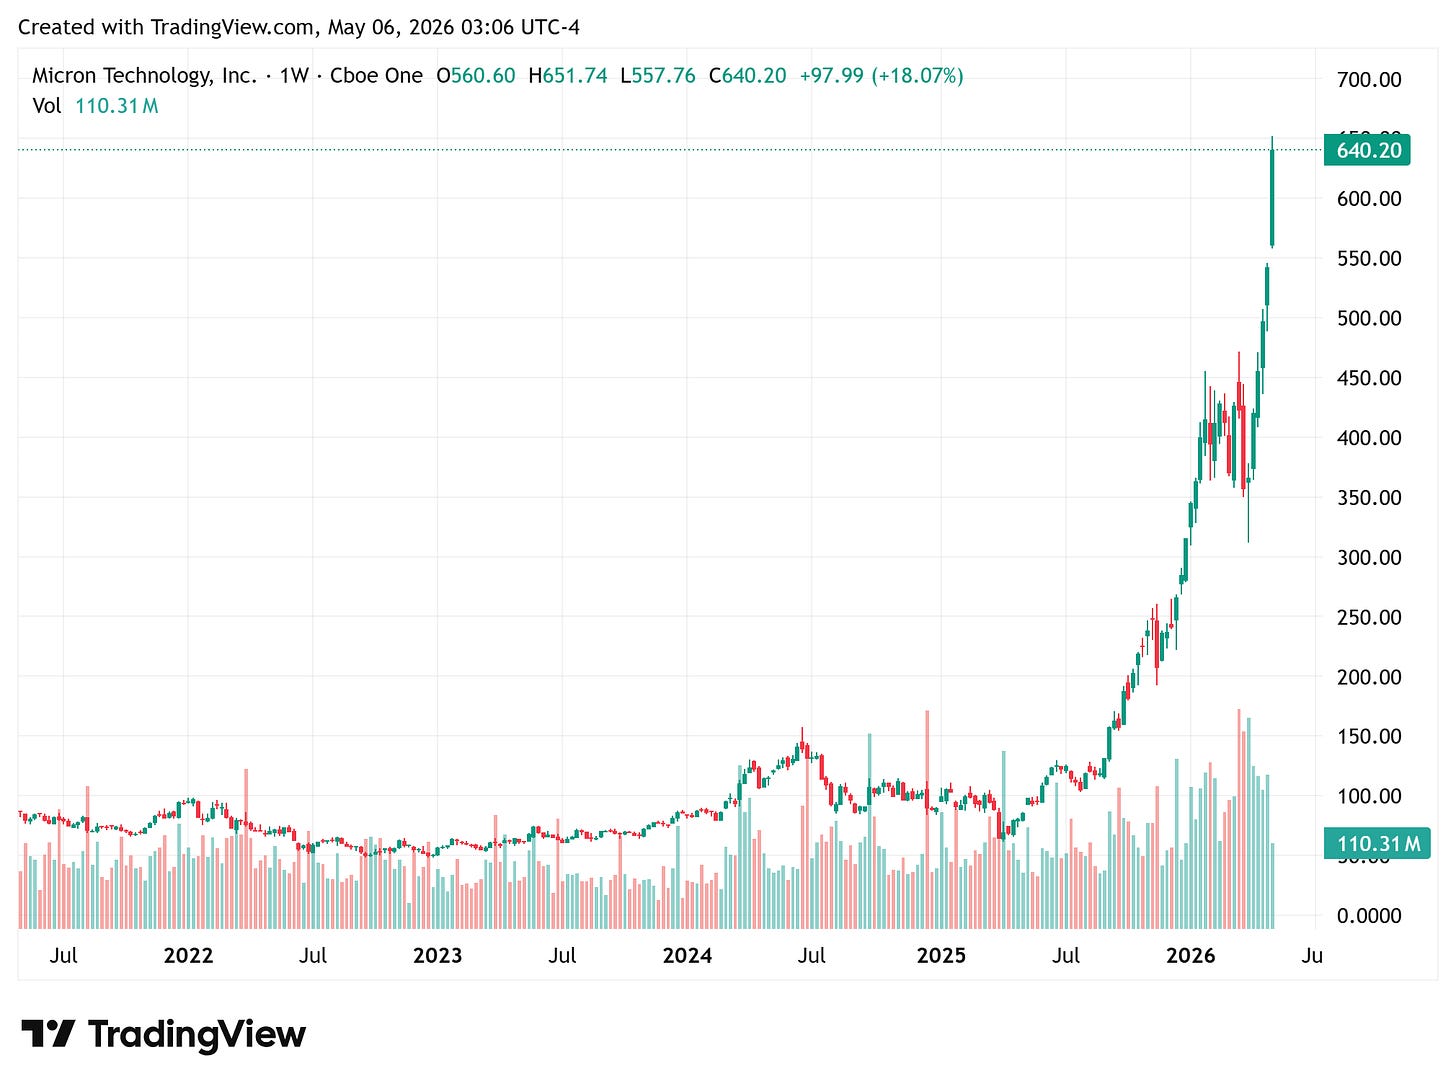
Take memory chips
For two decades, SK Hynix and Micron were textbook commodity cyclicals: boom, bust, write-downs, repeat. Anyone trained on that history reads the current move as just another peak. They miss that AI memory — HBM, stacked, packaging-bottlenecked, custom-priced for hyperscalers — is structurally a different product.
The numbers are starting to say it loudly:
- SK Hynix's general-purpose DRAM operating margin is projected above 70 percent — the first time since the supercycle of 1995.
- HBM4 is selling at roughly a 50 percent premium over HBM3E on NVIDIA contracts.
- SK Hynix's full HBM book is sold through 2026.
- In Q4 2025, memory gross margins surpassed TSMC's for the first time since 2018.
None of these are commodity-cyclical numbers. They are pricing-power numbers that an old-cycle analyst is trained never to expect from this industry.
And here's the part the screens really cannot see. Anyone who works with frontier LLMs daily knows that roughly three-quarters of their errors are not model hallucinations. They are memory and context errors — the model cutting corners and guessing because thinking the problem all the way through is still too expensive in compute and bandwidth. That is not a model architecture problem solvable by a clever paper. That is a memory problem. And it will persist deep into the decade. HBM demand is therefore not cyclical. It is bound to a structural constraint on AI quality that nobody is unbinding before 2030.
The ratios look stretched on the old playbook. The new playbook hasn't reached the screens yet.
Where this fits in the cycle
At Closelook, we read every secular tech move through a Generation Rotation Framework — Hopper, Blackwell, Rubin, Feynman — each generation moving through Dawn, Early Ramp, Mid Ramp, Sunset. Memory is not a separate story. Memory is Layer Zero: the binding constraint that defines how much of each generation actually gets converted into useful intelligence. As long as that constraint is binding, memory suppliers belong in the conviction sleeve next to the GPU primaries. Trimmed when Sunset characteristics genuinely appear — margin plateau, pricing softness, customer pushback — not before.
This is where portfolio orthodoxy fails
The classical rule — don't let any single position get too large — assumes mean reversion. In a secular re-rating, that rule is a tax on your best ideas. Druckenmiller, after thirty years of compounding at roughly thirty percent annually without a single down year, says it plainly: the great investors make "large concentrated bets where they have a lot of conviction" — exactly the opposite of what business schools teach.
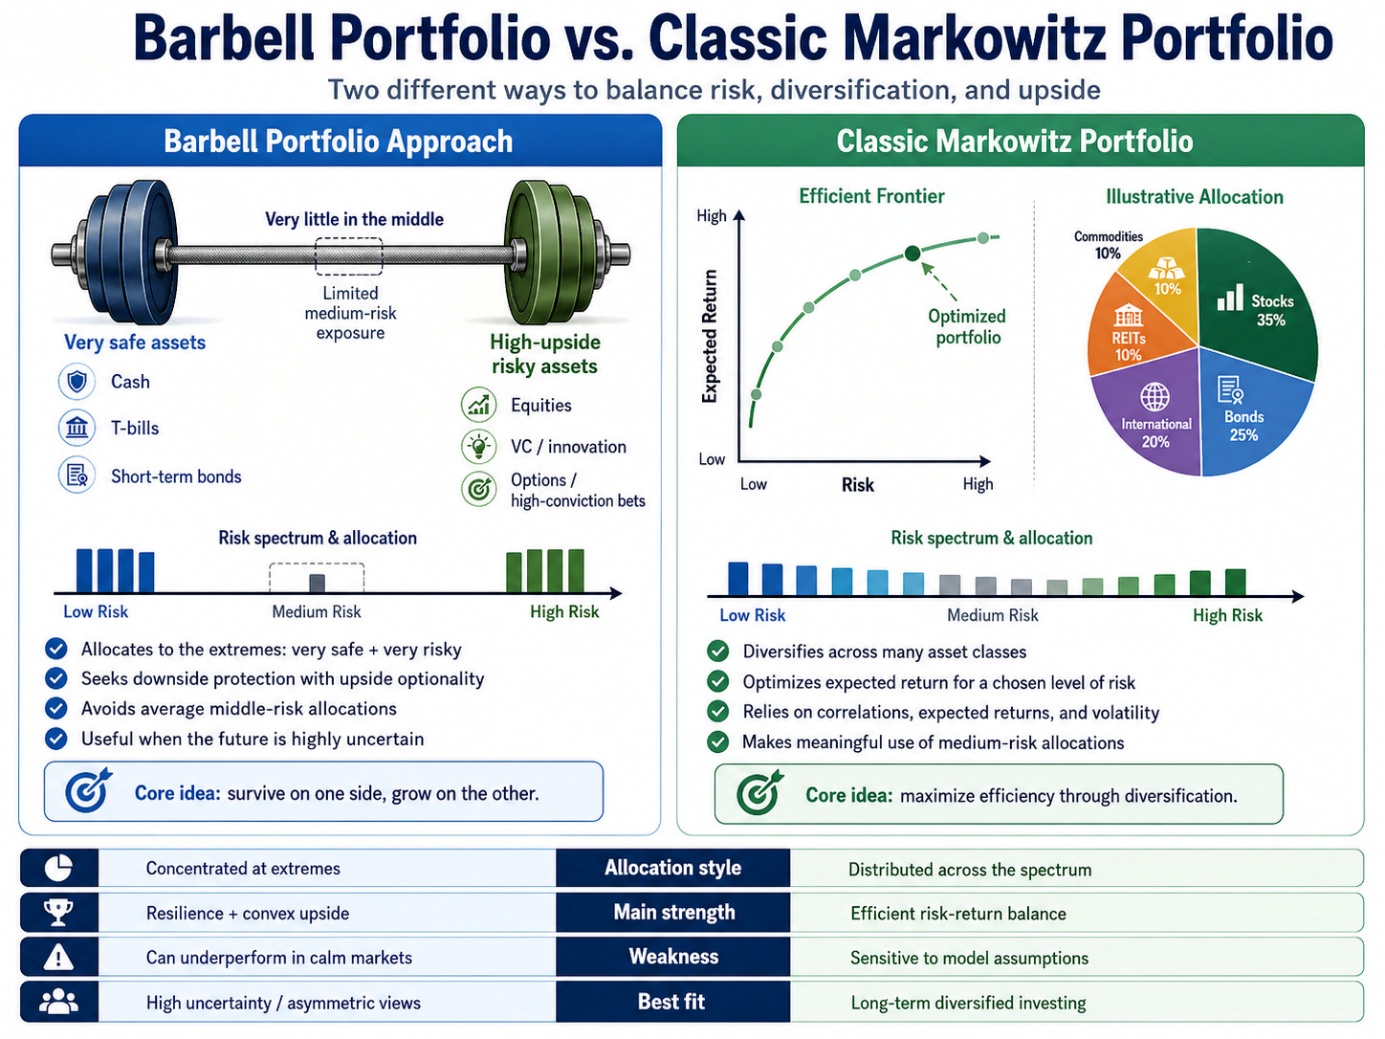
The honest choice is binary: either run full risk, or manage risk via a barbell. Hedges, cash, defensive sleeve on one side; concentrated conviction on the other. But once a position is in the conviction sleeve, you let it run. "When you're right on something, you can't own enough." Trimming a Rubin-cycle compounder back to its starting weight every quarter is just paying yourself the disposition effect on a recurring schedule.
Yes, this is risky if it goes wrong
A broken barbell costs more than a diversified miss. But the real cost most investors pay is the opposite one: perpetual benchmark-hugging, eternal underperformance by a few hundred basis points, the slow grind of being marginally below average. Druckenmiller's own framing is the cleanest summary: long-term returns come from "preservation of capital and home runs." The few times Soros ever criticized him, he has said, were not when he was wrong, but when he was right on a market and didn't maximize the opportunity. That is the single greatest obstacle to long-term returns. Bigger than any drawdown a concentrated position could ever deliver.
The lesson I took from working with the LBS Neuroforecasting Centre in the mid-1990s, applying neural networks to equity and macro data, was almost embarrassingly simple: regime selection mattered more than model complexity. The smartest model on the wrong regime lost. The plainest model on the right regime won. Thirty years later, the same lesson translates almost word-for-word into investor behavior. Selecting the regime — secular versus cyclical, compounder versus mean-reverting, binding constraint versus commodity oversupply — is the work. Everything that comes after is just position sizing.
The first 50% are the most expensive because they cost everything that follows. The classical toolkit is the most expensive because it cannot see what follows. The game was never the next double. The game is the next ten years.