C+

Daily Pulse · · 20:00 CET · market · GLD

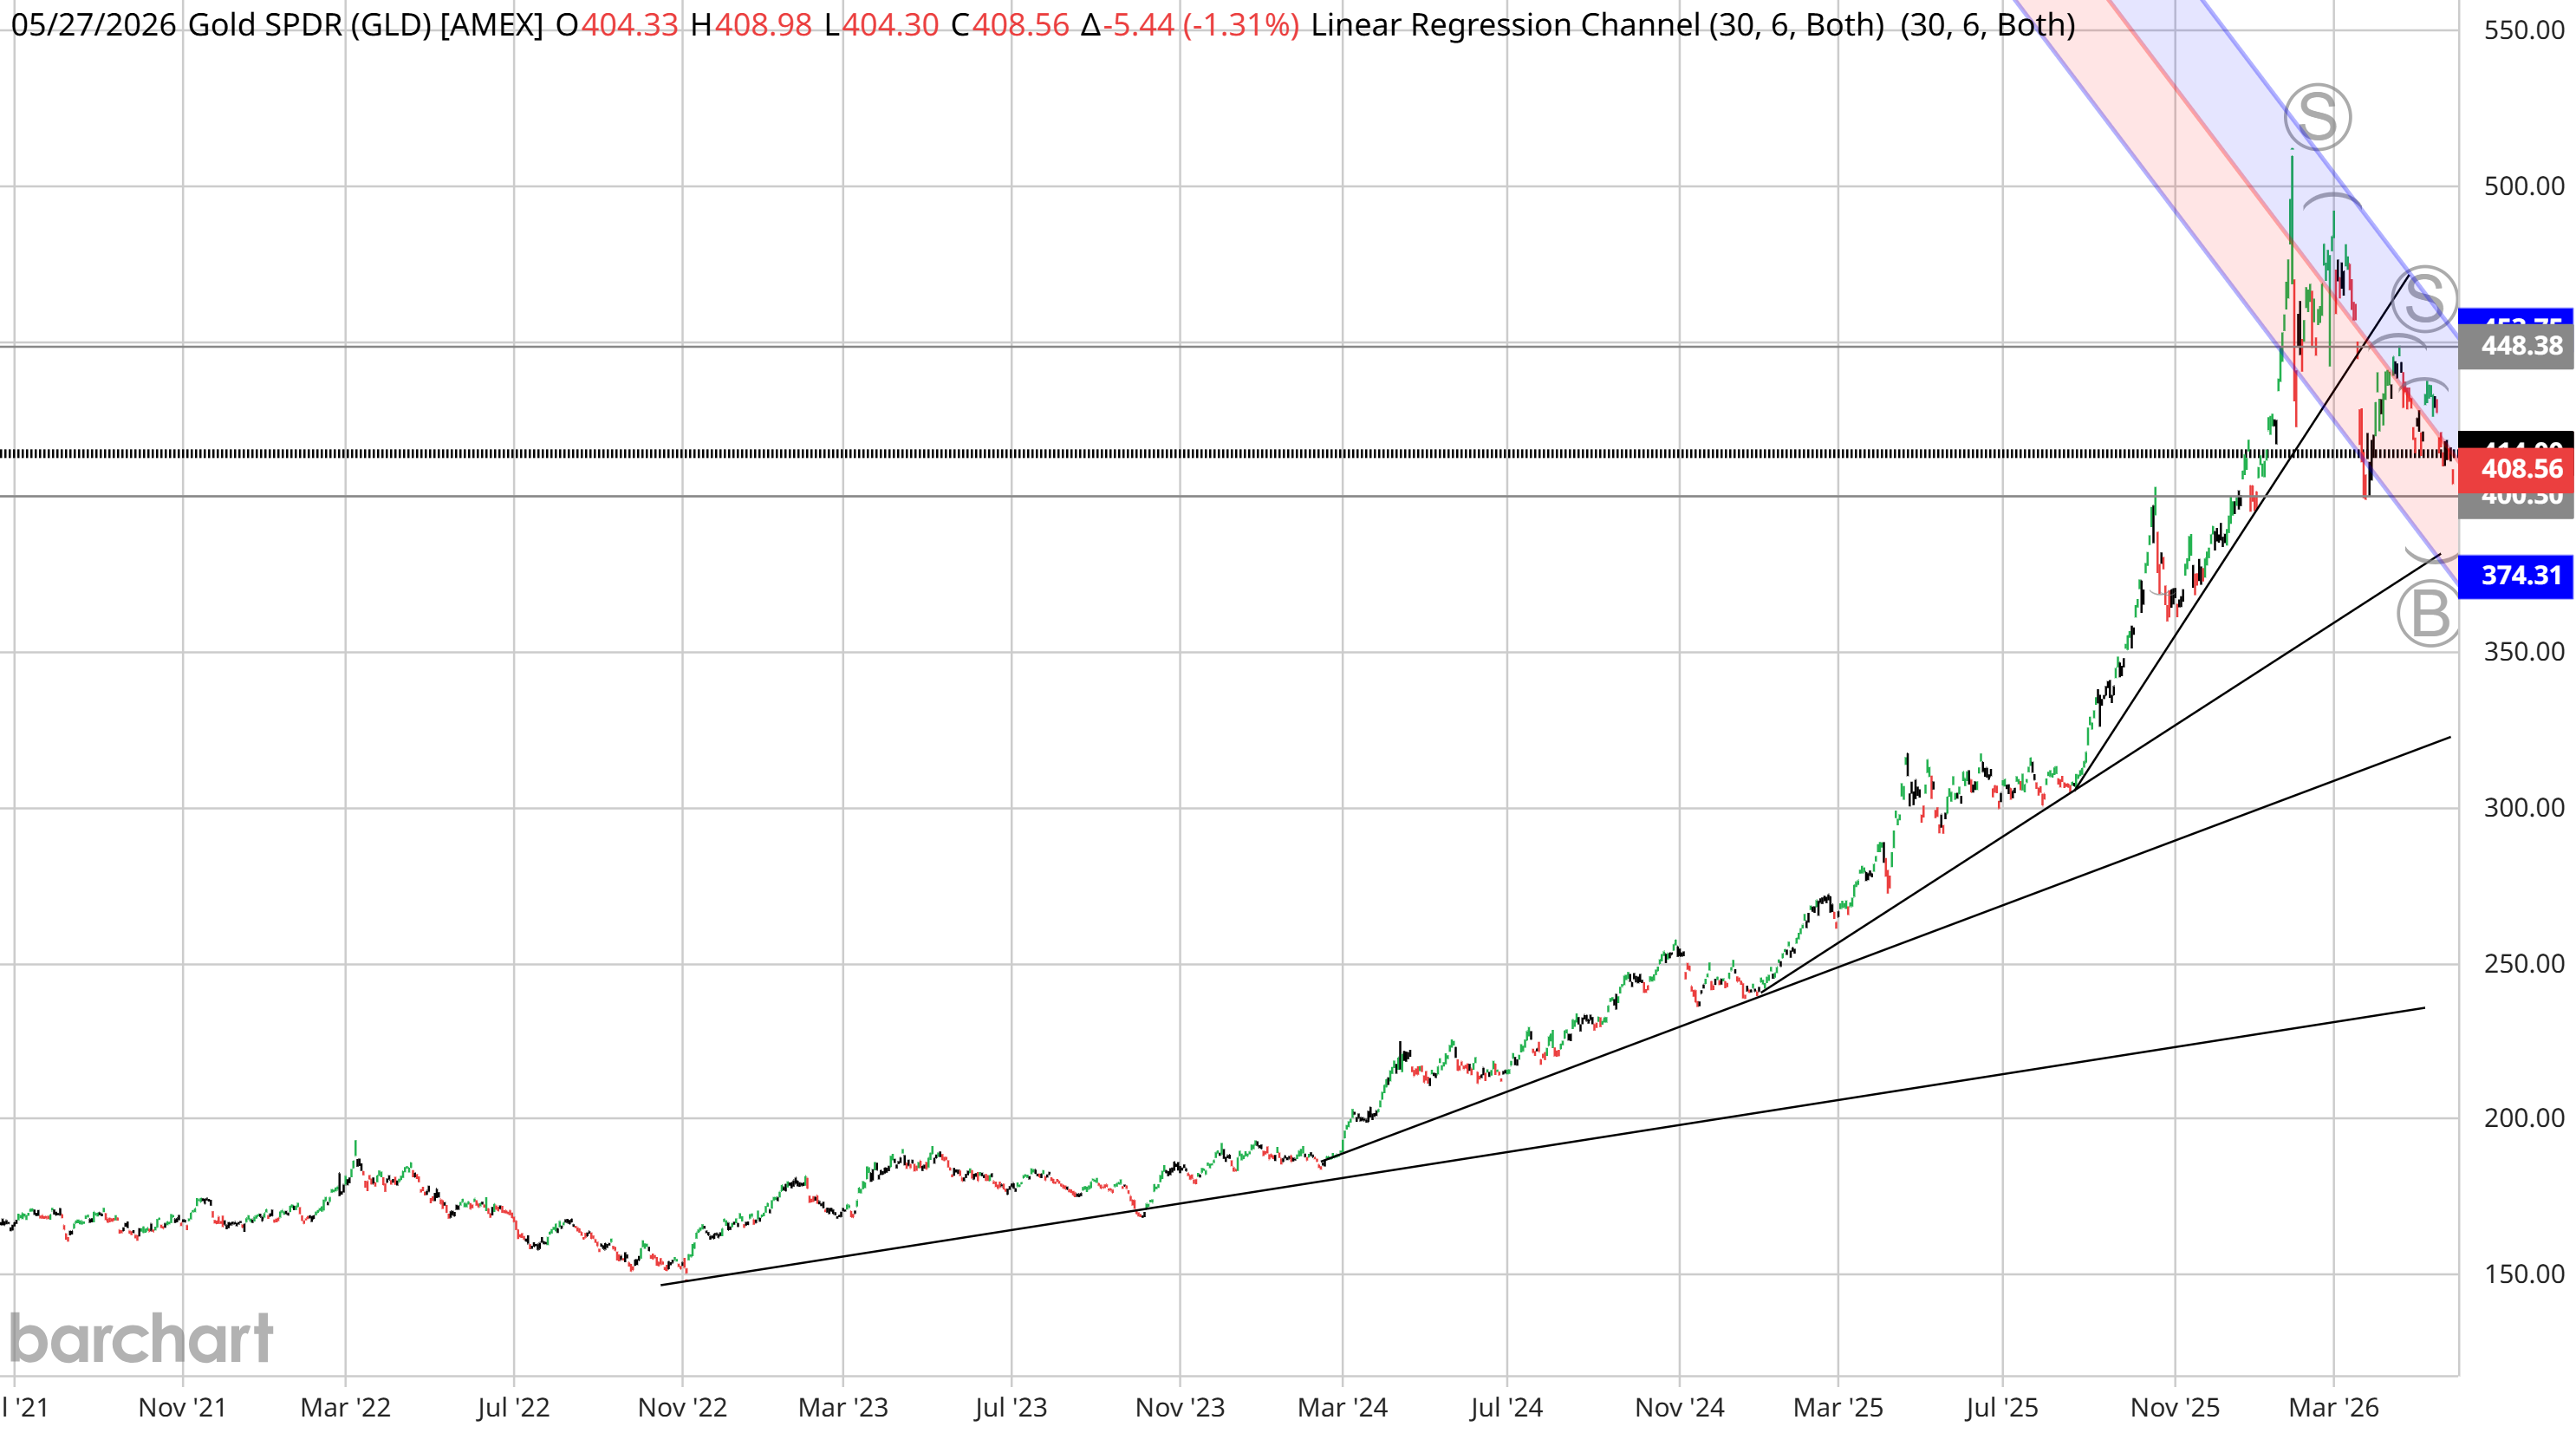
GLD weekly chart with linear regression channel showing wave A correction into 400-410 zone, with 2022/2023/2024 uptrend lines intact below

Gold's First Wave Down

Short-term channel says 400. Long-term trend says relax. 2026 says: nothing here.

GLD trades at 408.56 mid-session today, down 1.31%, sitting on the lower rail of a tight 30-day linear regression channel that has done nothing but sell every rally since the early-year top. The chart is telling two stories at once — and the difference between them is the whole investment question.

The short-term story

The structure since February is a textbook ABC correction. Wave A from the highs has carried GLD into the 400–410 zone, exactly where the regression channel's lower band sits. A test of 400 is the path of least resistance. Every bounce inside the channel has been sold; the pivot at 448.38 has flipped from support to ceiling.

The medium-term story

Don't mistake the first leg down for the whole move. Wave A into 400 is plausibly only the opening act. The setup favours an extended correction — either a deeper ABC reaching the next reference point near 374, or a more complex WXYZ that grinds sideways-to-down through summer. The Elliott structure does not have to resolve in one move, and after a parabolic year it rarely does.

The implication is the same in either case: the time to buy gold aggressively is not now.

The long-term story

The structural bull case from the 2022 lows is intact. Multiple uptrend lines from 2022, 2023, and early 2024 remain unbroken on the chart, and none of them is currently being tested. Nothing about the price action breaks the secular thesis. The bull has not died. It has gone for a nap.

Under the hood: who actually sold

The selloff is financial, not strategic. The World Gold Council's own attribution model — GRAM — told the story for the March leg: standard macro factors (real yields, breakevens, dollar, oil, equity vol) explained roughly 5% of the move. The other 95% was positioning and liquidity. ETF outflows, COMEX long liquidation, CTA momentum reversal. Hot money leaving — not the marginal demand curve shifting.

What did not capitulate:

  • Central banks still net buyers — 244 tonnes in Q1 2026, up 3% year-on-year
  • Bar-and-coin demand ran +42% y/y to 474 tonnes, Asian investors leading
  • April ETF flows turned positive again — Europe +$3.7bn, Asia +$1.8bn, with Mainland China and Hong Kong both adding

The genuine soft spot is jewellery — Q1 consumption down 23% y/y. That's classic price-sensitivity from high-cost consumers, not a thesis break.

Translation: the people who own gold for thirty-year reasons are not selling. The people who owned it for a six-week momentum trade did. That distinction matters for how this resolves — and for who has the right to be surprised when the long-term trend lines hold.

House view

Closelooknet reading is that gold tends to be among the worst-performing major assets of 2026.

The asset that led the cycle from 2022 to early 2026 has done its job. Capital is rotating. The regime that rewarded gold — falling real rates, dollar stress, central-bank accumulation pricing in — is no longer the marginal driver. The marginal dollar is being put to work elsewhere, particularly in the AI-compute complex we cover in the Rubin Build-Out 100 and HALO Growth 100 universes.

Skin in the game

Existing positions don't need to be sold; the long-term trend doesn't lie. But adding here — into Wave A, into the lower channel, into a market that has only sold rallies — is not a setup we want to underwrite.

The next reference point is 400. The one after that is 374. Wait for the structure, not the headline.

Levels to watch

LevelMeaning
448.38Flipped from support to ceiling — short-term cap
408.56Mid-session today — lower rail of regression channel
400.30Channel support — first downside test
374.31Channel projection — Wave C / WXYZ target zone

Long-term trend lines from 2022, 2023, and 2024 all remain unbroken below.