Closelook@Global Stock Markets
Three Speeds — America's Tech at a Record, Europe Slides, Asia Splits on AI
The Nasdaq 100 made a record close, global tech took out its June high, and Taiwan and Japan's broad fund closed at records — while every mainland European market on the board fell, France, Spain and Austria by four to five percent, Switzerland and Britain with them, and India slid to its lowest close in a year. The dollar made its highest close of 2026 and the euro its lowest; the long bond made a new low every day of the week, and gold broke its first support. The world ex-US index lost its line again, and its lead over America for the year is down to six tenths of a point. America won a fourth week. This letter's read for the fourth quarter — stay home, because the AI trade lives in America and Asia — and TSMC's September sales next week are the first test of it.
Current edition · 2026-10-03
1 · This Week's Action
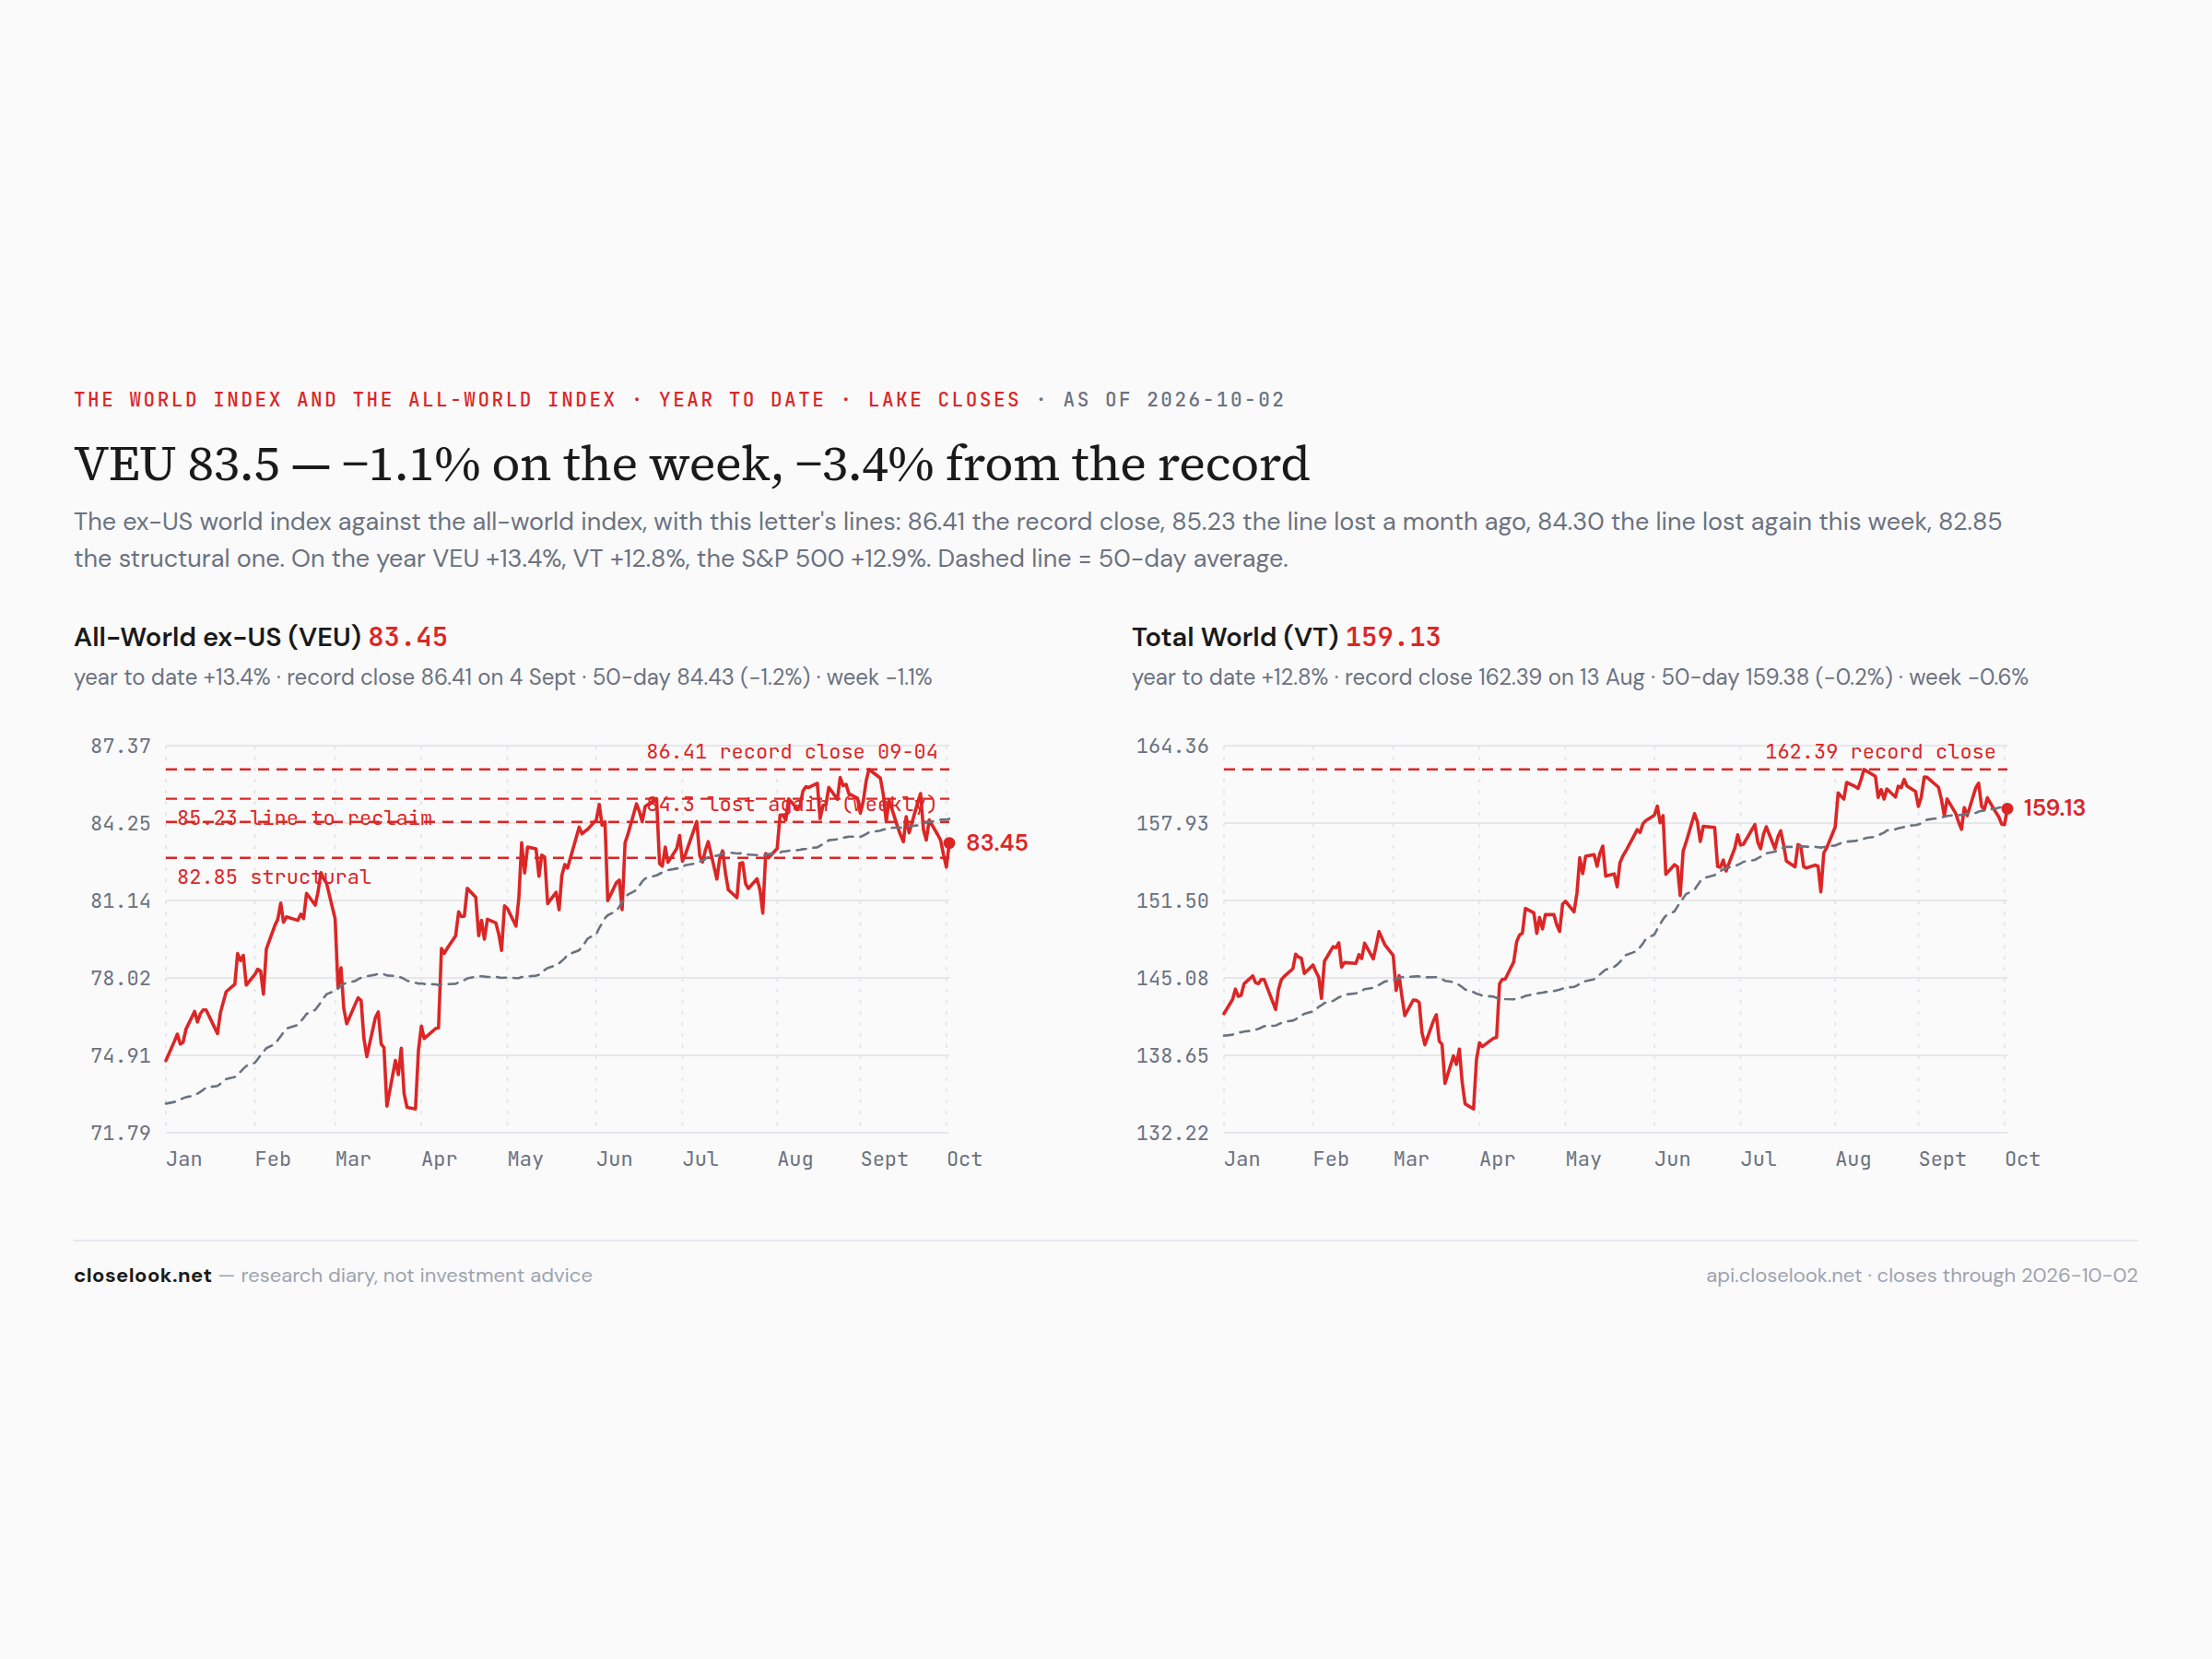
The global view. The ex-US world index closed the week at 83.45, down 1.10% — back under 84.30, the line it took back a week ago by eight cents. The path: Monday 83.77, Tuesday 83.56, Wednesday 82.97, Thursday 82.48 — a daily close under the 82.85 structural line, the first since July — and Friday 83.45, back above it for the weekly close. The index sits 3.4% under its September 4 record of 86.41. The all-world index closed 159.13, down 0.56%, 2.0% under its August high. The S&P 500 fund slipped 0.22%, 1.1% under its August high — but the Nasdaq 100 rose 1.01% to 30,916, a record close on Friday, and the fund that tracks it closed at a record too.
The year's order is close to turning. VEU +13.4% for 2026, the S&P fund +12.9%, VT +12.8% — the ex-US lead over America is 0.6 points, from 1.6 last week, 2.3 the week before, 3.7 and 4.5 before that. Four consecutive stay-home weeks. The Nasdaq 100 fund, the part of America that carries the AI trade, is +22.0% on the year. The house cointegration monitor still lists the VEU/SPY pair as breaking.
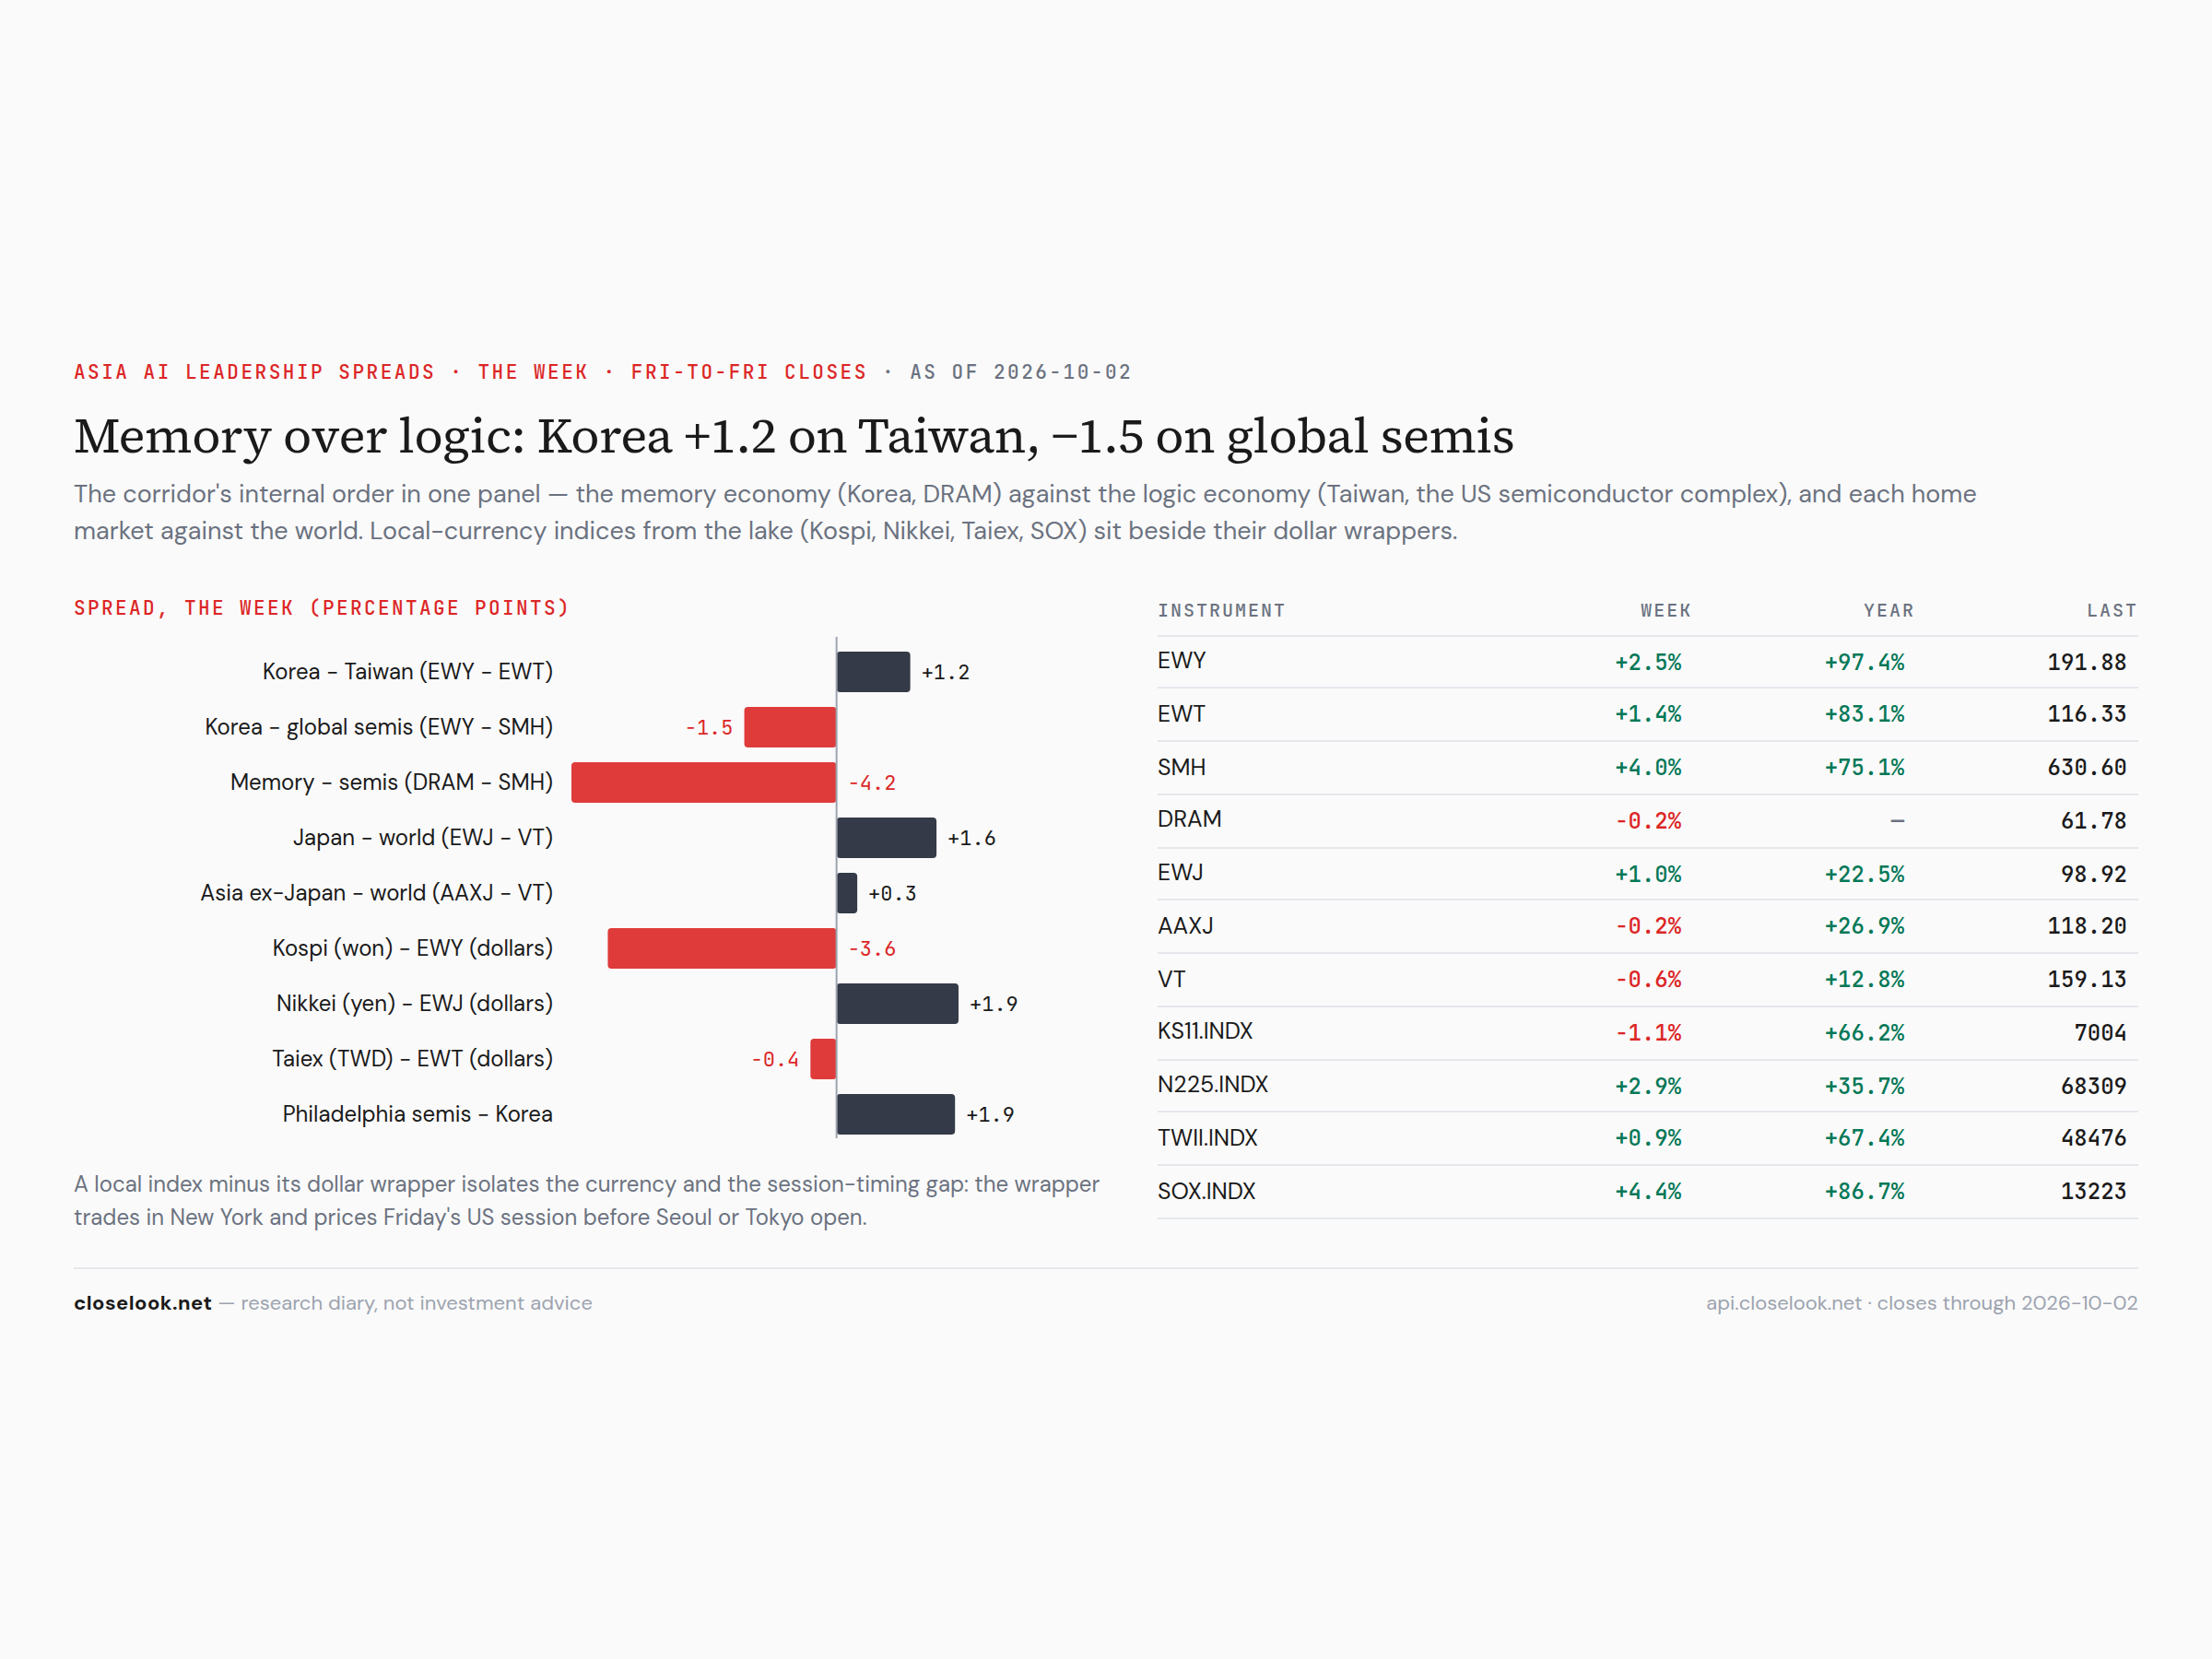
Three speeds — the week in one picture. The world did not move as one market this week; it moved at three speeds, and the dividing line was the AI trade. America's technology at records: the Nasdaq 100 at a record close, the US tech sector fund at a record 199.81 (+1.80%), global tech at a record 151.94 (+2.00%) — through the June high this letter has carried as a line since the summer. Asia's chip markets ahead: Taiwan's fund +1.35% to a record close of 116.33, the Taiex at a record 48,476; Korea's fund +2.51% to 191.88; Japan's fund +1.01% to a record close of 98.92. Europe and India behind: the Europe fund −2.54%, France −3.69%, Spain −4.72%, Austria −5.18%, Germany −2.27%, Switzerland −2.36%, Britain −2.41%; India −2.80%, with the Sensex at its lowest close in a year on Thursday.
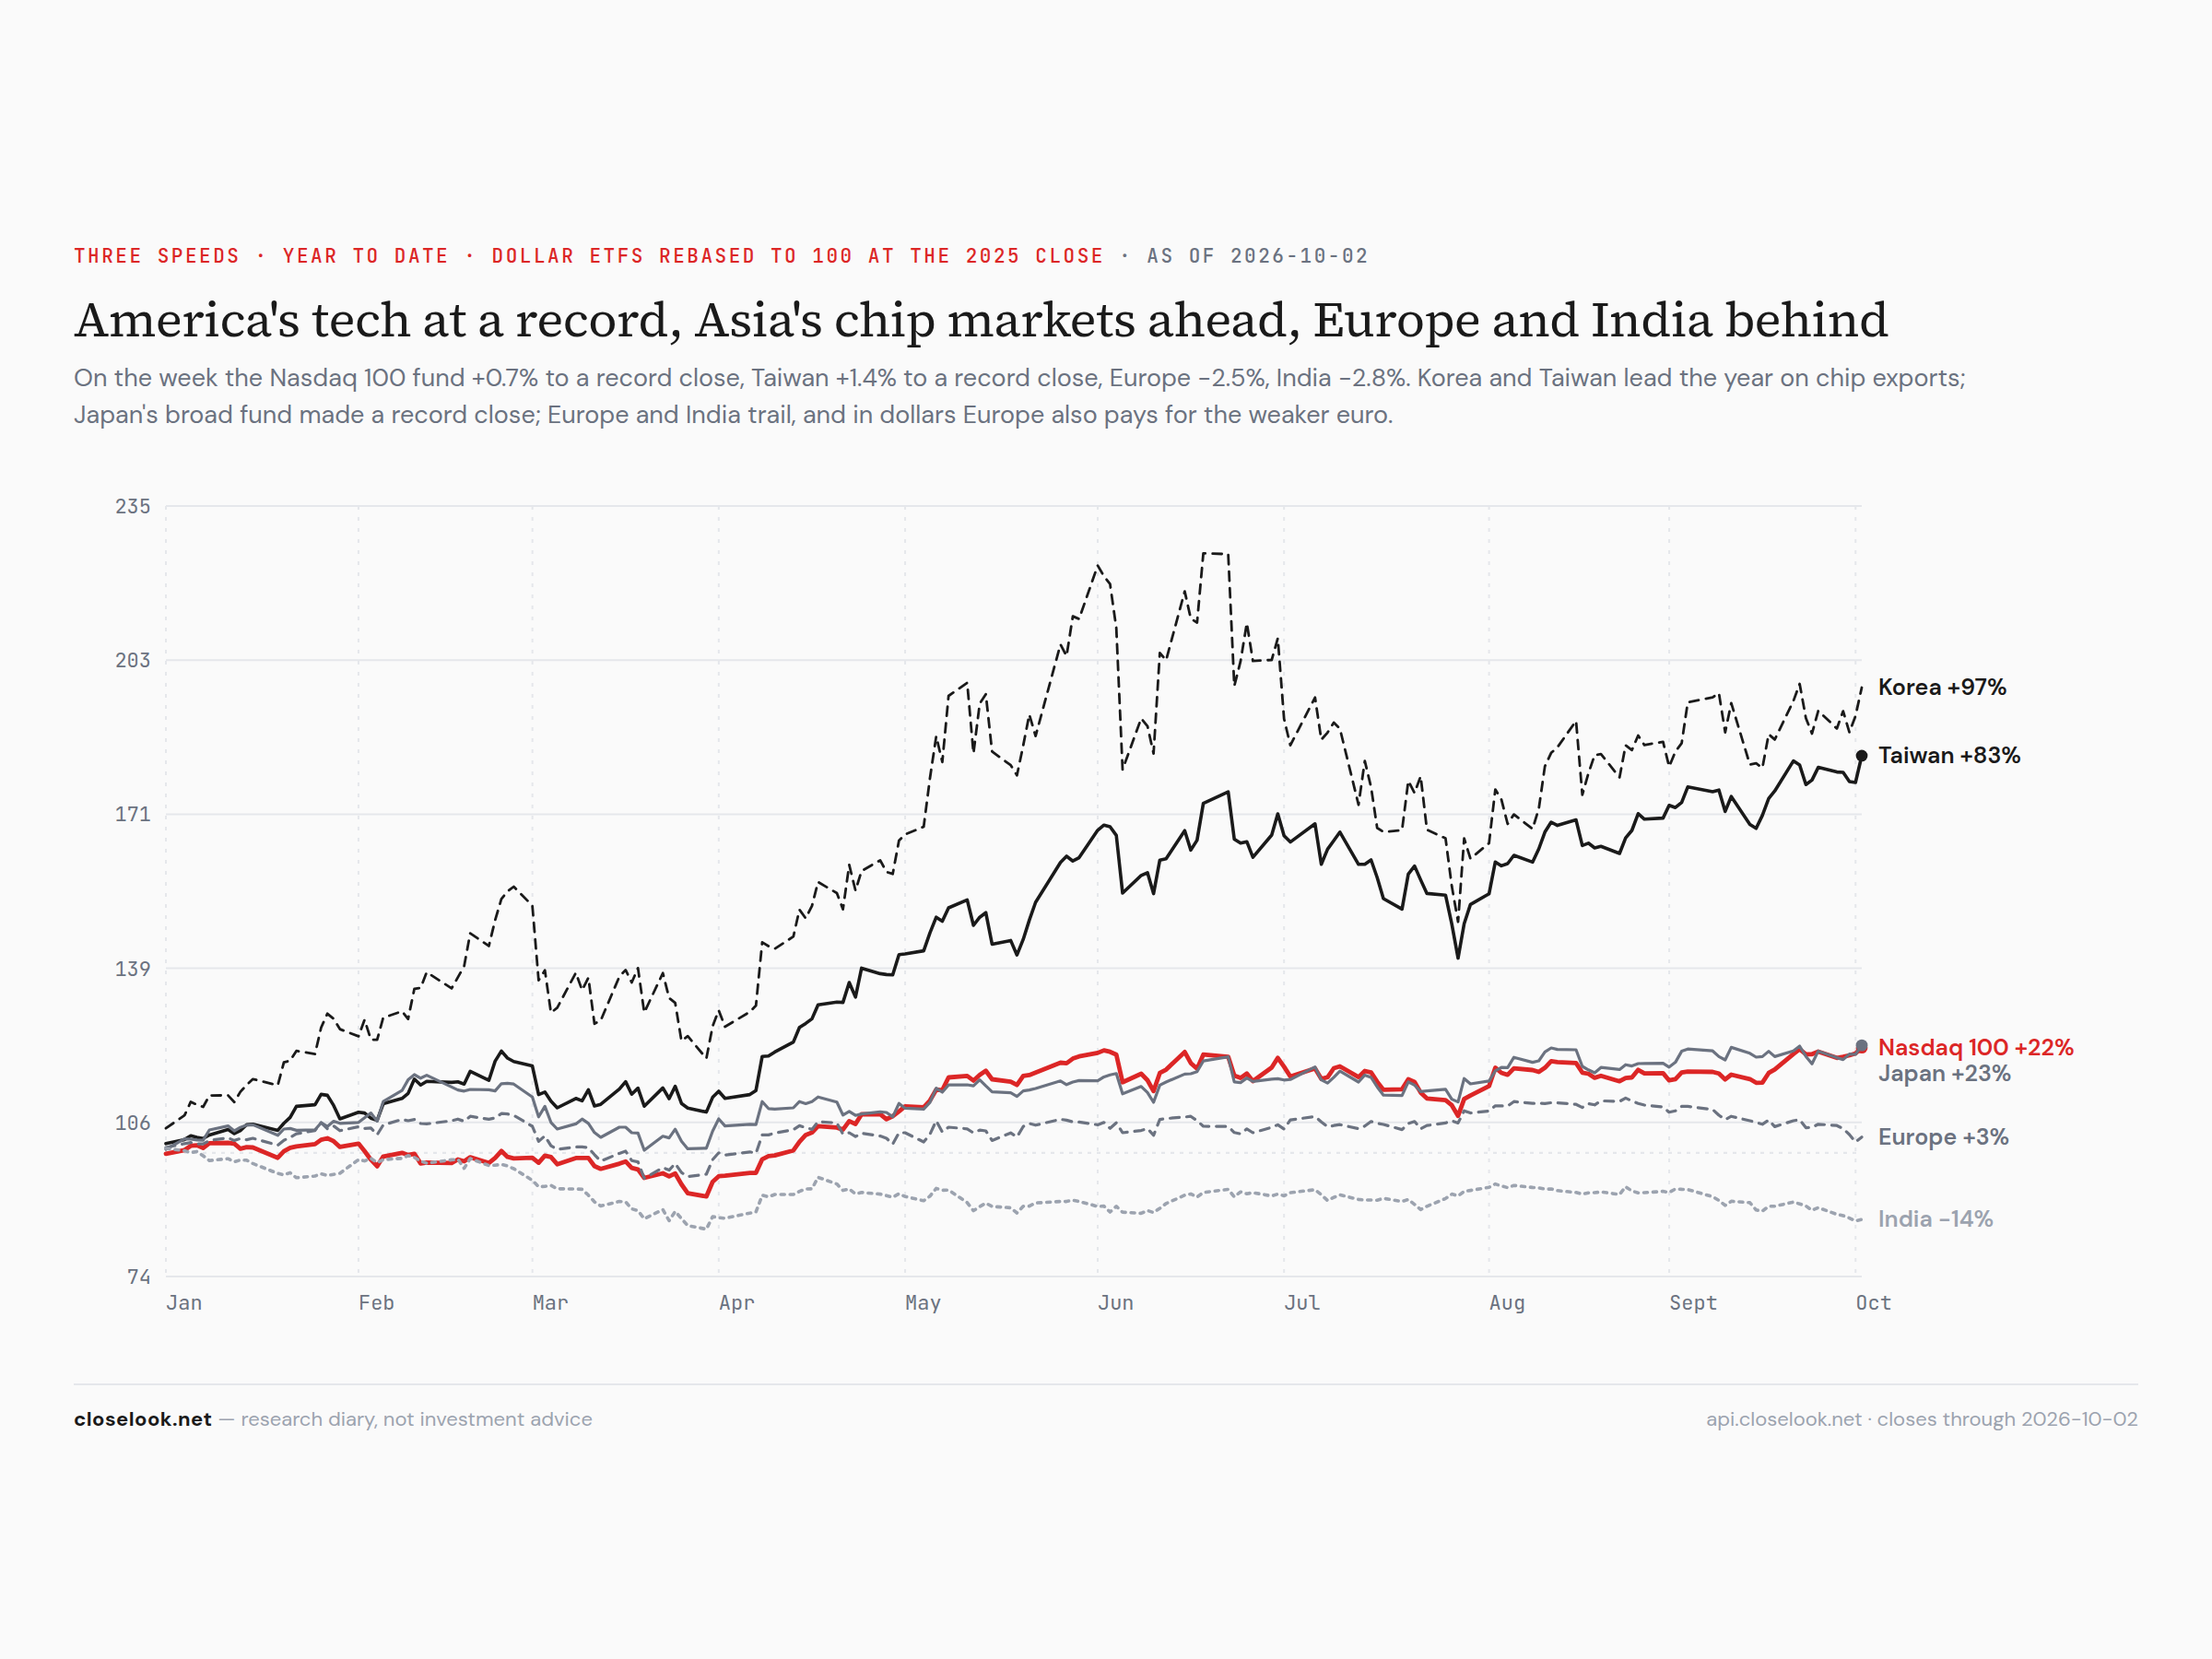
On the year the gap is the whole story: Korea +97%, Taiwan +83%, Japan +23%, the Nasdaq 100 +22% — against Europe +3% and India −14% in dollars. Four of the six legs in that chart carry the AI build-out — the chips, the chip equipment, the platforms that buy them. The two that do not are the two at the bottom.
The dollar — the high of the year, and the euro at its low. The third speed has a currency attached. The dollar fund rose 0.94% and made its highest close of 2026 on Thursday at 28.96; the dollar index closed Friday at 101.92, +0.94%. Against the euro the move was larger: EUR/USD fell 1.22% to 1.1253, after 1.1248 on Thursday — the euro's lowest close of the year — and is down 4.2% since January. A weaker euro is the European market's second cost this year: a dollar investor who owns Europe loses on the market and again on the translation, and a euro investor at home holds an asset that buys less of everything priced in dollars, from chips to oil.
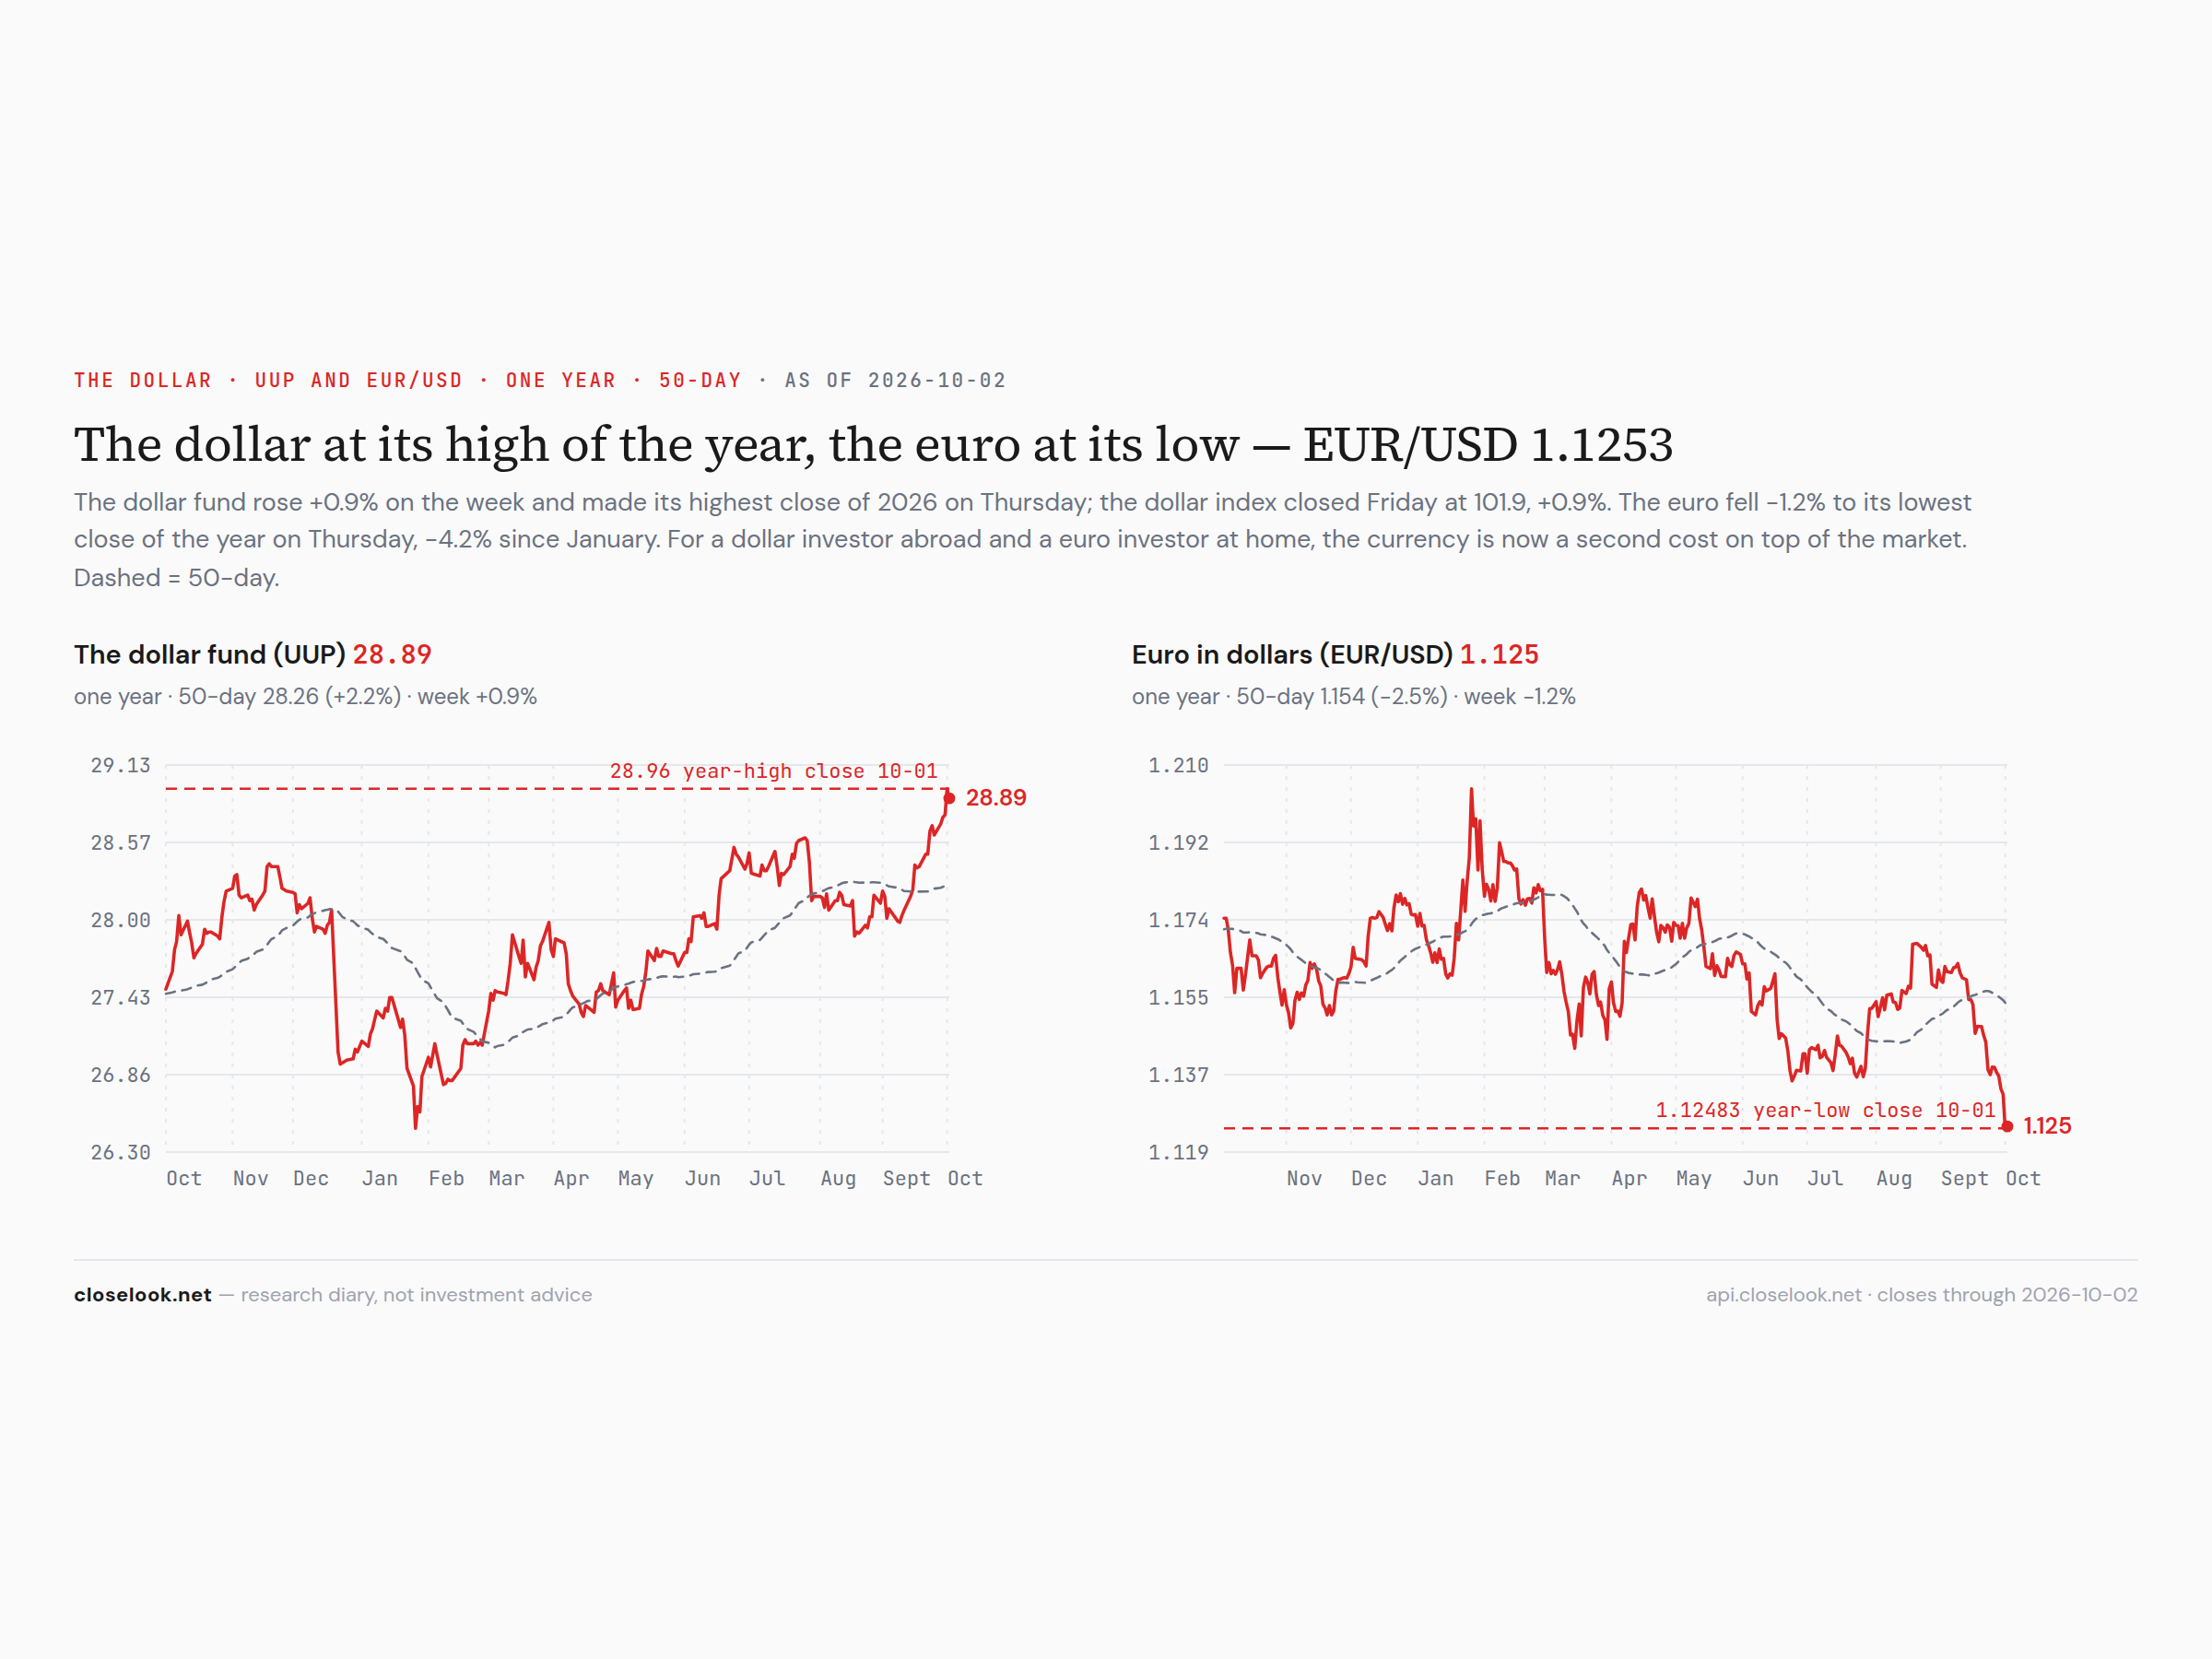
Why the dollar is strong — the same reason the yields are high. America's yields rise because its economy grows; Europe's rise because its sovereign credit is weaker and its growth is not there — Friday's Pulse set the two side by side, country by country. A rate rise for growth draws money in; a rate rise for credit pushes it out. The dollar is where that difference shows up first. This week it showed up in a jobs report that was weak — 29,000 jobs in September, with July and August cut by 60,000 — and a ten-year yield that ended the day higher anyway, at 5.28%, while the euro made its low. When weak American data cannot weaken the dollar, the market is telling you how it ranks the alternatives.
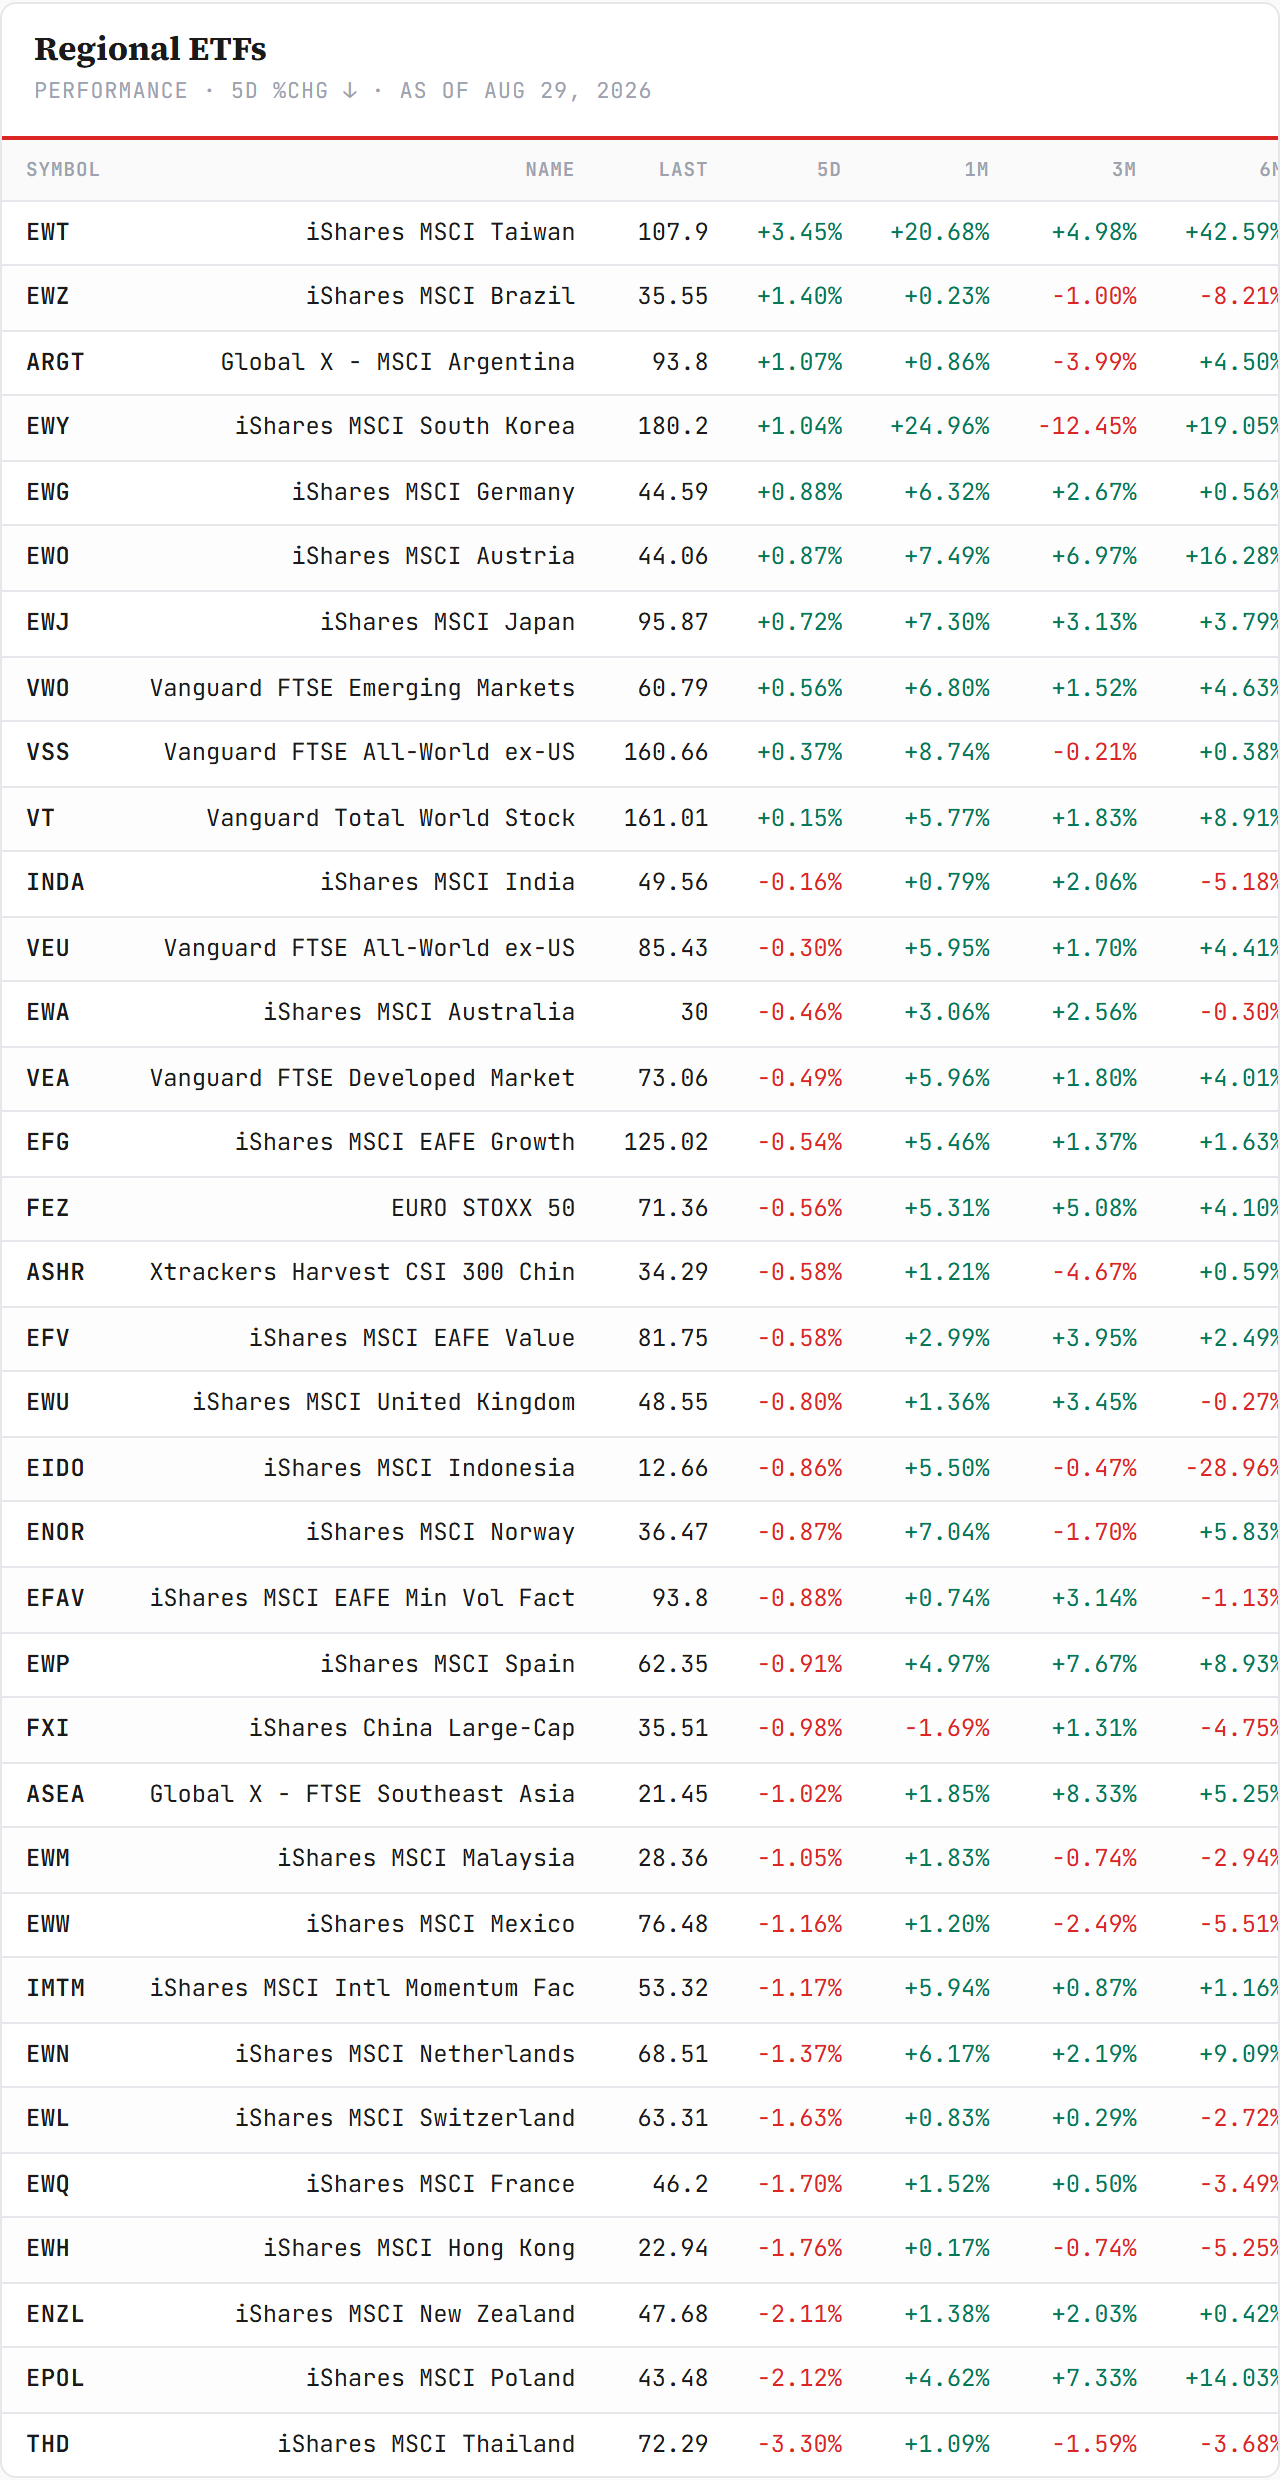
The regional board — five green of thirty-five. The top five: Brazil +3.72%, Korea +2.51%, Taiwan +1.35%, Japan +1.01%, EAFE growth +0.08%. The bottom: Austria −5.18%, Spain −4.72%, Argentina −4.60%, Poland −4.06%, France −3.69%, Hong Kong −3.10%, Mexico −3.07%. Last week twenty-two were green; this week five. The best-to-worst spread widened to 8.90 points from 7.38. A red board that widens is money leaving most places and concentrating in a few — and the few are the same chip corridor as last week, with Brazil the one commodity exception.
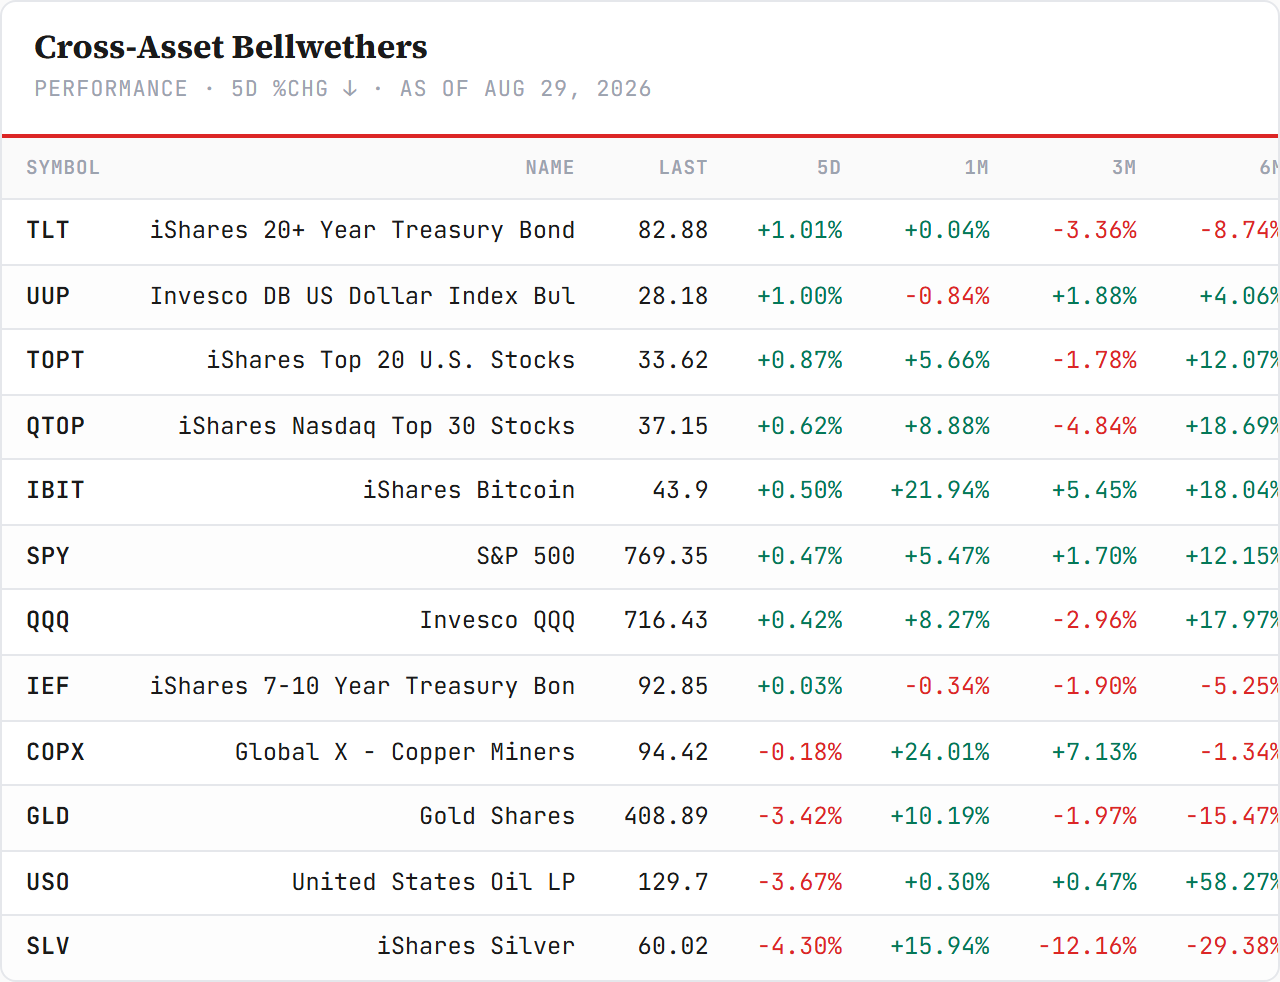
The cross-asset backdrop — the dollar and the Nasdaq, nothing else. Four green of twelve: the dollar fund +0.94%, the Nasdaq top-30 fund +0.90%, the Nasdaq 100 +0.68%, the bitcoin fund +0.34%. The red eight: silver −5.85%, gold −3.37%, the long bond −2.32%, the belly −1.06%, copper miners −0.95%, oil −0.65%, the US top-20 fund −0.37%, the S&P −0.22%. Oil slipped as Washington offered barrels from its strategic reserve on Wednesday. In one line: the market bought the currency of the country that grows and the stocks of the companies that grow fastest inside it, and sold everything that stores value — metal, duration, even the top-20 megacap basket.
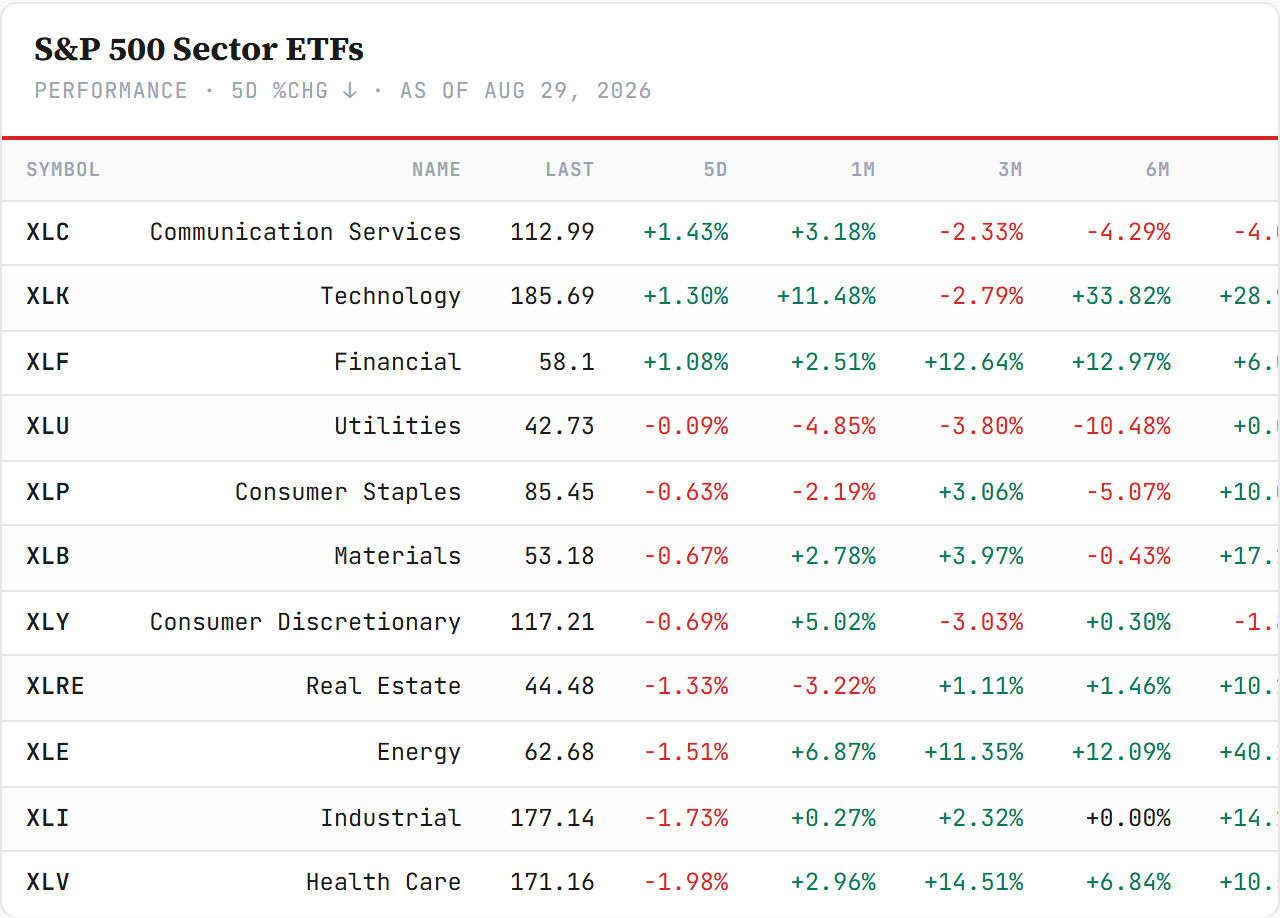
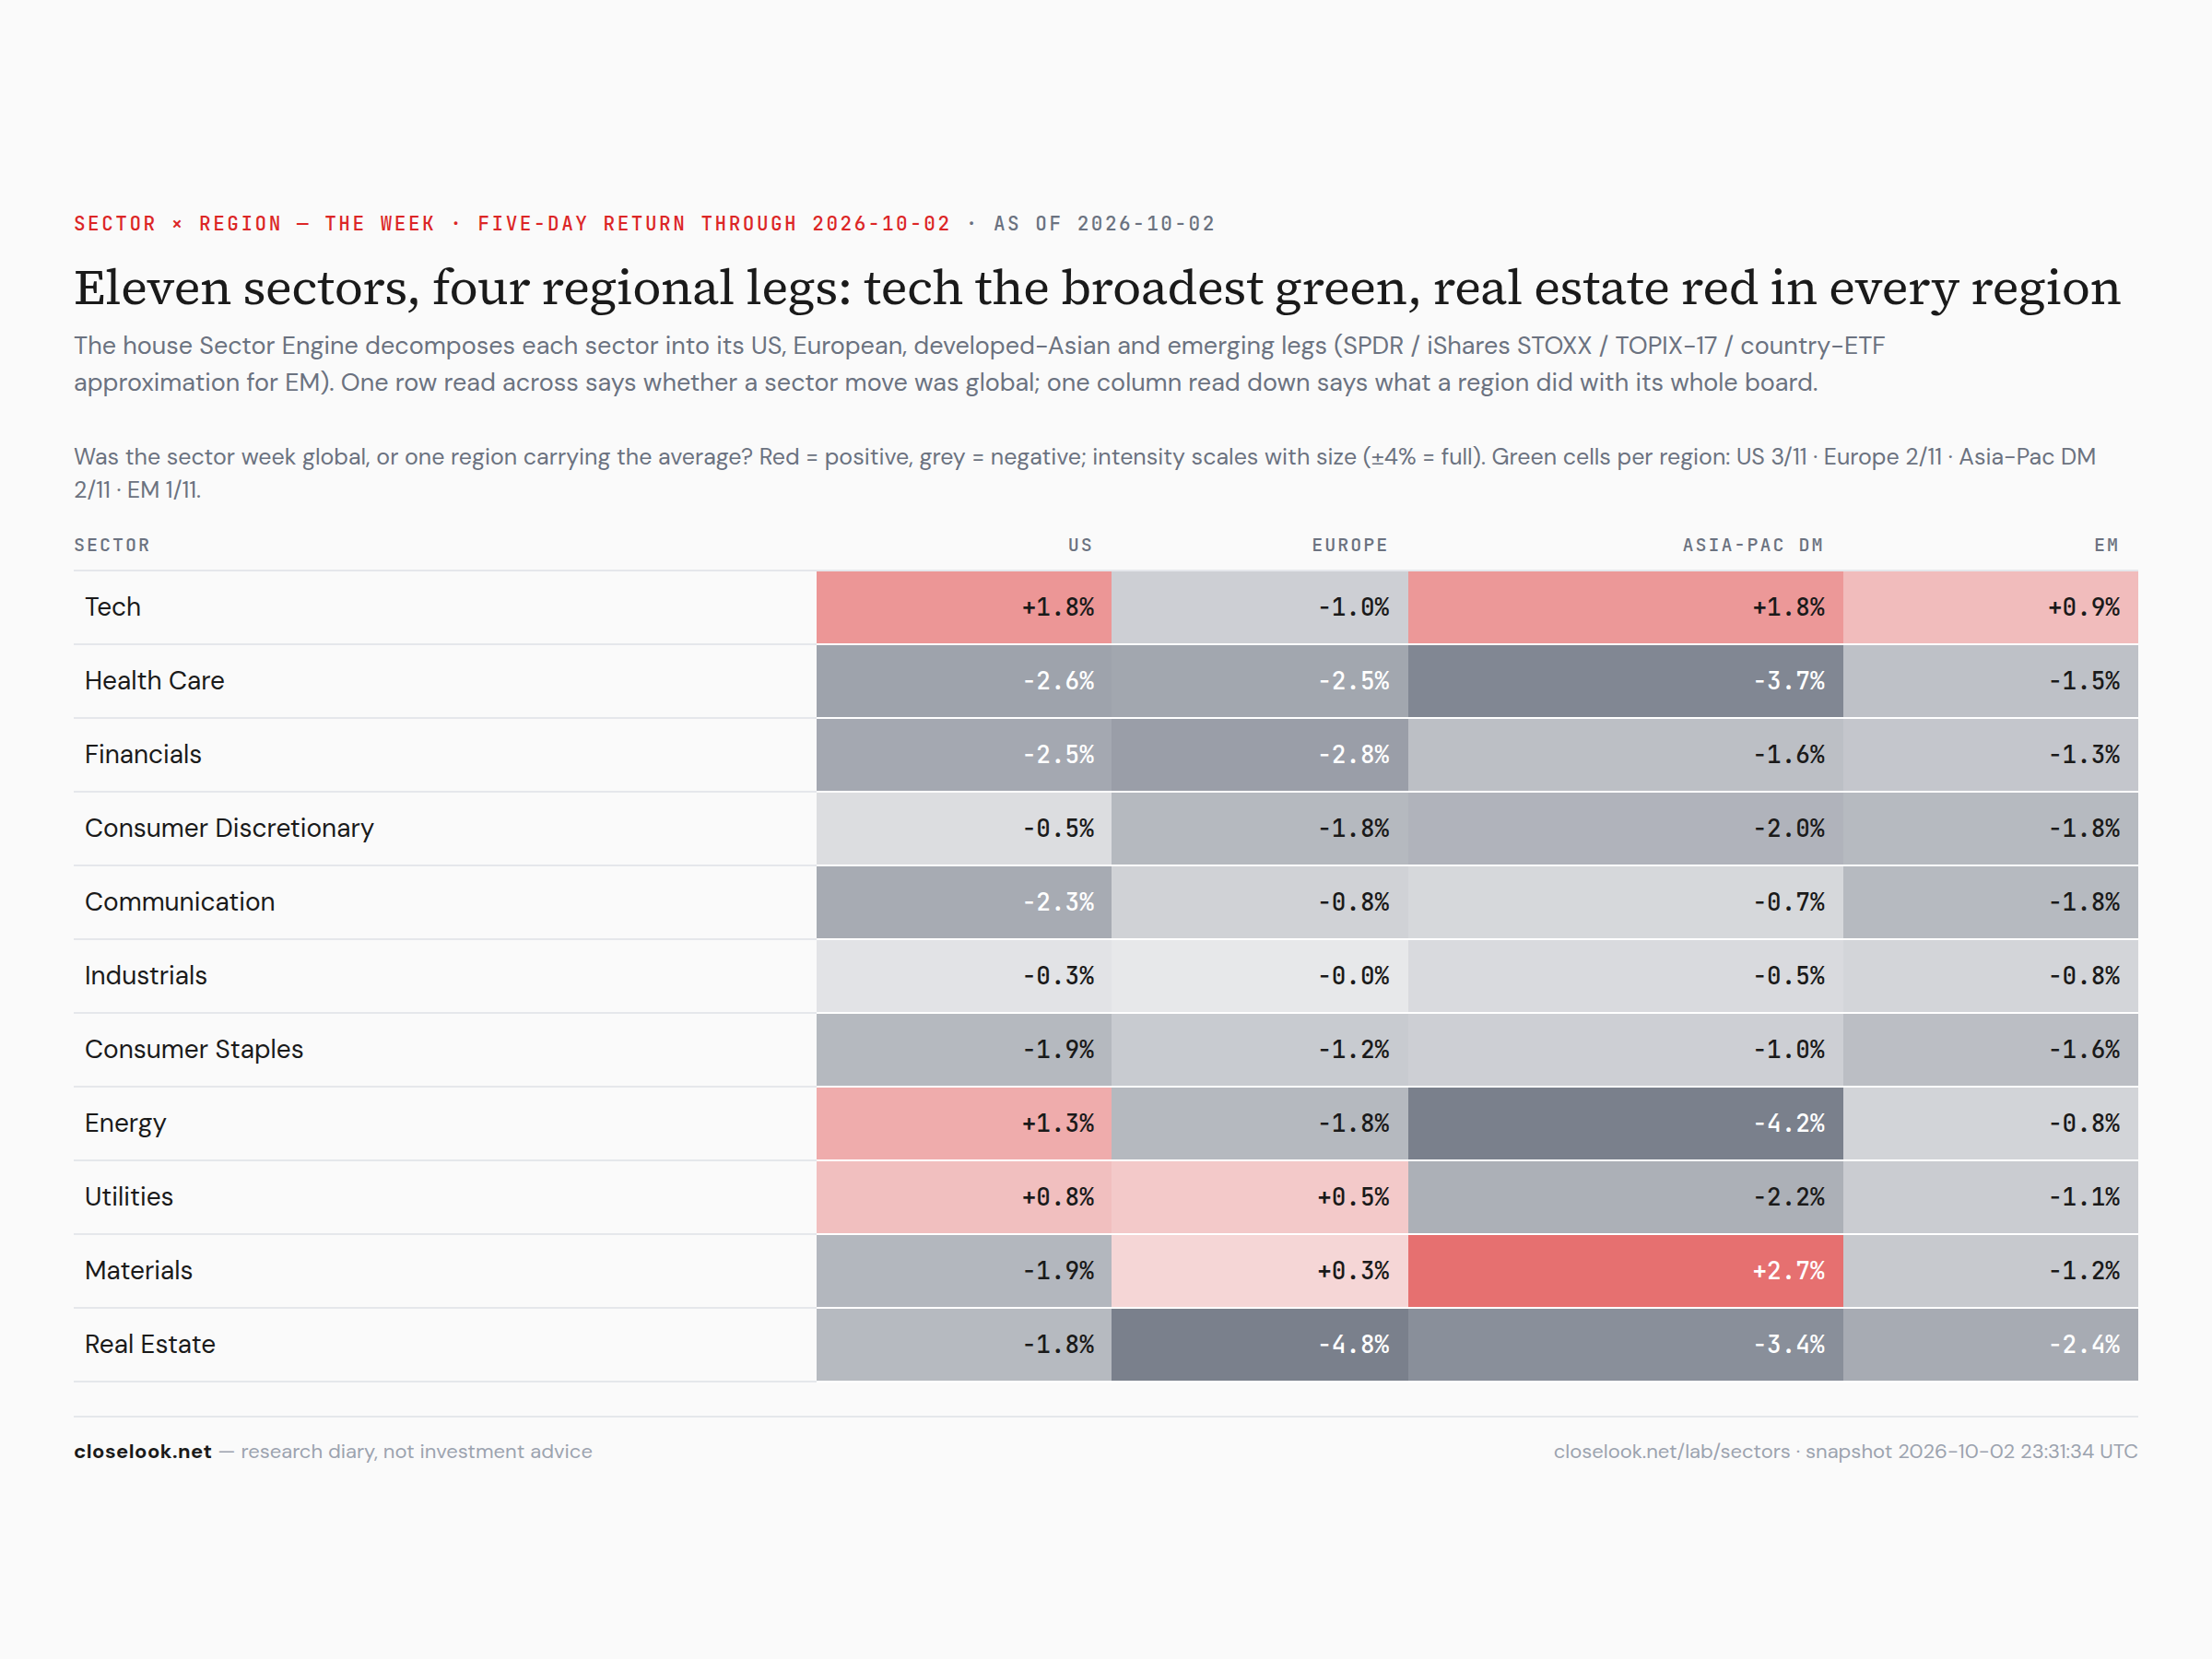
The US sectors — three of eleven green. Technology +1.80%, energy +1.26%, utilities +0.81%. The bottom: health care −2.65%, financials −2.46%, communications −2.34%, materials −1.89%, staples −1.86%, real estate −1.80%. Communications fell with Meta's week after its agent rally; financials fell as the long end rose again. The equal-weight S&P fell 0.65% and small caps 0.16%. The index was held up by one sector, and that sector made a record.
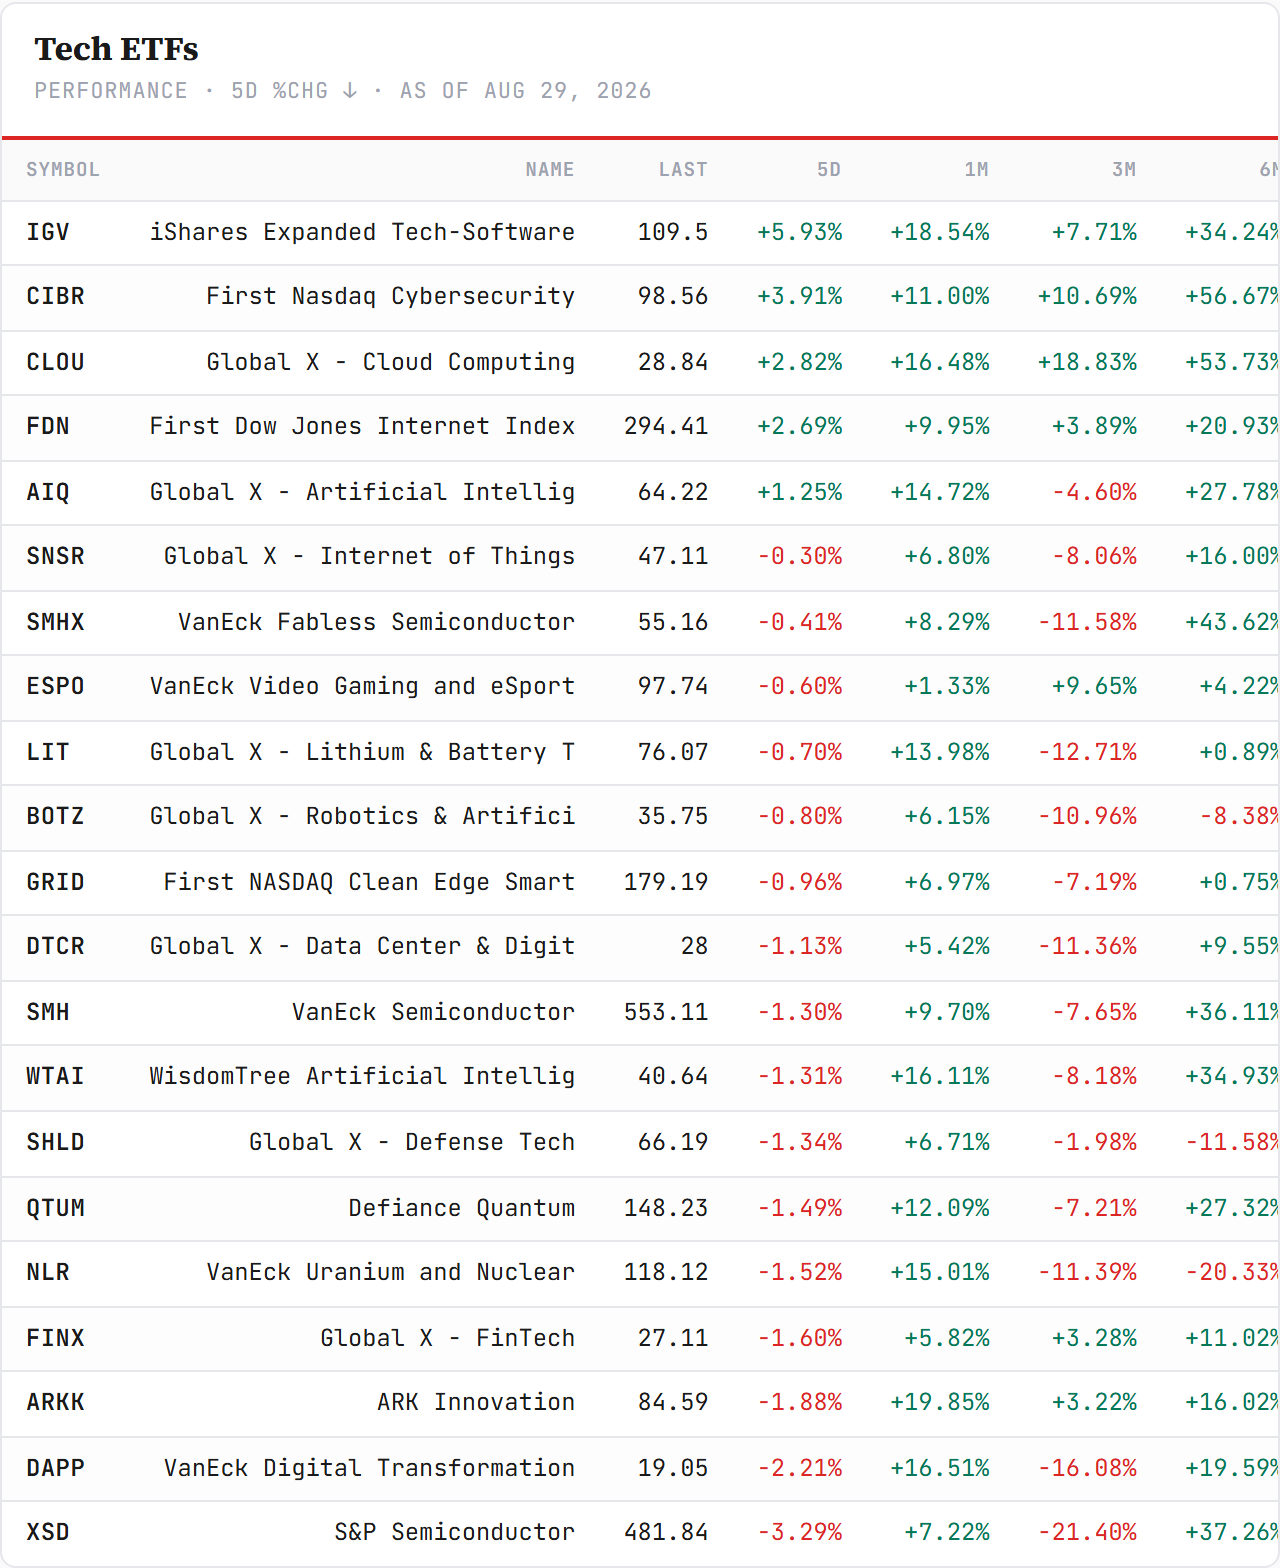
The tech ETFs — fifteen of twenty-one green. The chip majors +3.96%, cybersecurity +3.71%, the WisdomTree AI fund +3.19%, the fabless vehicle +2.82%, the equal-weight semis +2.68%, software +2.28%. The red six: digital transformation −6.37%, fintech −4.02%, uranium −2.87%, data centers −2.05%, defense tech −2.00%, ARK −1.04%. The memory vehicle DRAM was flat (−0.21%) after Micron's record quarter on Wednesday — the numbers were superb and the stocks did not move, a market that had already paid for them. Software rose with the chips for a second week: both halves of the stack bid at once.
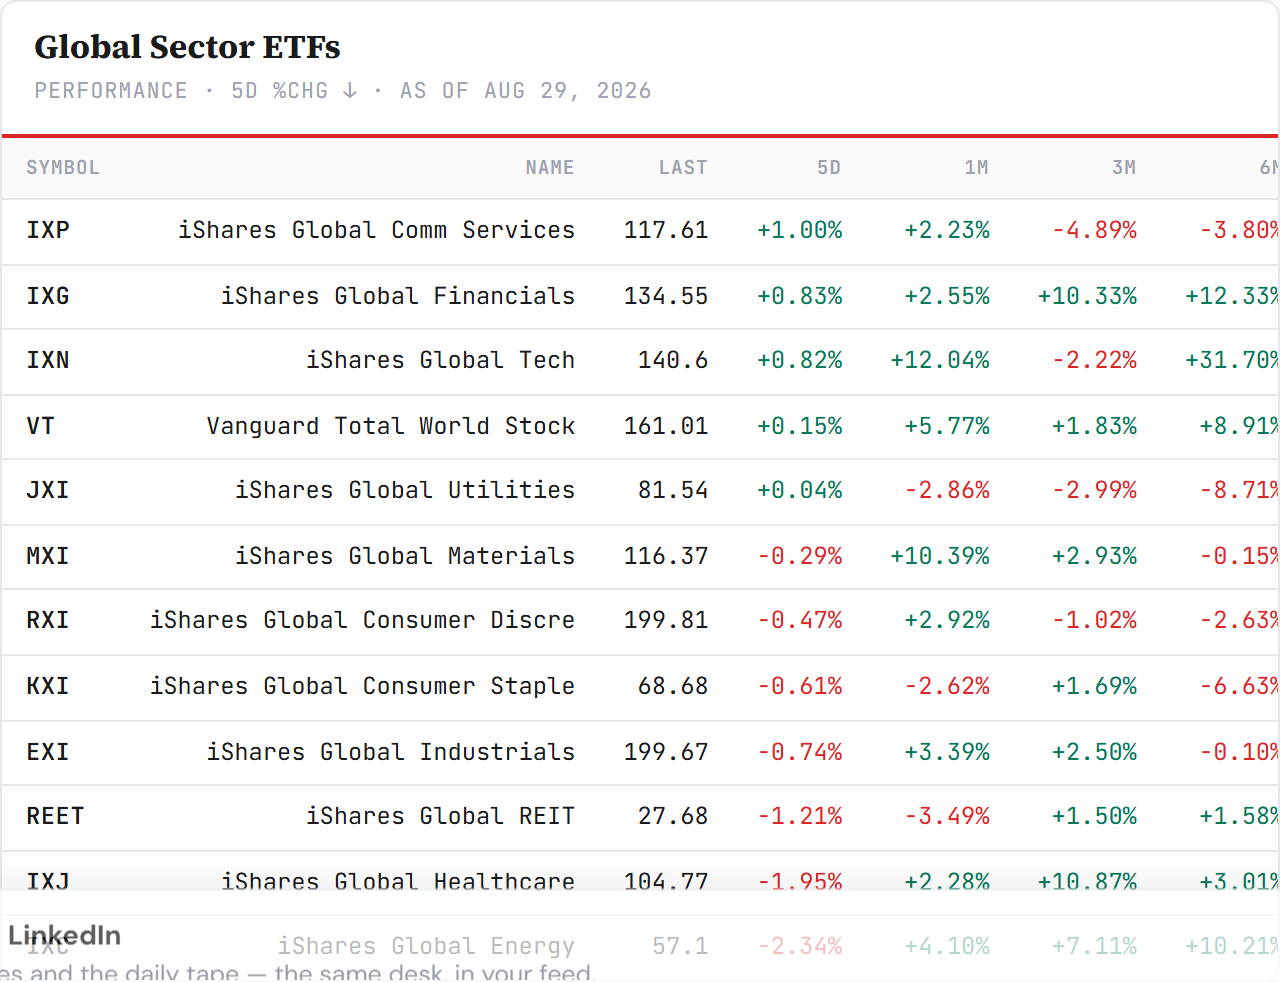
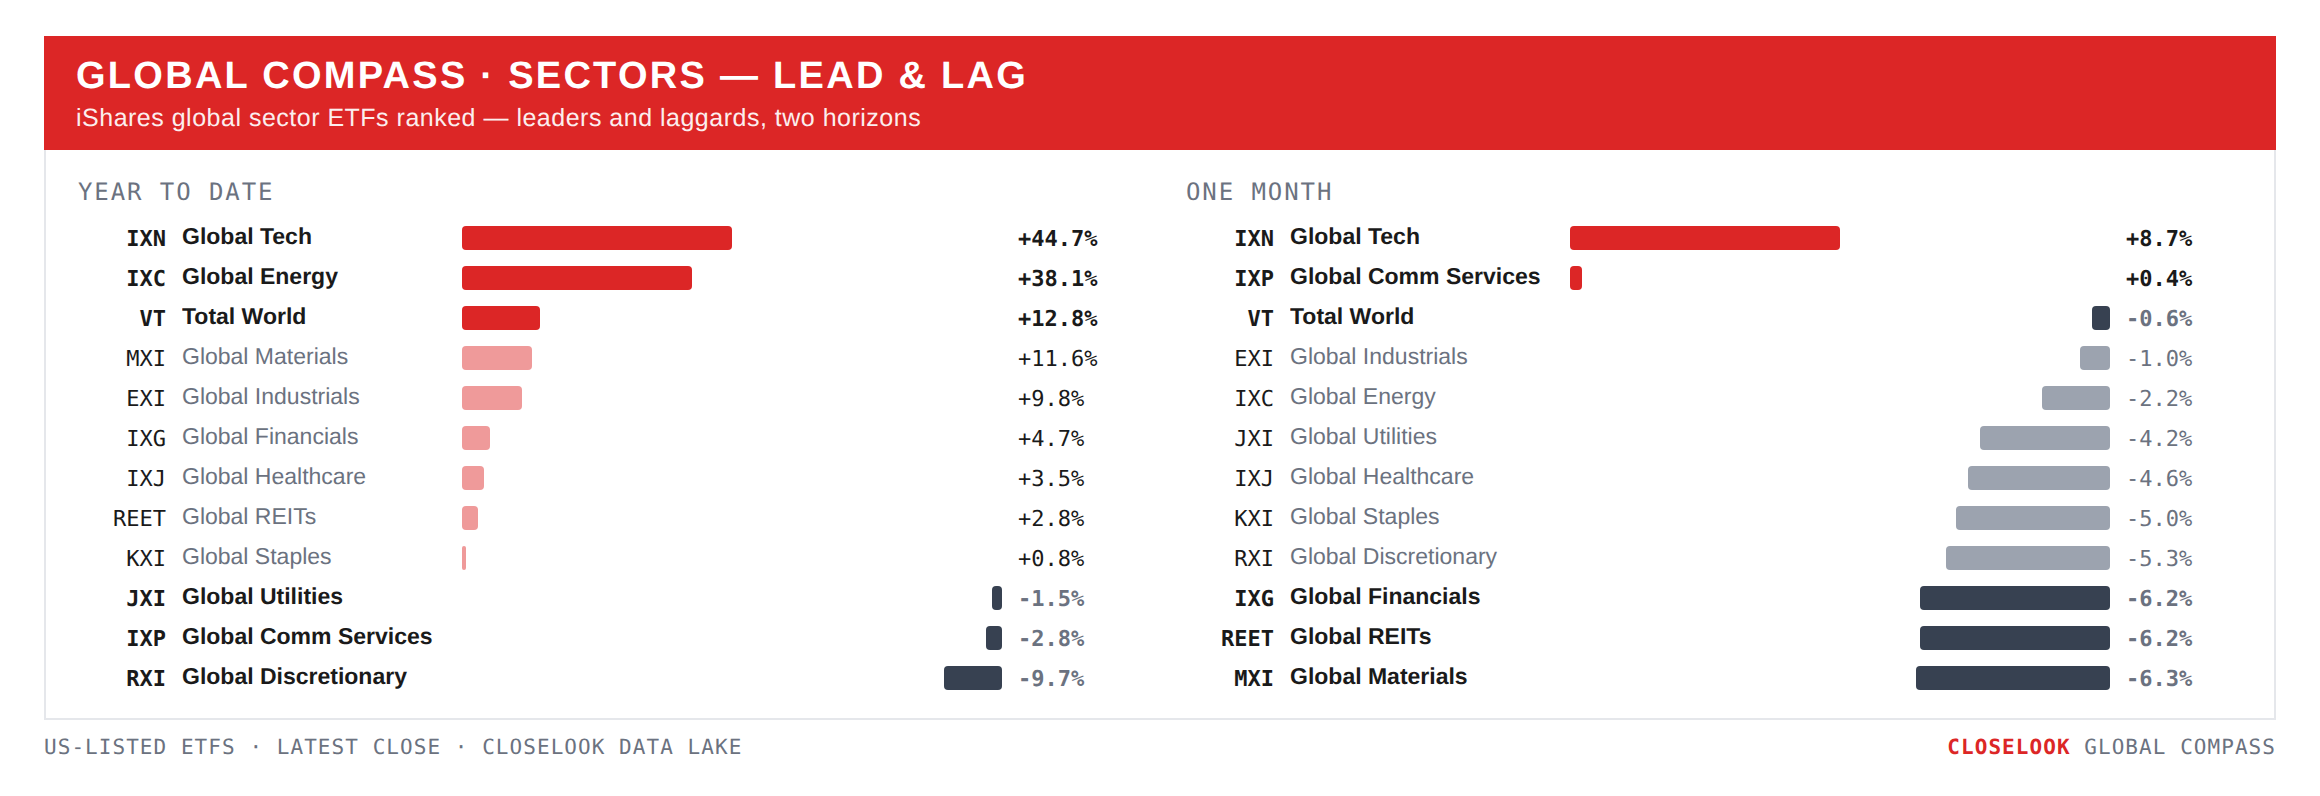
The global sectors — tech at a record, the rest red. Three of eleven green: technology +2.00% to 151.94 — a record close, through the 149.74 June high — energy +0.78%, utilities +0.16%. The bottom: health care −2.91%, financials −2.90% to 126.43, staples −2.21%, communications −2.12%, REITs −1.61%, materials −1.40% to 107.80. Financials spent a fourth week under the 134.55 August line, materials a sixth under the February line. One global sector at a record, the cyclical and defensive benches both lower: that is concentration, not breadth.
Was the sector week global, or one region carrying it? The house Sector Engine decomposes each sector into four regional legs. Technology rose in three of the four: the US +1.8%, developed Asia +1.8%, emerging markets +0.9% — and fell in Europe, −1.0%. Real estate fell in every region, Europe worst at −4.8%; health care fell in all four. The US-minus-Europe spread was positive in eight sectors of eleven, technology +2.8 points, real estate +2.9, energy +3.1. Last week tech was green in every region. This week Europe's leg broke away — the same week its sovereign spreads widened.
The Global Compass
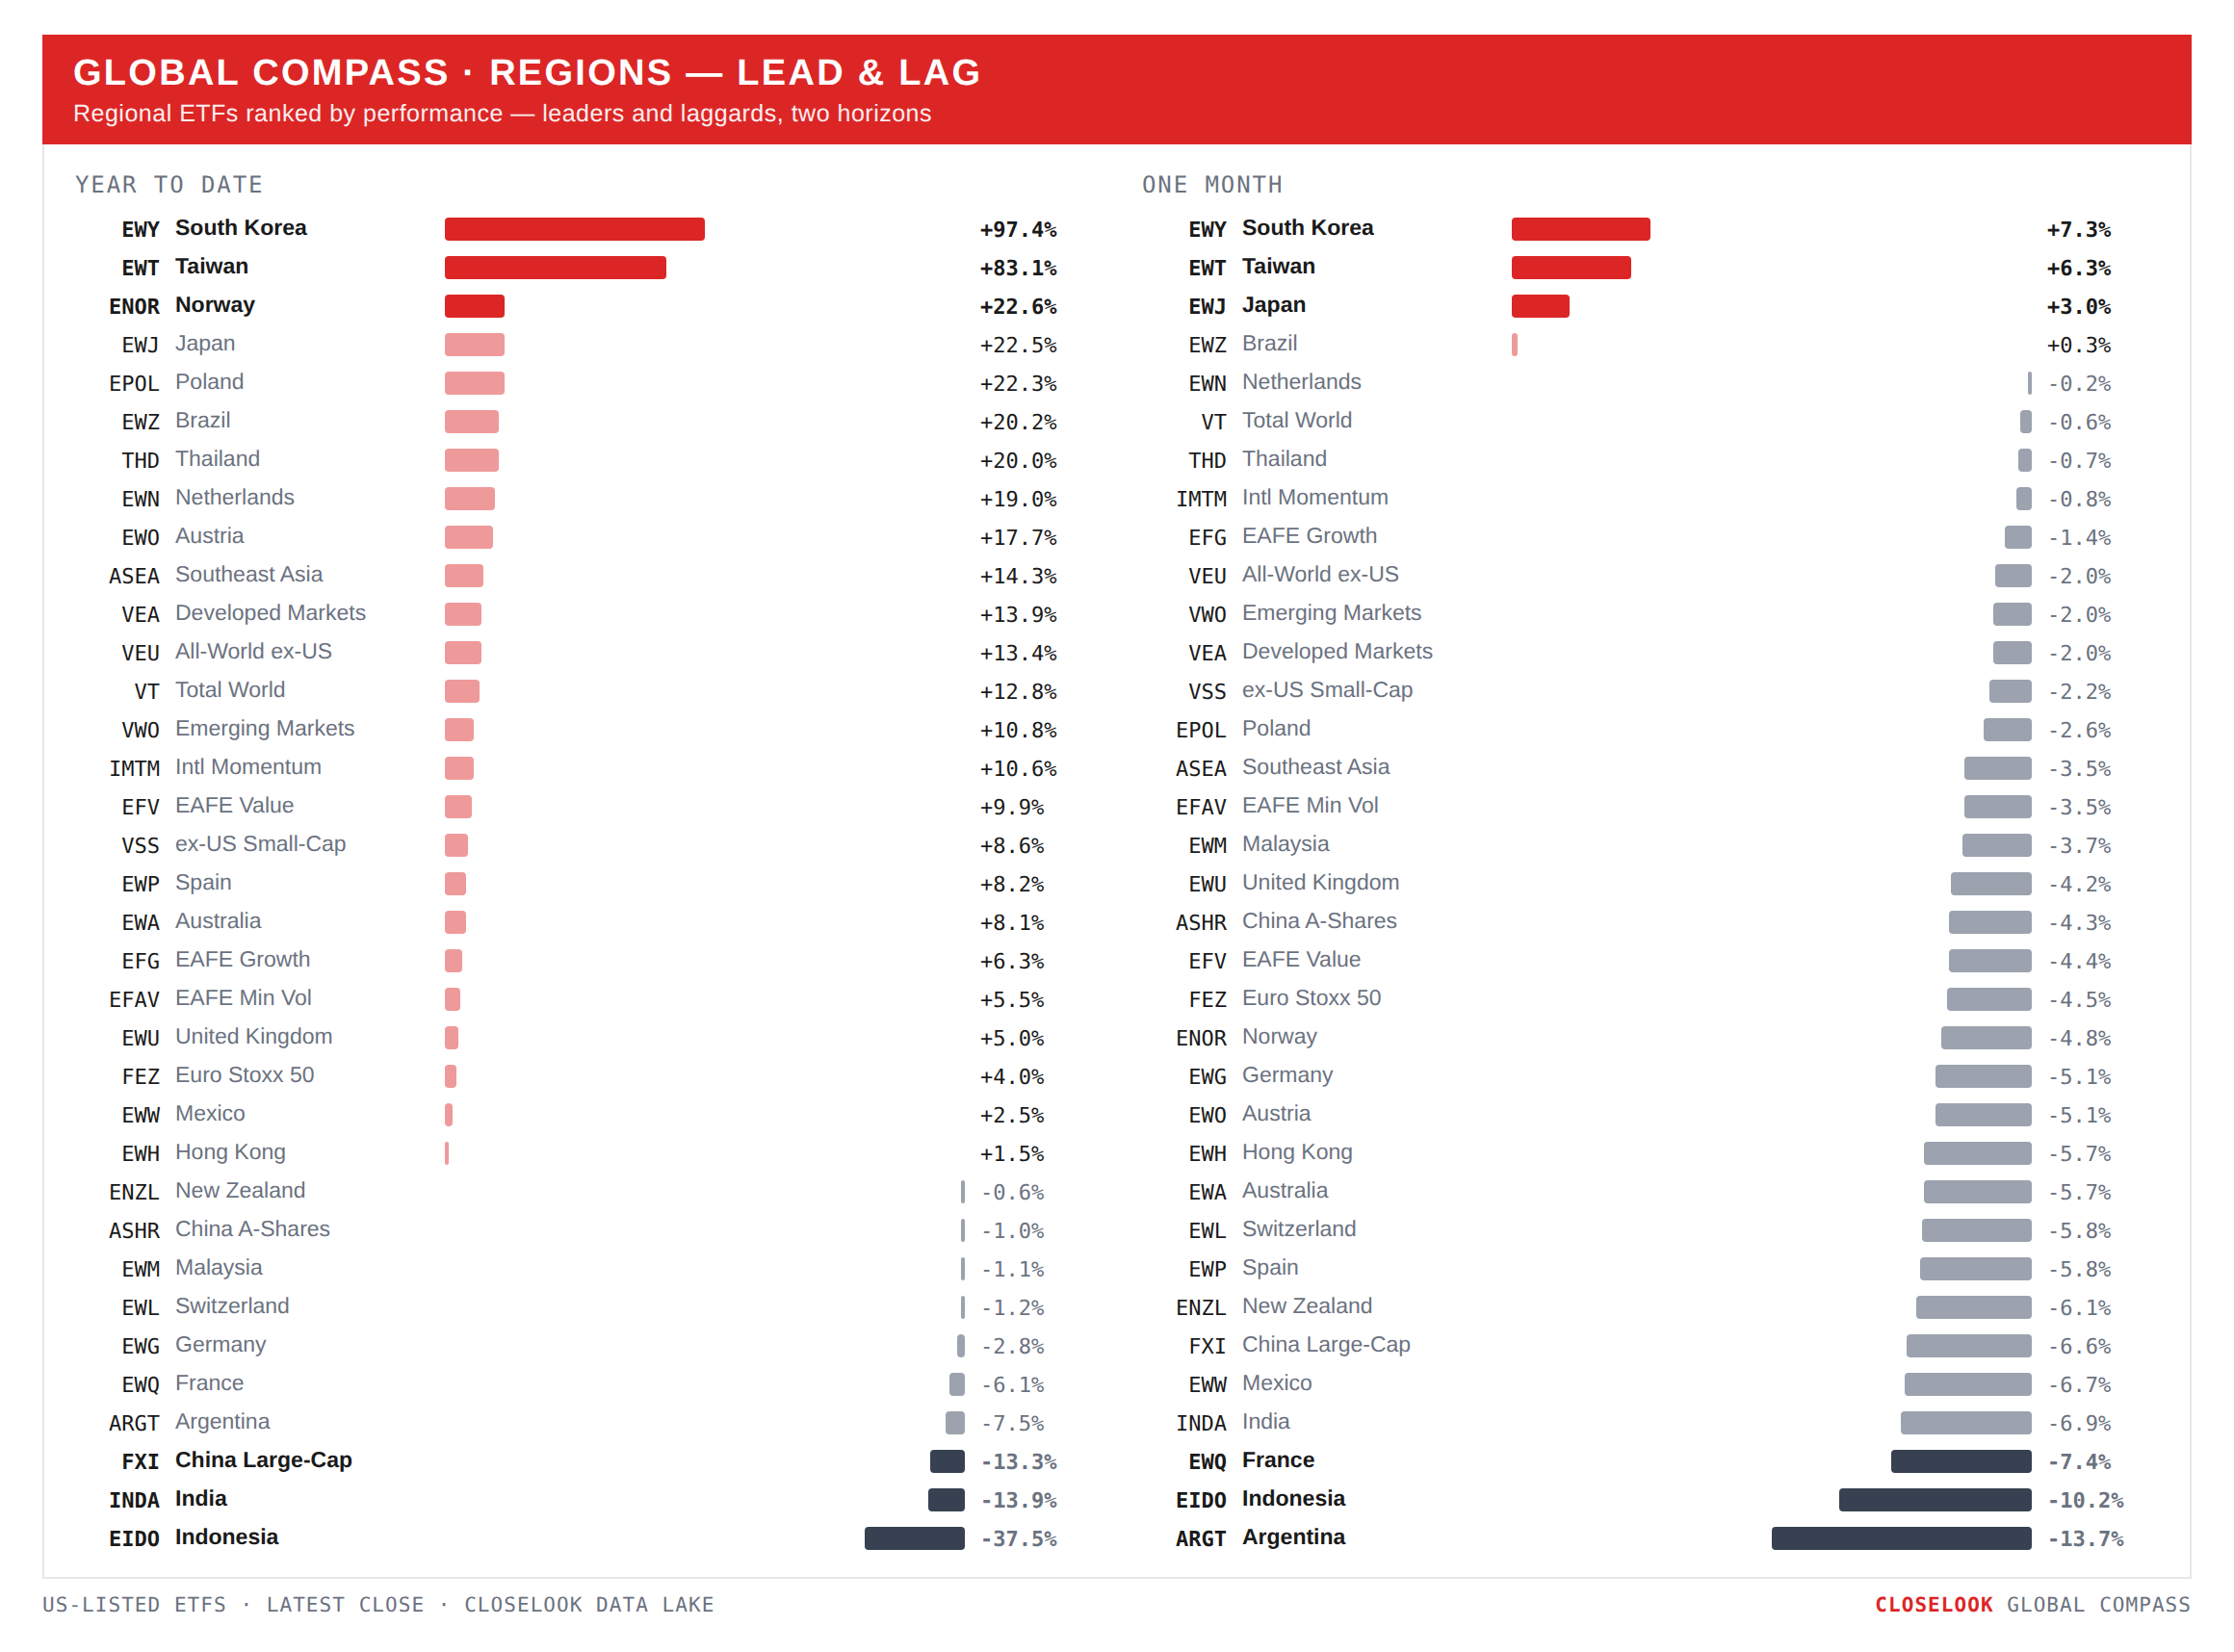
Regions: developed and emerging tied; the corridor beat both. VEA −0.99% against VWO −1.00% — a dead heat on the broad wrappers, both red, with the chip exporters at the top and Mexico, Hong Kong, India and Indonesia at the bottom. China's large caps fell 2.27% and its A-shares 1.75% into Golden Week, which shut the mainland from Thursday.
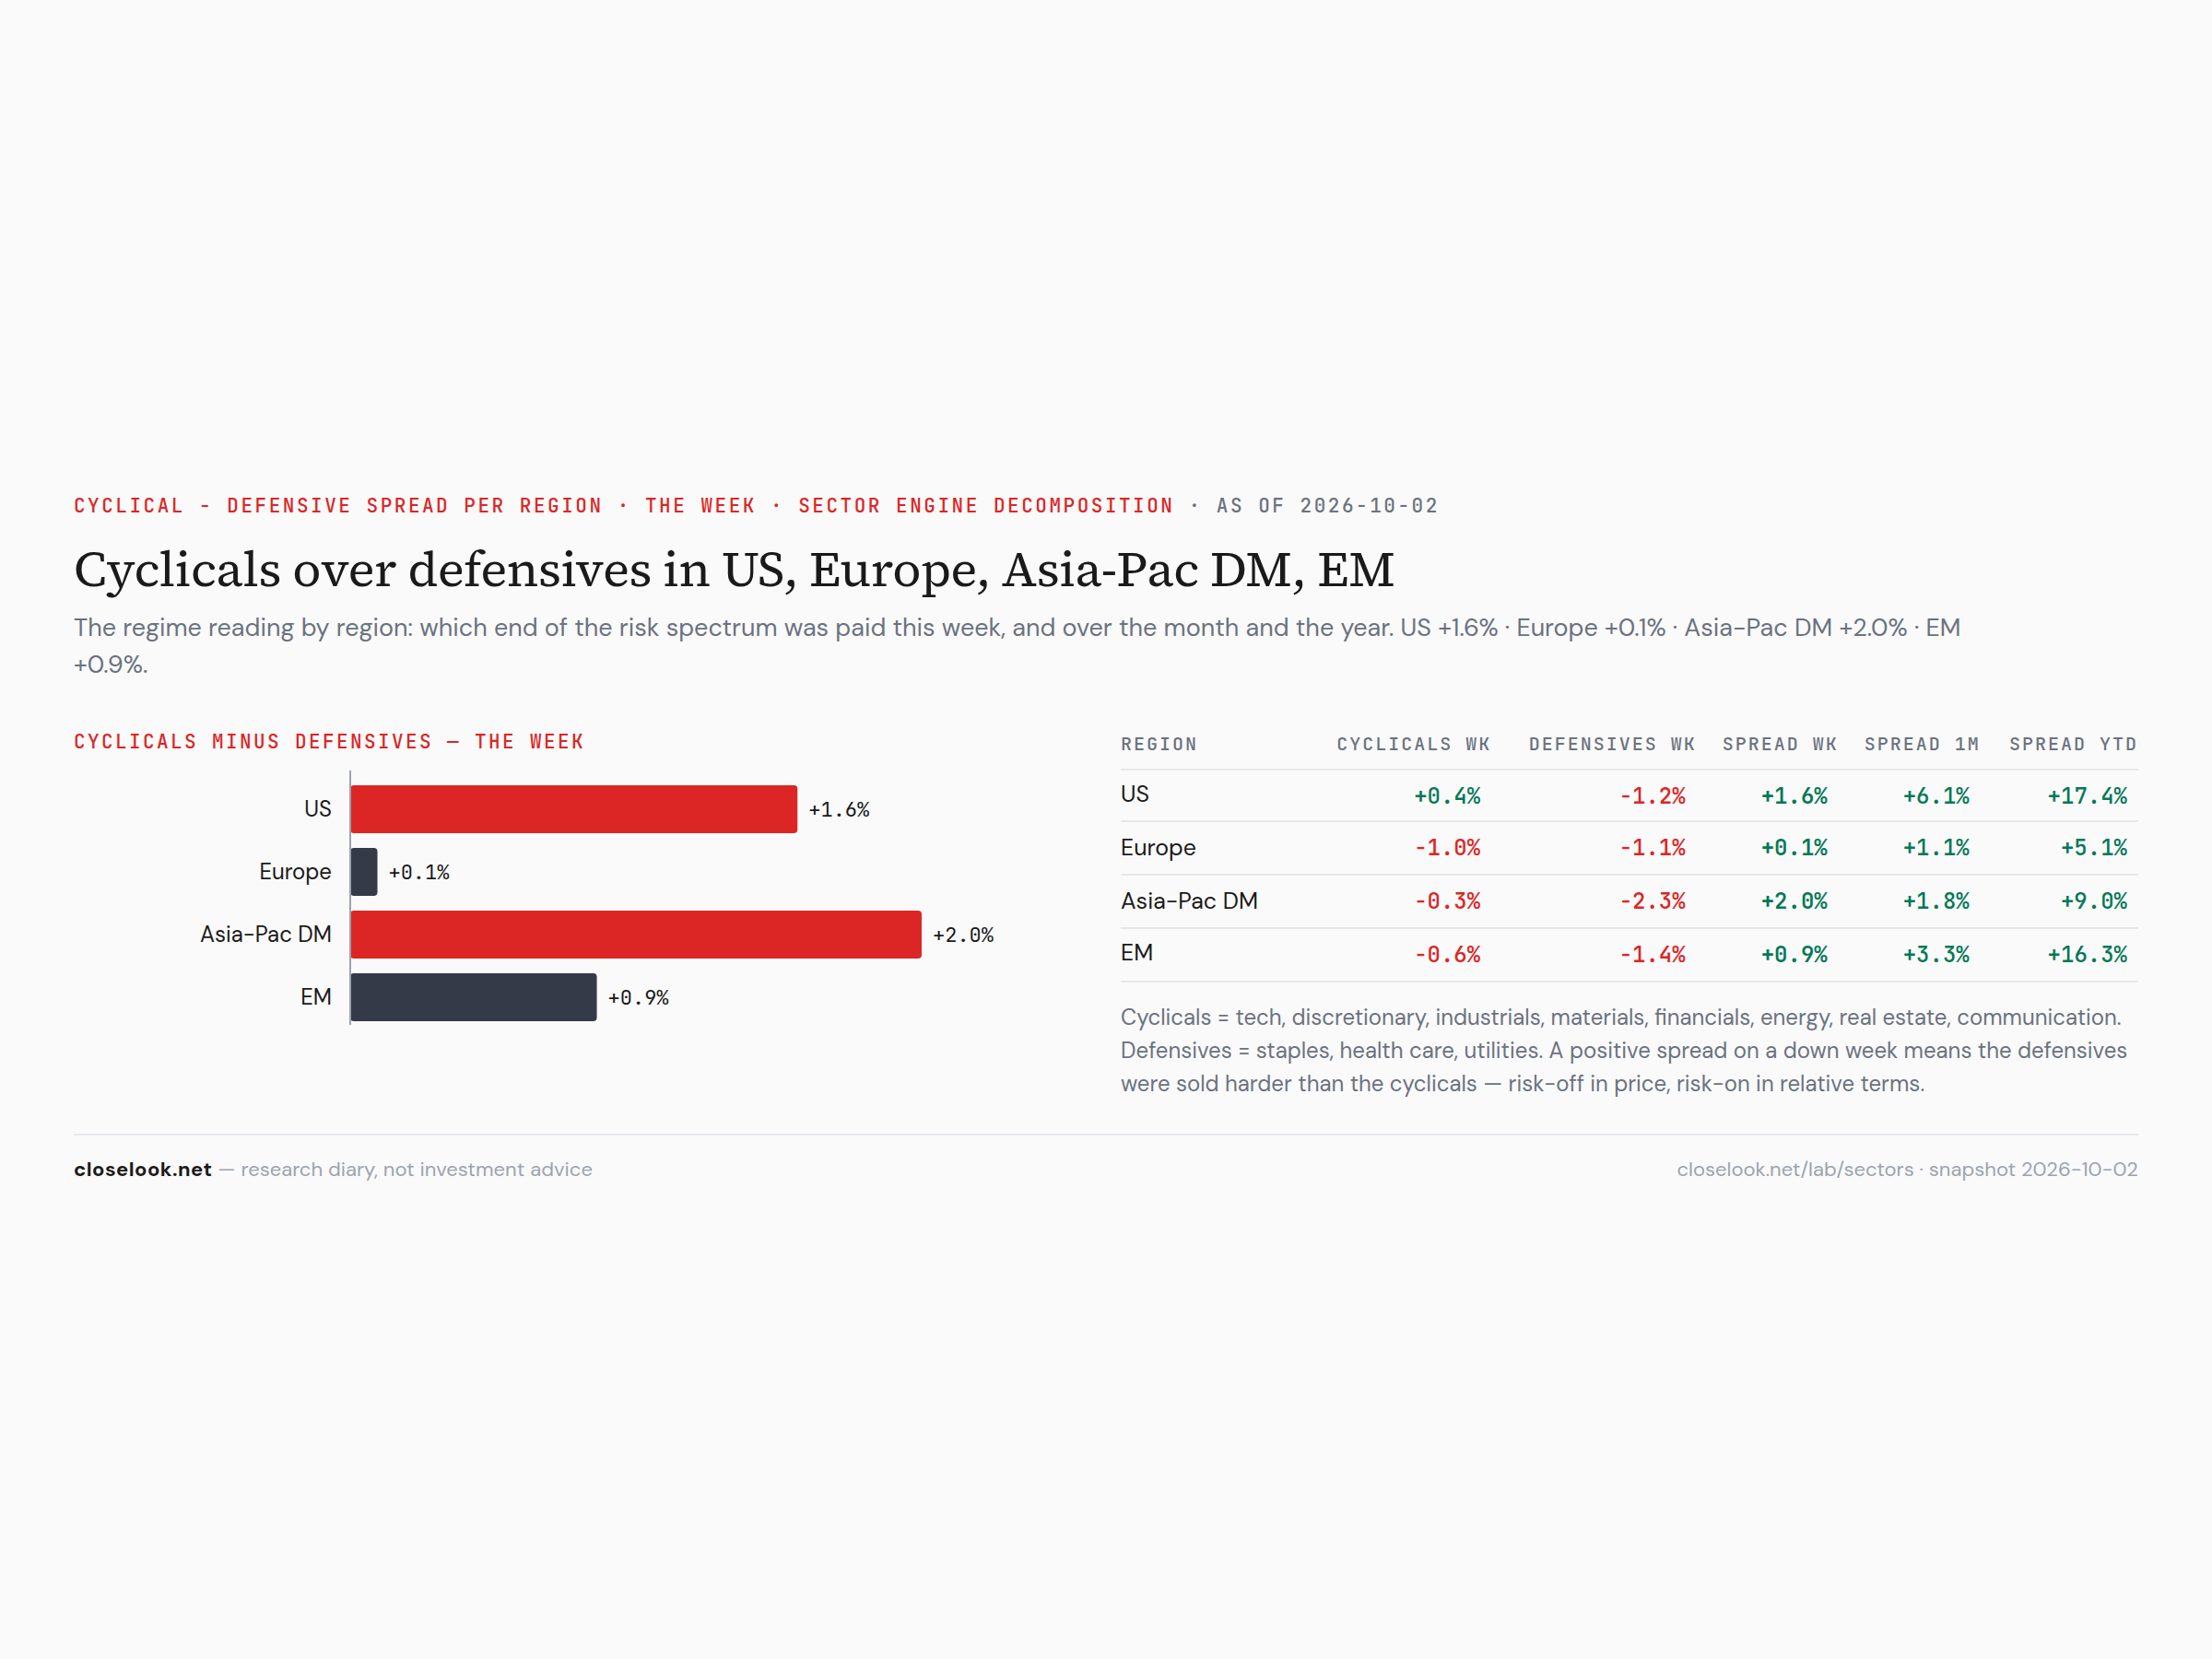
Sectors: cyclicals over defensives everywhere except Europe. The engine's cyclical-minus-defensive spread was +1.6 points in the US, +2.0 in developed Asia, +0.9 in emerging markets — and +0.1 in Europe, where cyclicals and defensives fell together. On the year the US spread is +17.4 points and Europe's +5.1. Europe did not rotate this week; it de-rated across the board.
Sectors: the leaders' bench, at the new distances. Technology 151.94, a record, after closing the 0.5% gap in two sessions. Industrials 192.47, 6.9% under August. Financials 126.43, 7.7% under its September 3 record, four weeks under its line. Materials 107.80, 9.0% under its August 25 record, six weeks under the February line. Last week the bench split; this week the split widened: one sector at the top, the commodity and credit pair drifting further down.
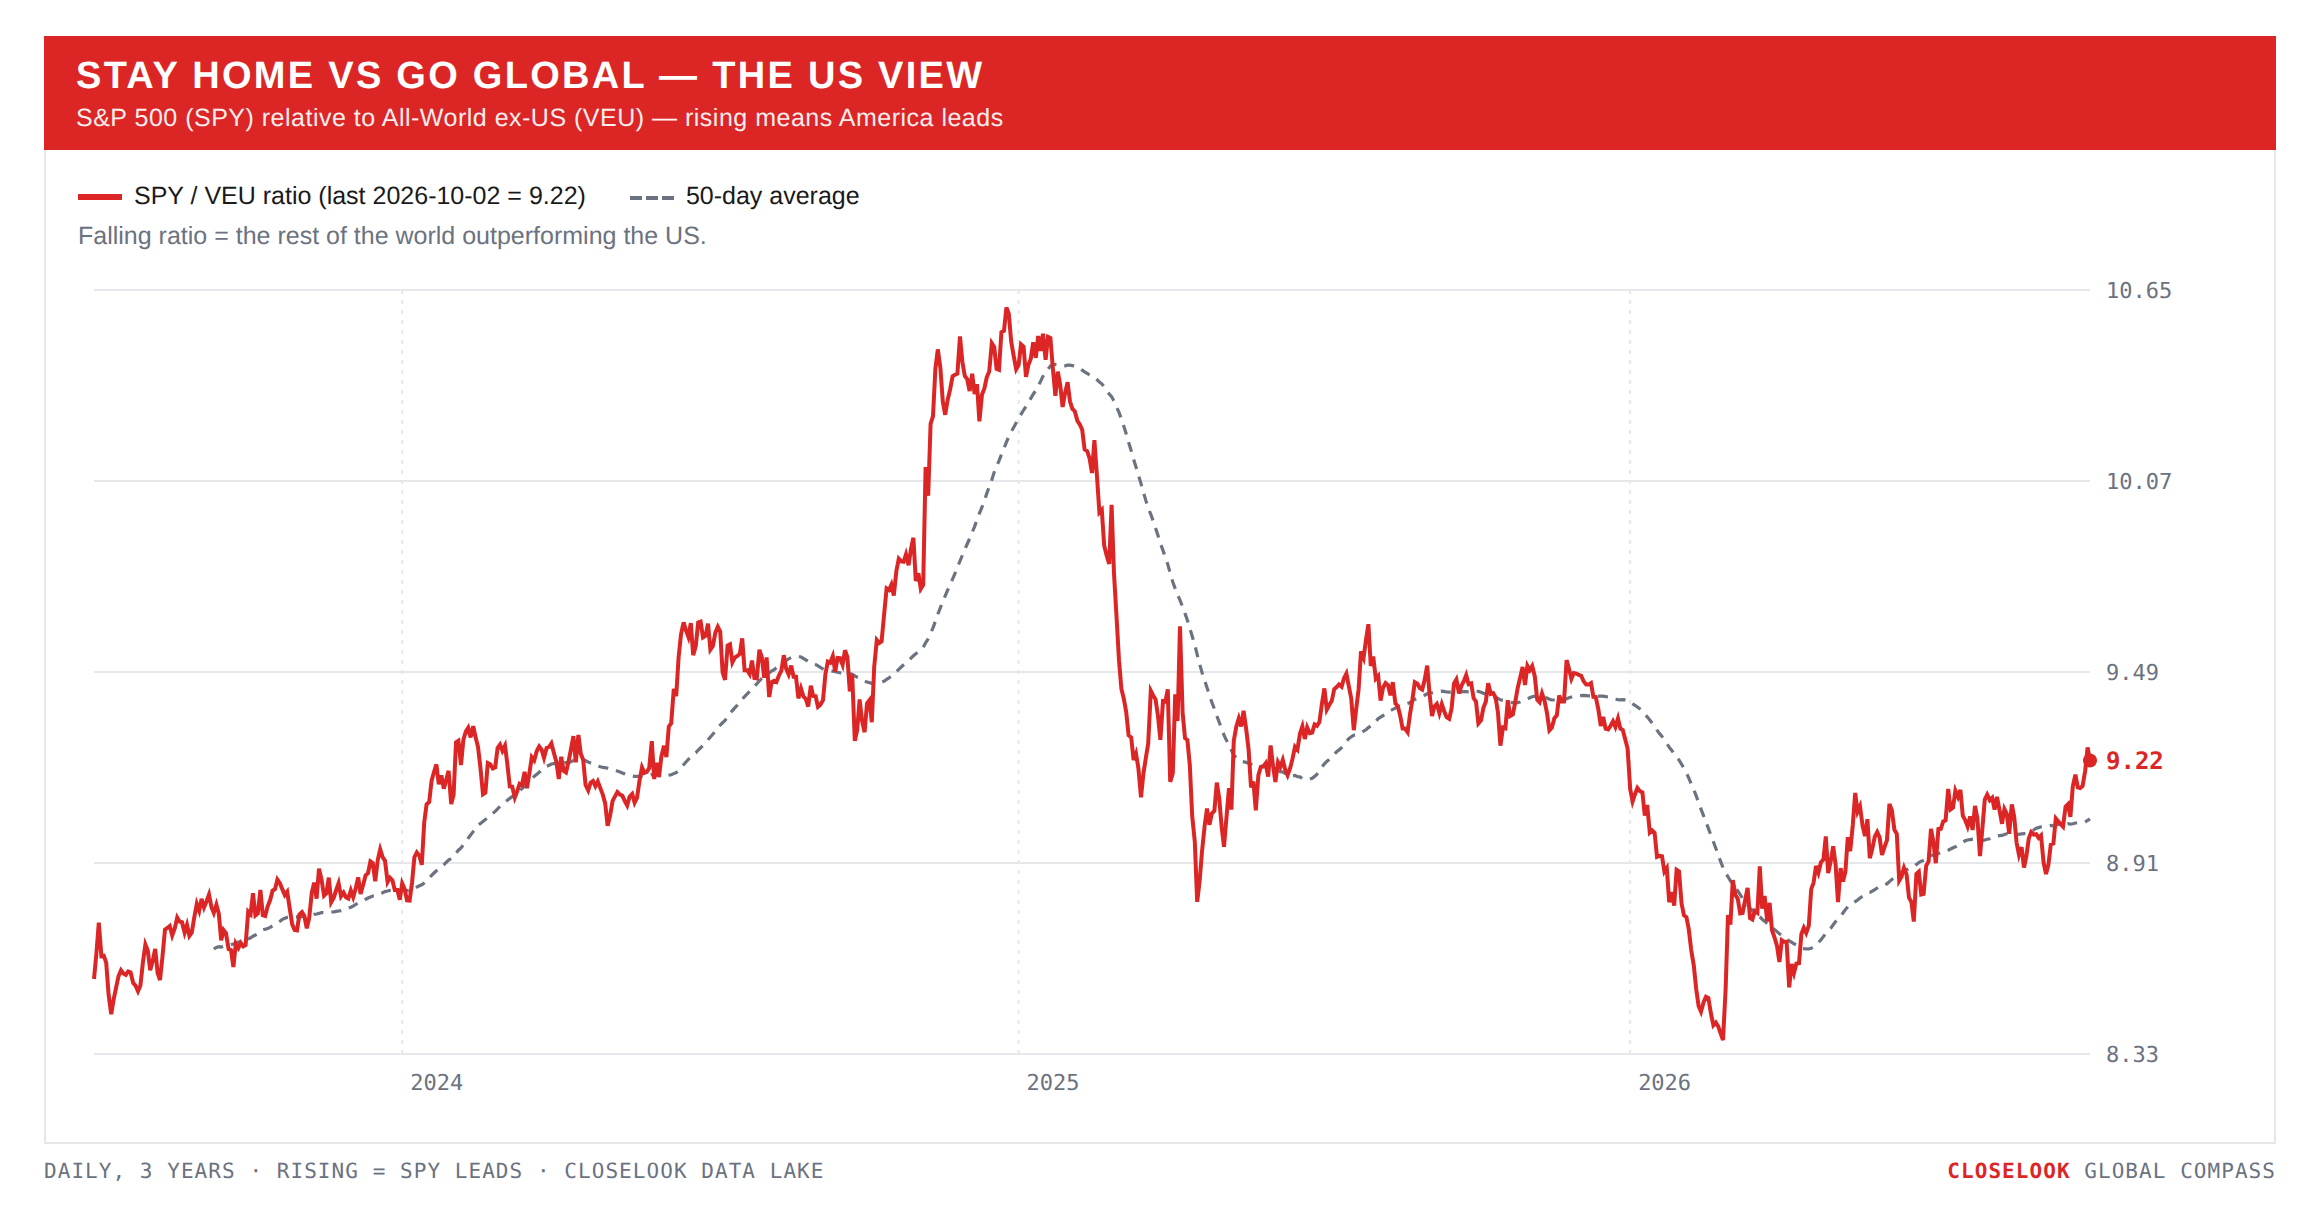
Stay home vs go global — the US view. America won a fourth week: SPY −0.22%, VT −0.56%, VEU −1.10%. The year still reads ex-US first, by a hair: +13.4% against +12.9% against +12.8%. In four weeks the lead has gone from 4.5 points to 0.6. On the current pace the year's order flips within a fortnight, and the line on the chart below says the same thing more quietly: the SPY/VEU ratio has turned up from its September low.
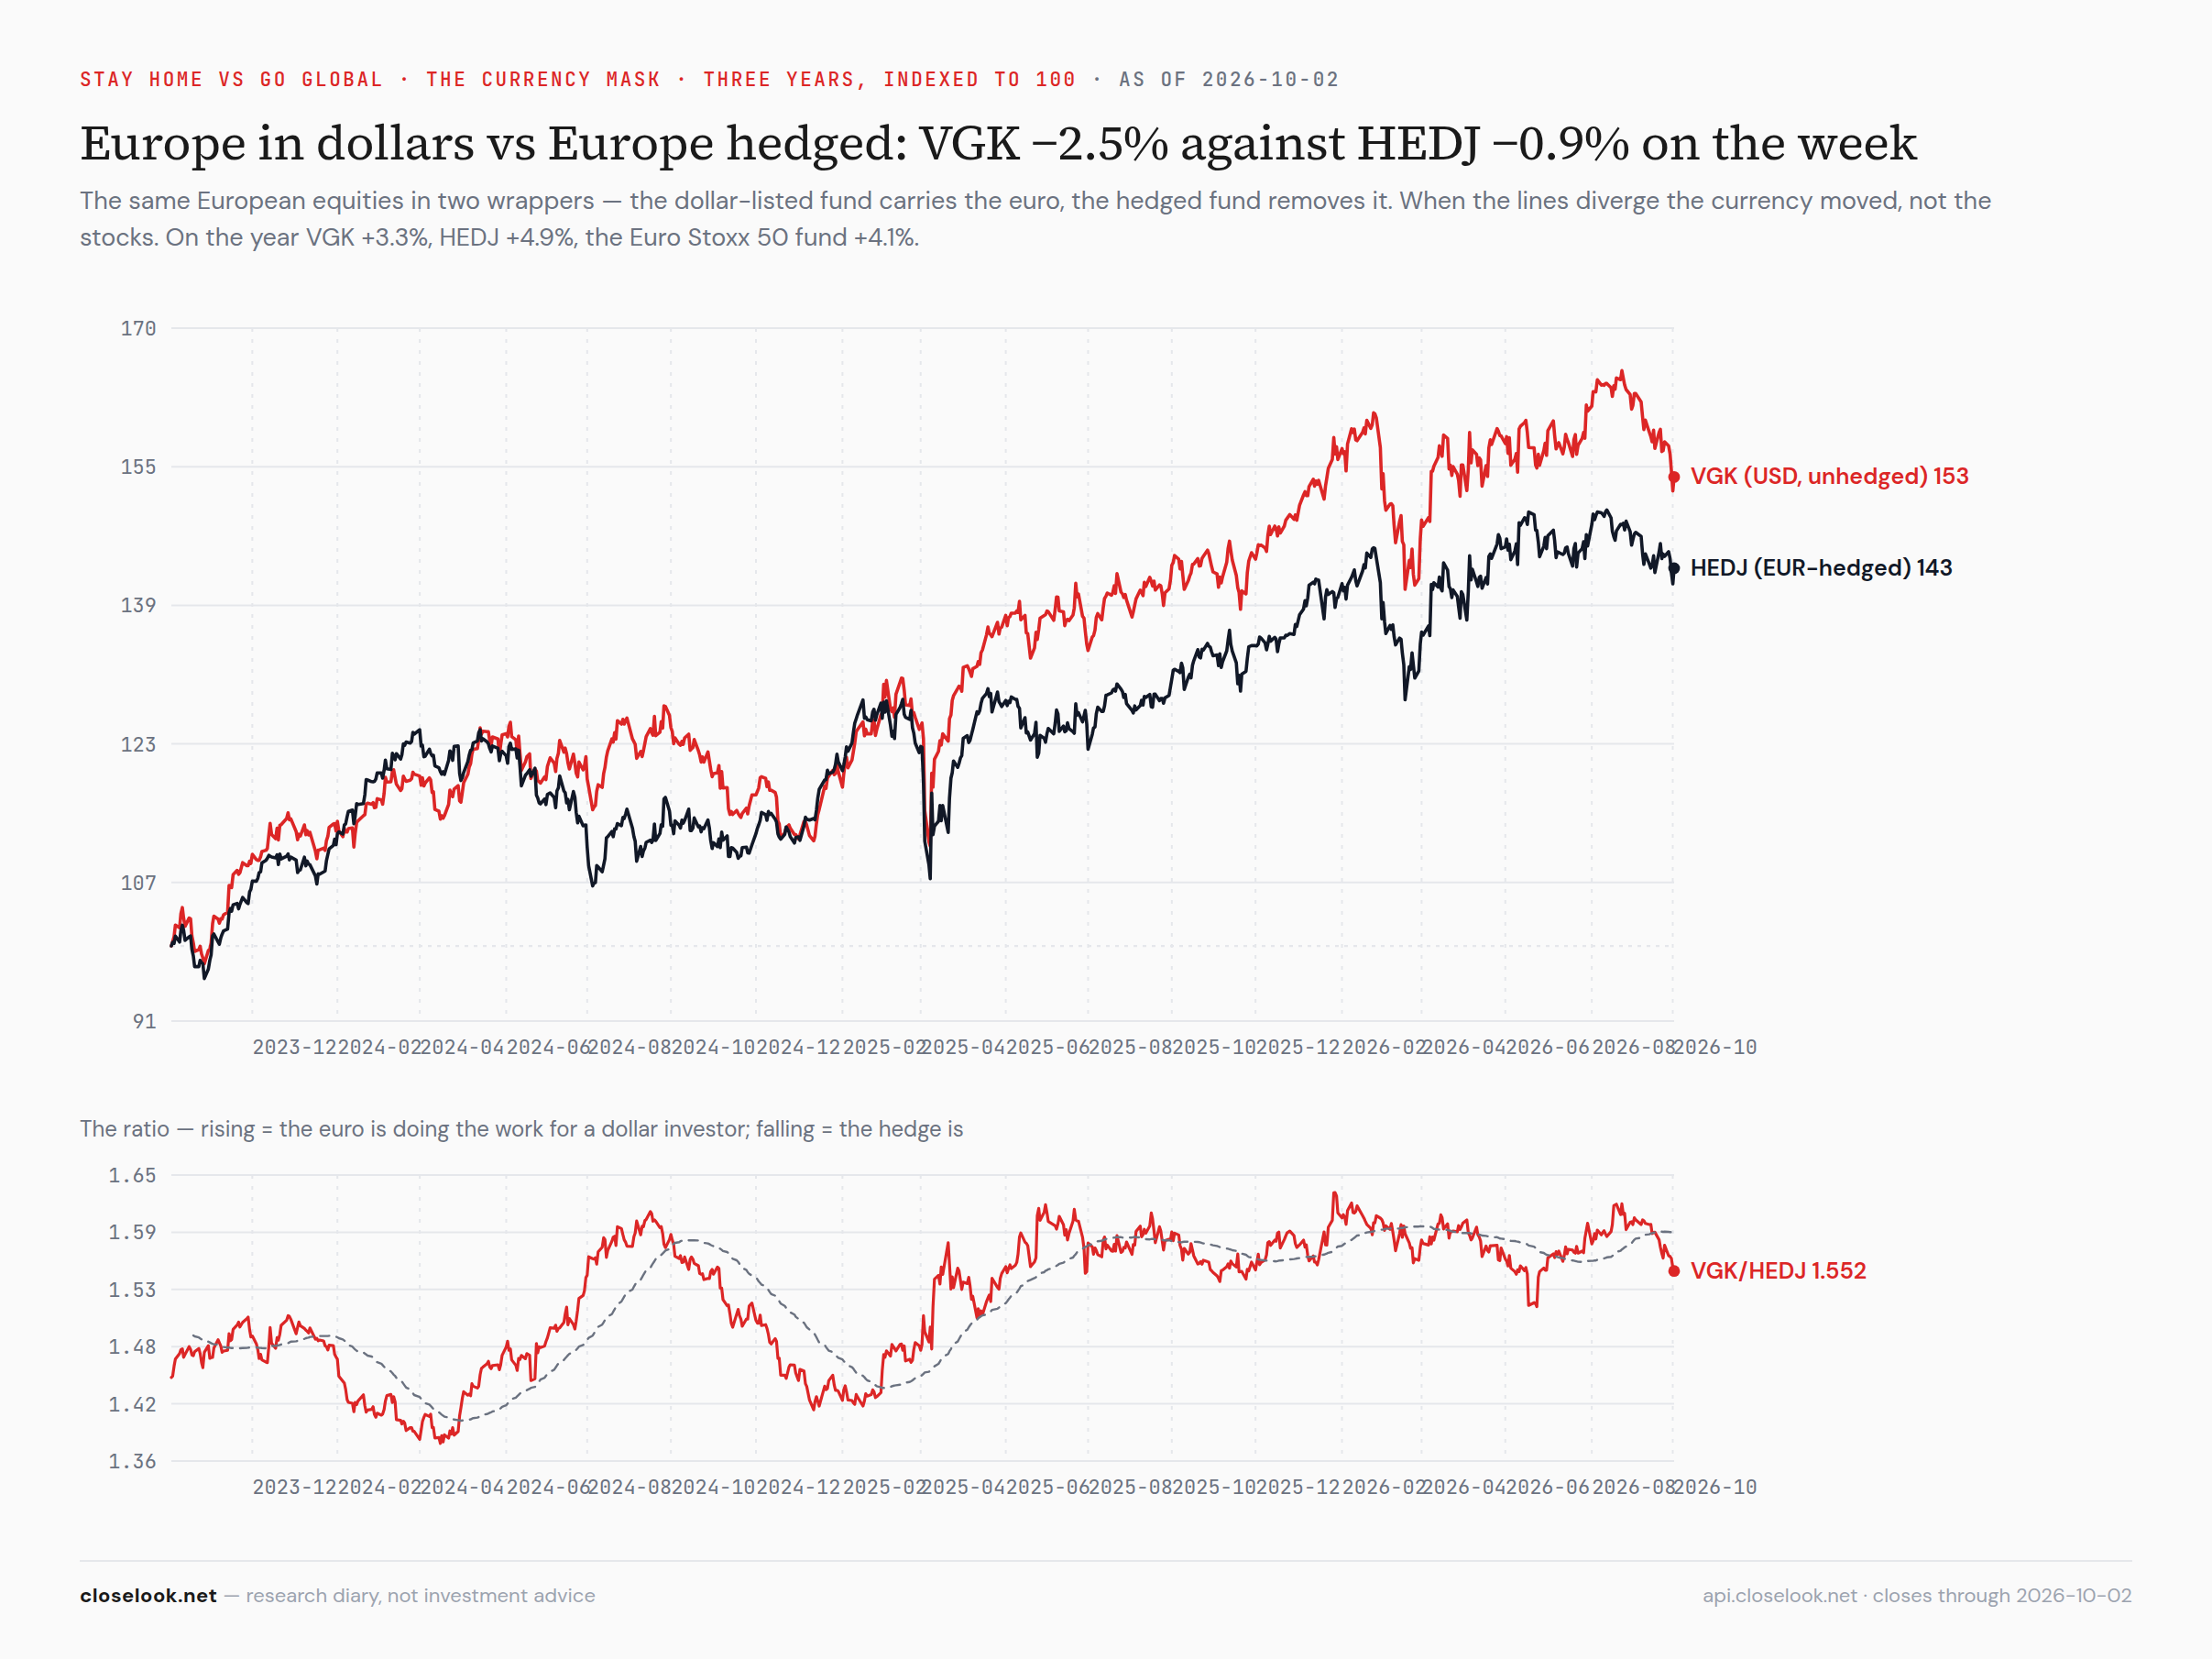
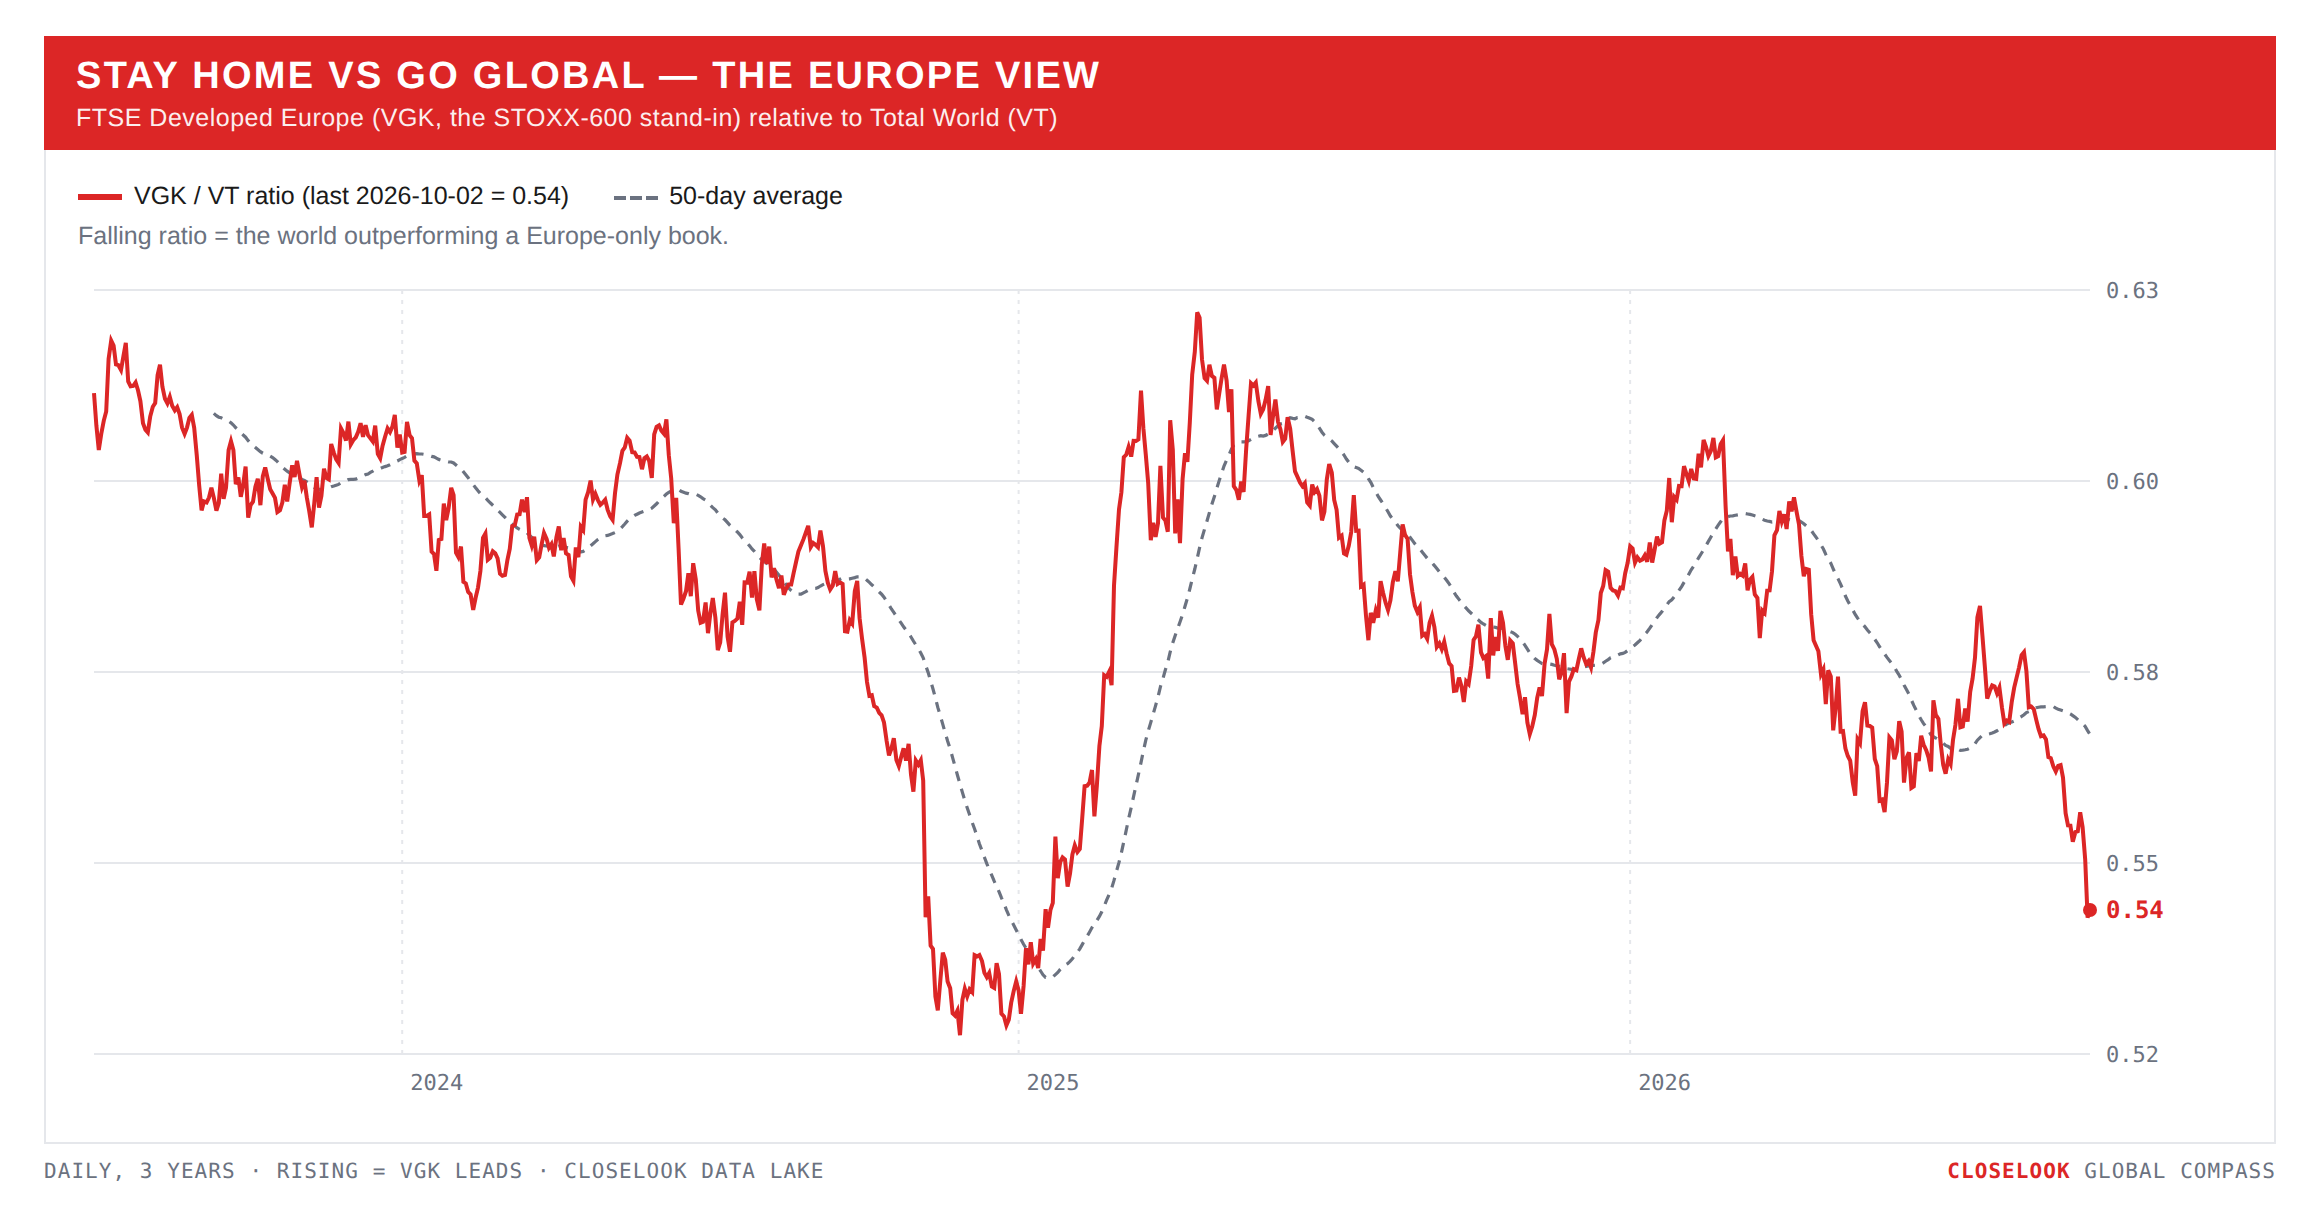
Stay home vs go global — the Europe view: the currency became the cost. The euro-hedged Europe fund fell 0.94%; the dollar-listed one fell 2.54% — 1.6 points of the loss were the euro. In local terms: the STOXX 600 −1.28%, the Euro Stoxx 50 −1.02%, the DAX −0.70% to 25,231, the CAC −1.96% to 7,920, Spain's IBEX −3.12%, the FTSE 100 −2.18%, Switzerland's SMI −1.90%. For seven weeks this letter has called the gap between the two funds a mask that flips. This week it did not flip. It cost.
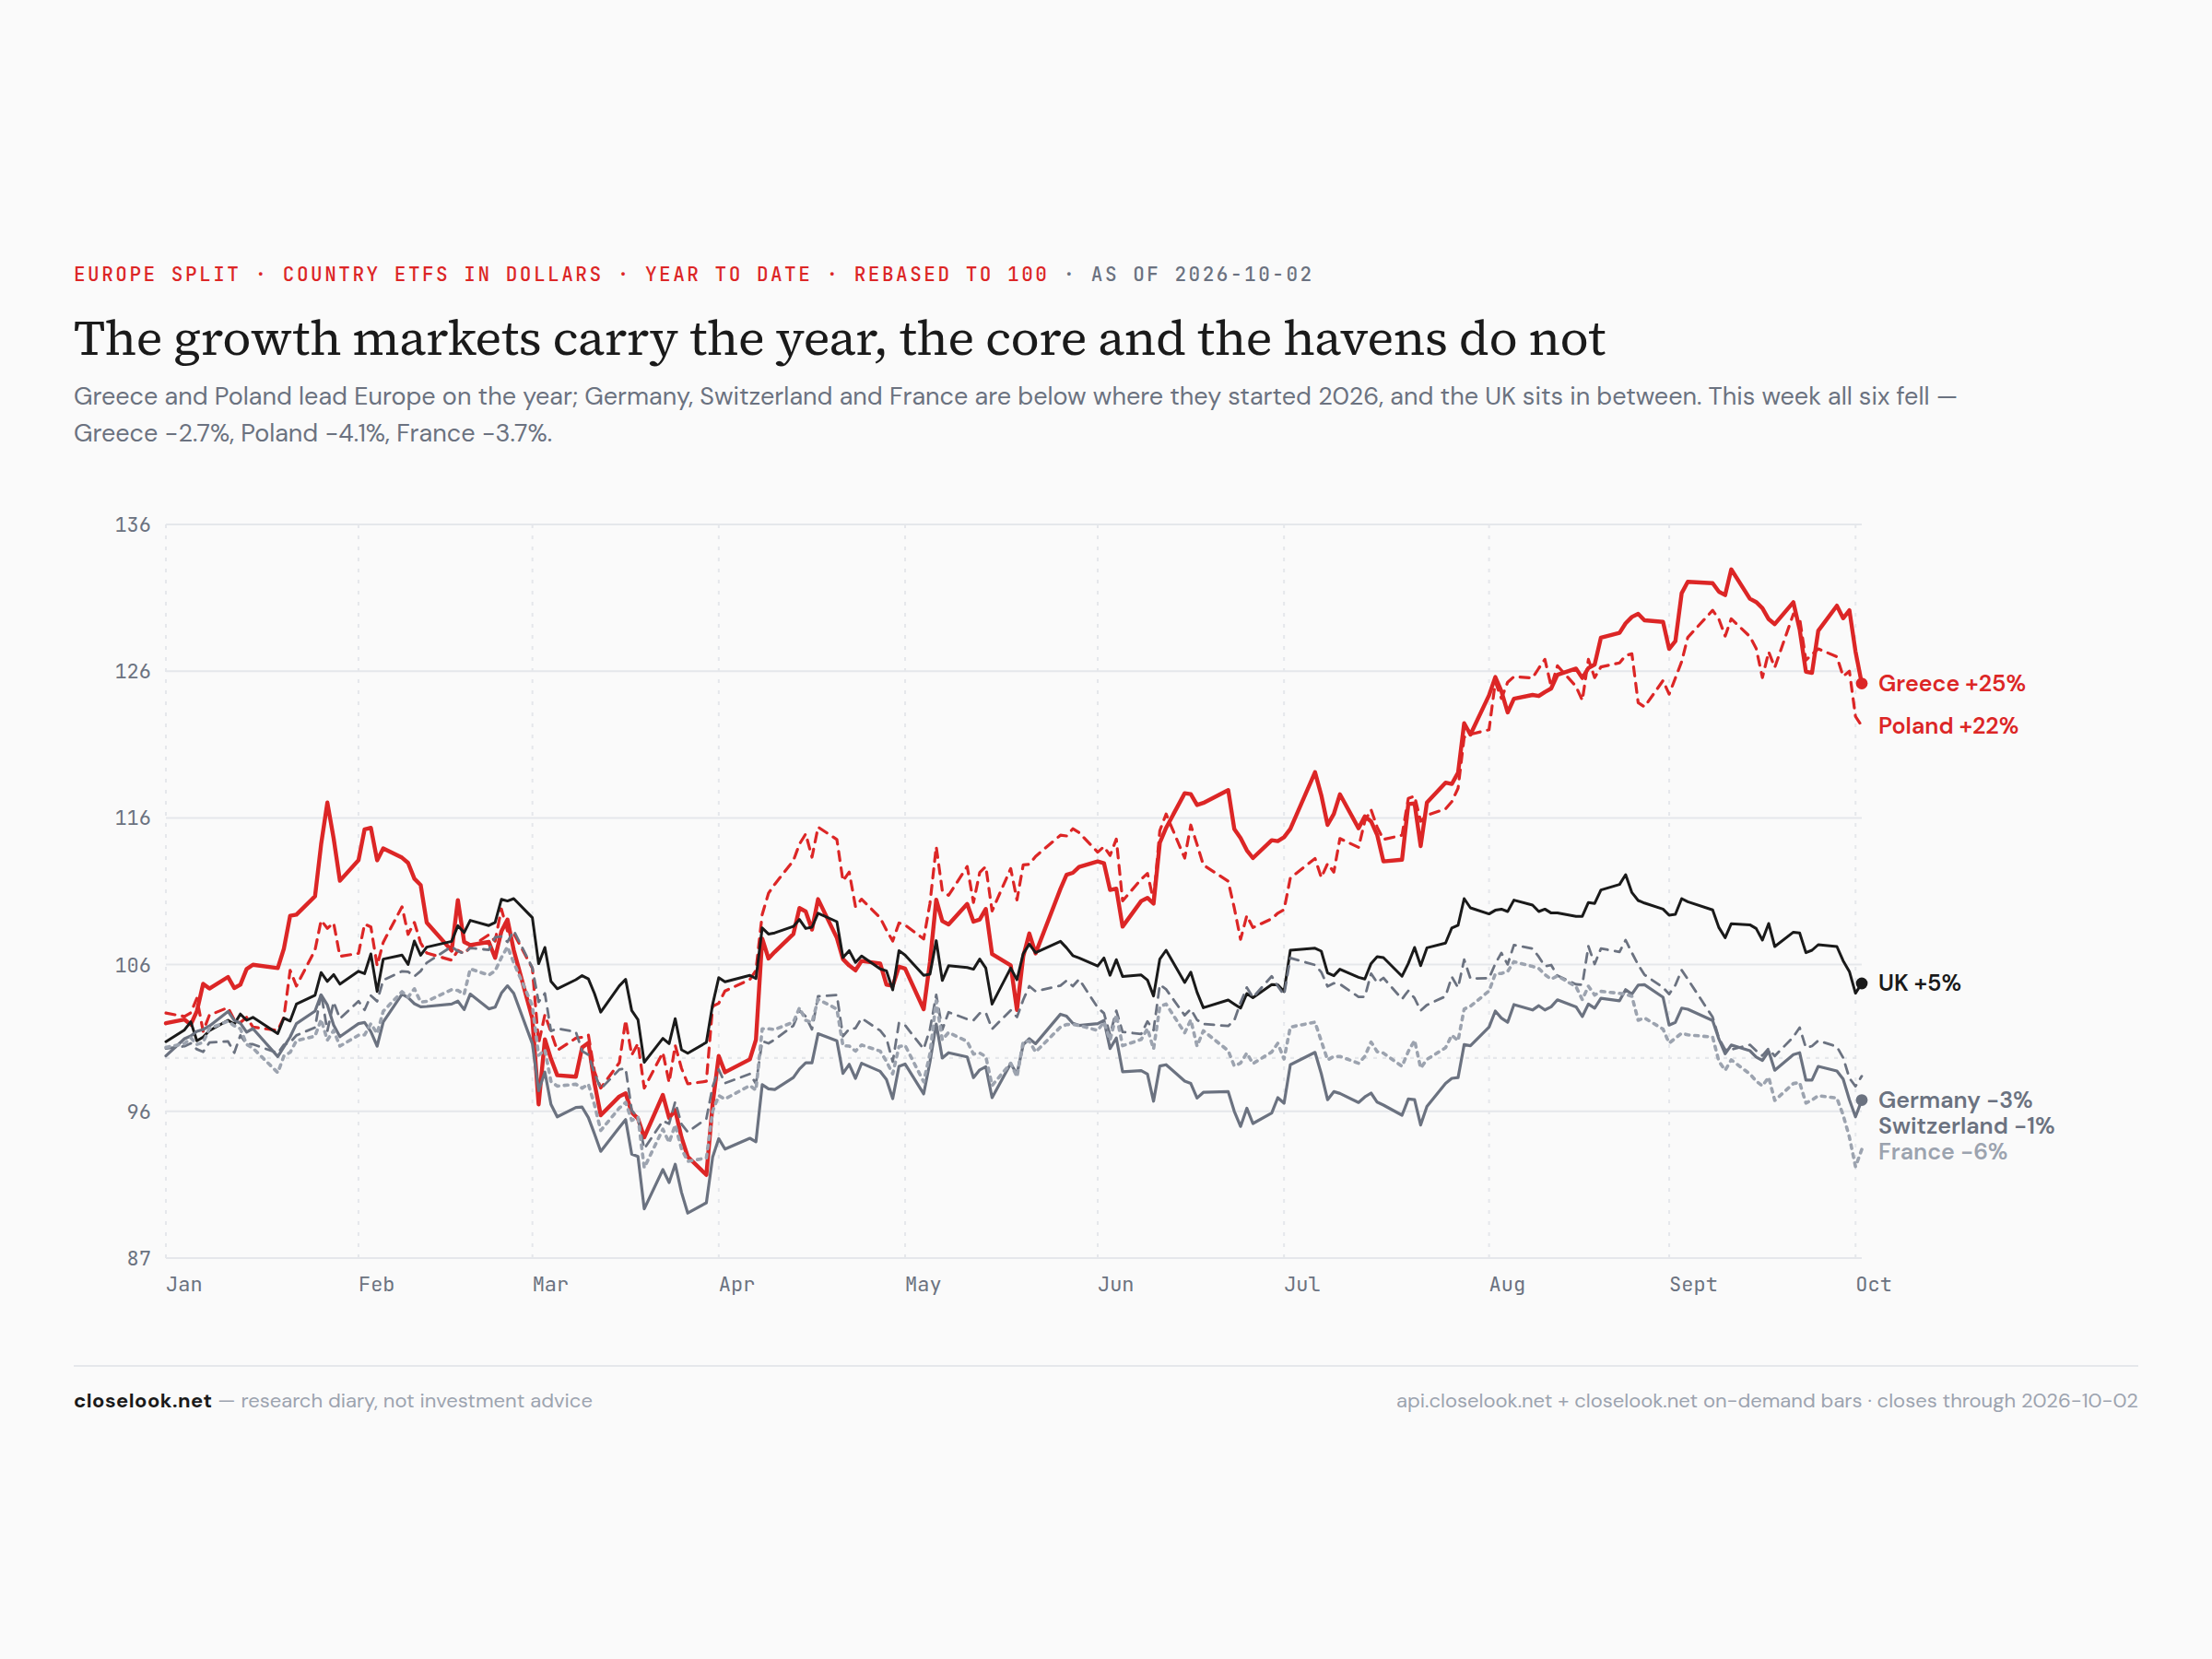
Europe split — the growth markets and everyone else. The year in Europe is not one market either. Greece +25% and Poland +22% in dollars; Britain +5%; the Netherlands +19% and Austria +18% on the ASML and chip-equipment leg; Switzerland −1%, Germany −3%, France −6%. The two markets with their own growth — Poland's economy, Greece's repaired finances, now cheaper to borrow for than France — carry the year. The core and the havens do not. This week was the exception: Greece fell 2.75% and Poland 4.06%, both more than the core. When money leaves a region, it leaves the best-performing corners too — they are where the gains are to take. The thesis is a year's thesis; the week tested it.
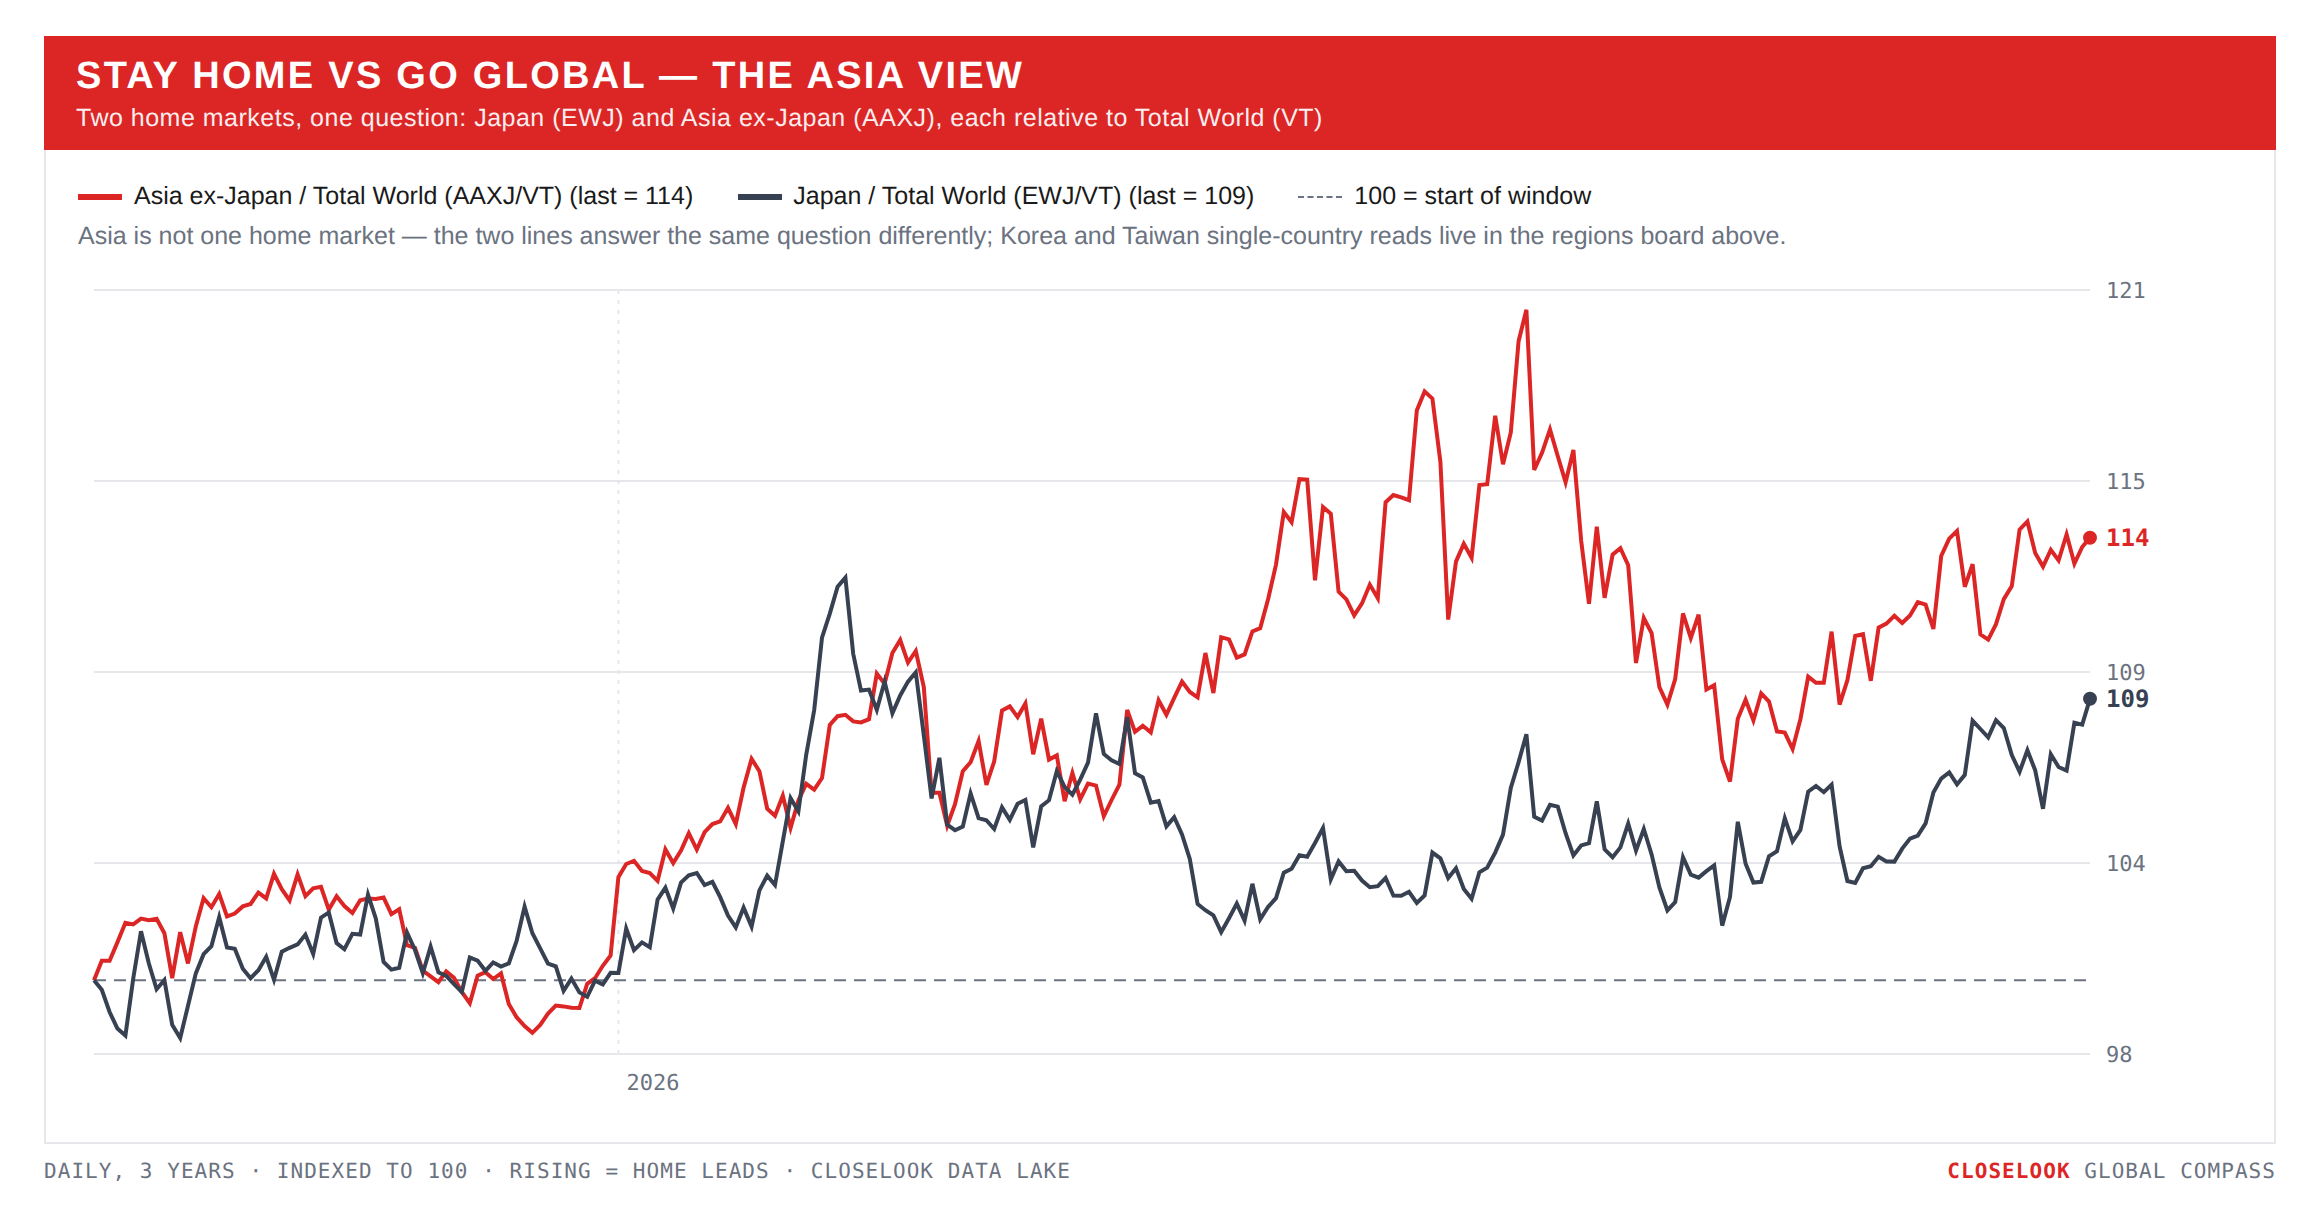
Stay home vs go global — the Asia view: the AI markets ahead, the rest behind. Taiwan: EWT +1.35% to a record close, the Taiex +0.94% to a record 48,476. Korea: EWY +2.51% to 191.88; the Kospi closed Monday 2.7% lower as it reopened after the Chuseok holiday — owed two strong New York sessions it had missed — and the tech-heavy Kosdaq rose 5.8% on the week. Japan split down the middle: the Nikkei, heavy in chip-equipment names, +2.93% to 68,309 on Micron's record quarter (+3.3% on Thursday alone), while the broad TOPIX fell 0.91%. That is "parts of Japan" in two numbers: the AI part up three percent, the rest of Japan down one. India: −2.80%, the Nifty −2.78%, the Sensex at 71,910 on Thursday, its lowest close in a year. Hong Kong −2.19% before its holiday. The yen closed at 157.83.
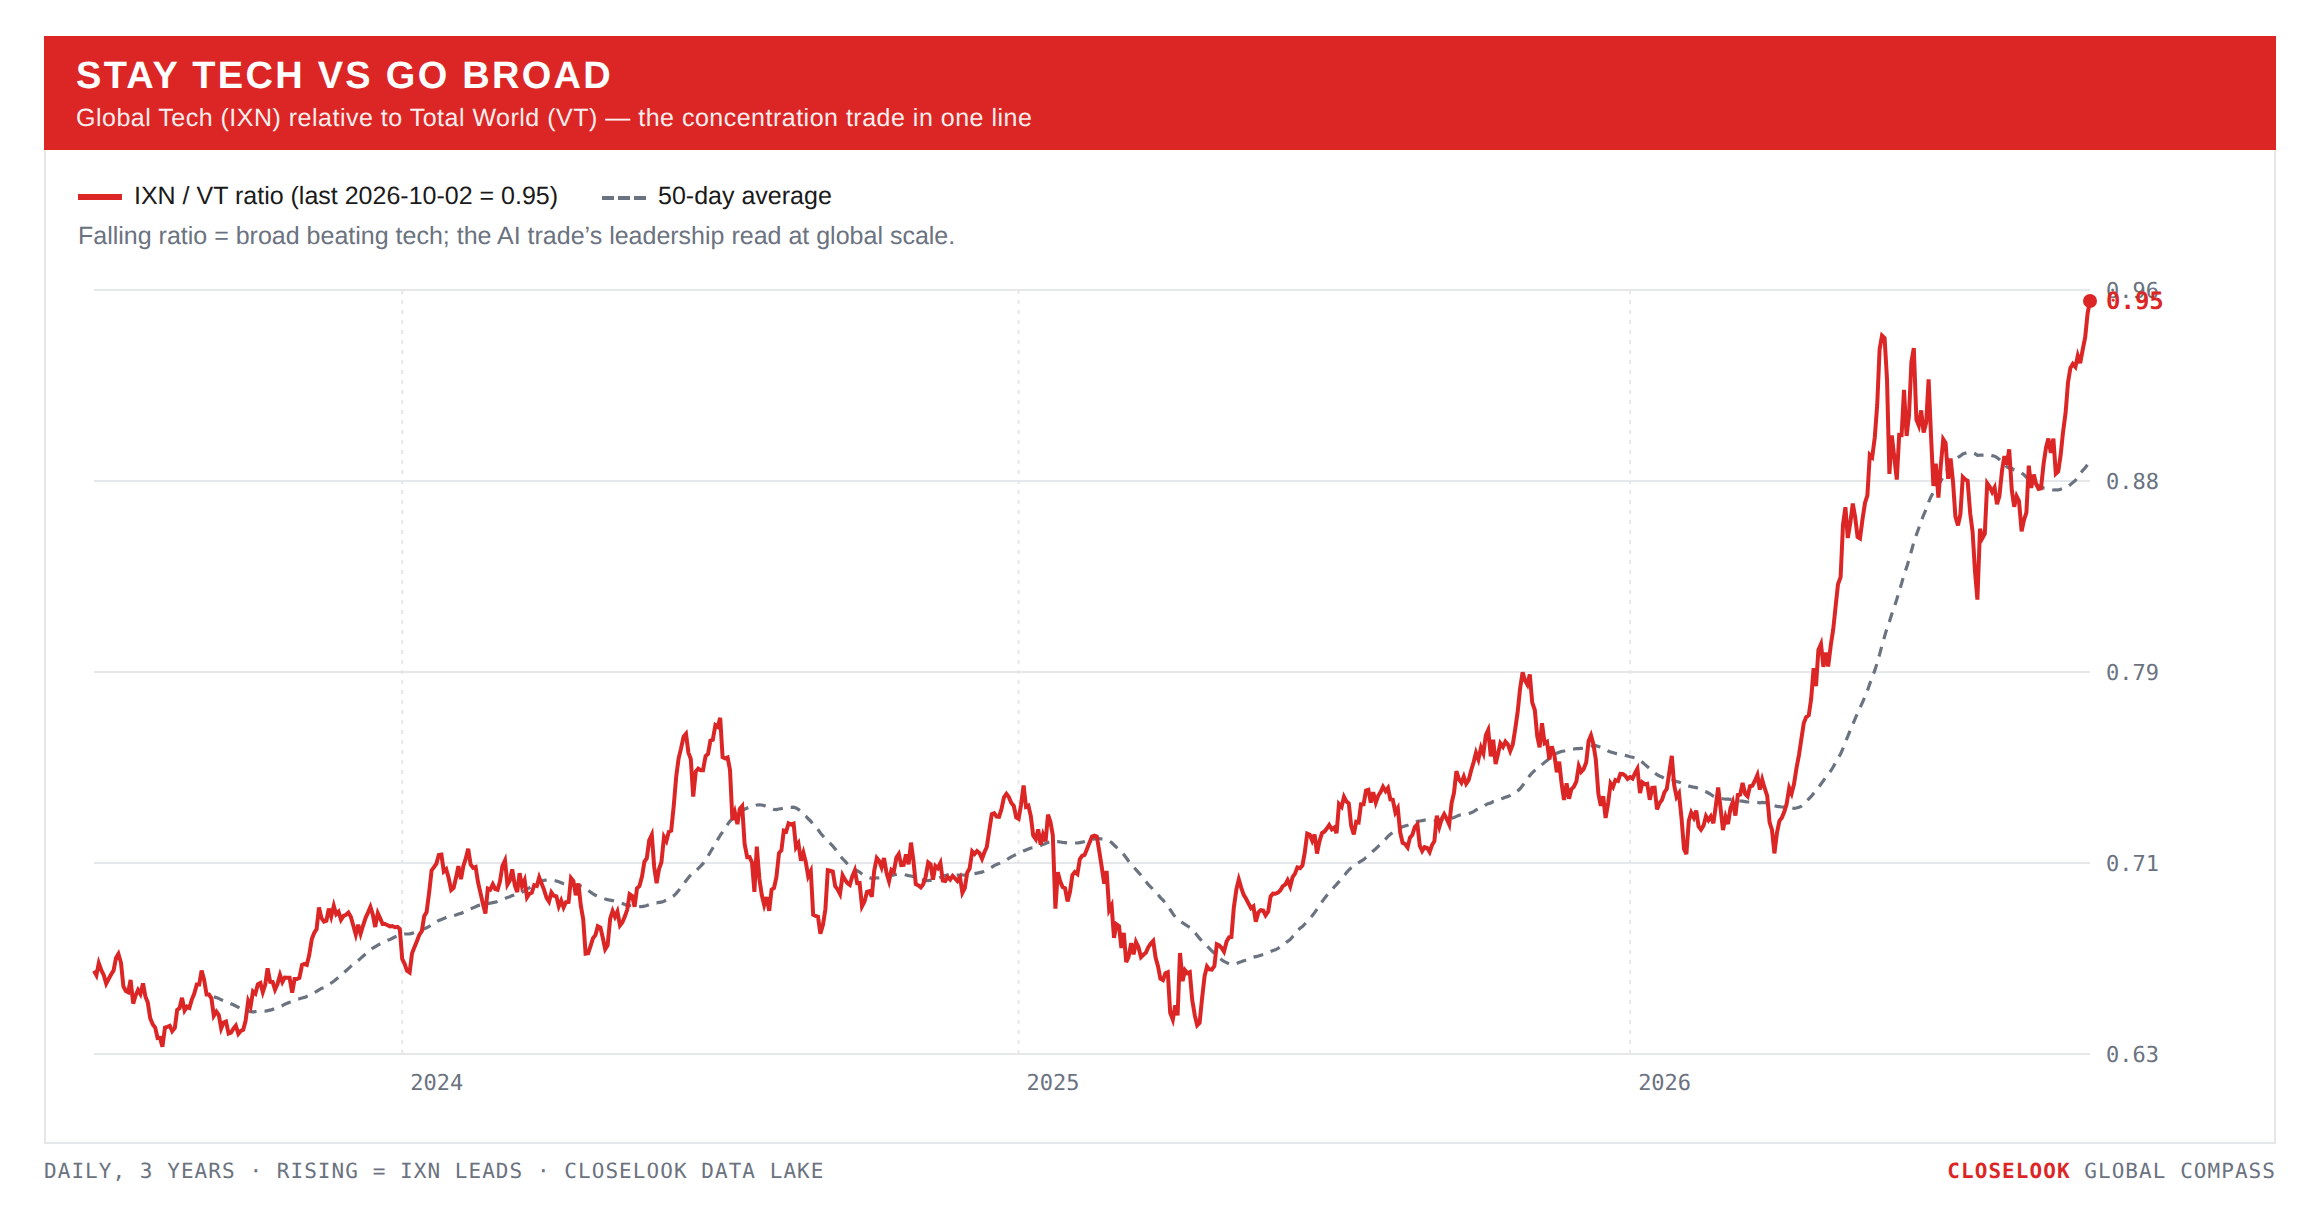
Stay tech vs go broad. Tech led again, at home and abroad. The Nasdaq 100 +1.01% against the S&P's −0.27% and the equal-weight S&P's −0.65%; global tech +2.00% against the world's −0.56%. Technology was the best US sector and the best global sector for a second week, and this week both made records. The ratio of global tech to the world index is at its high of the year.
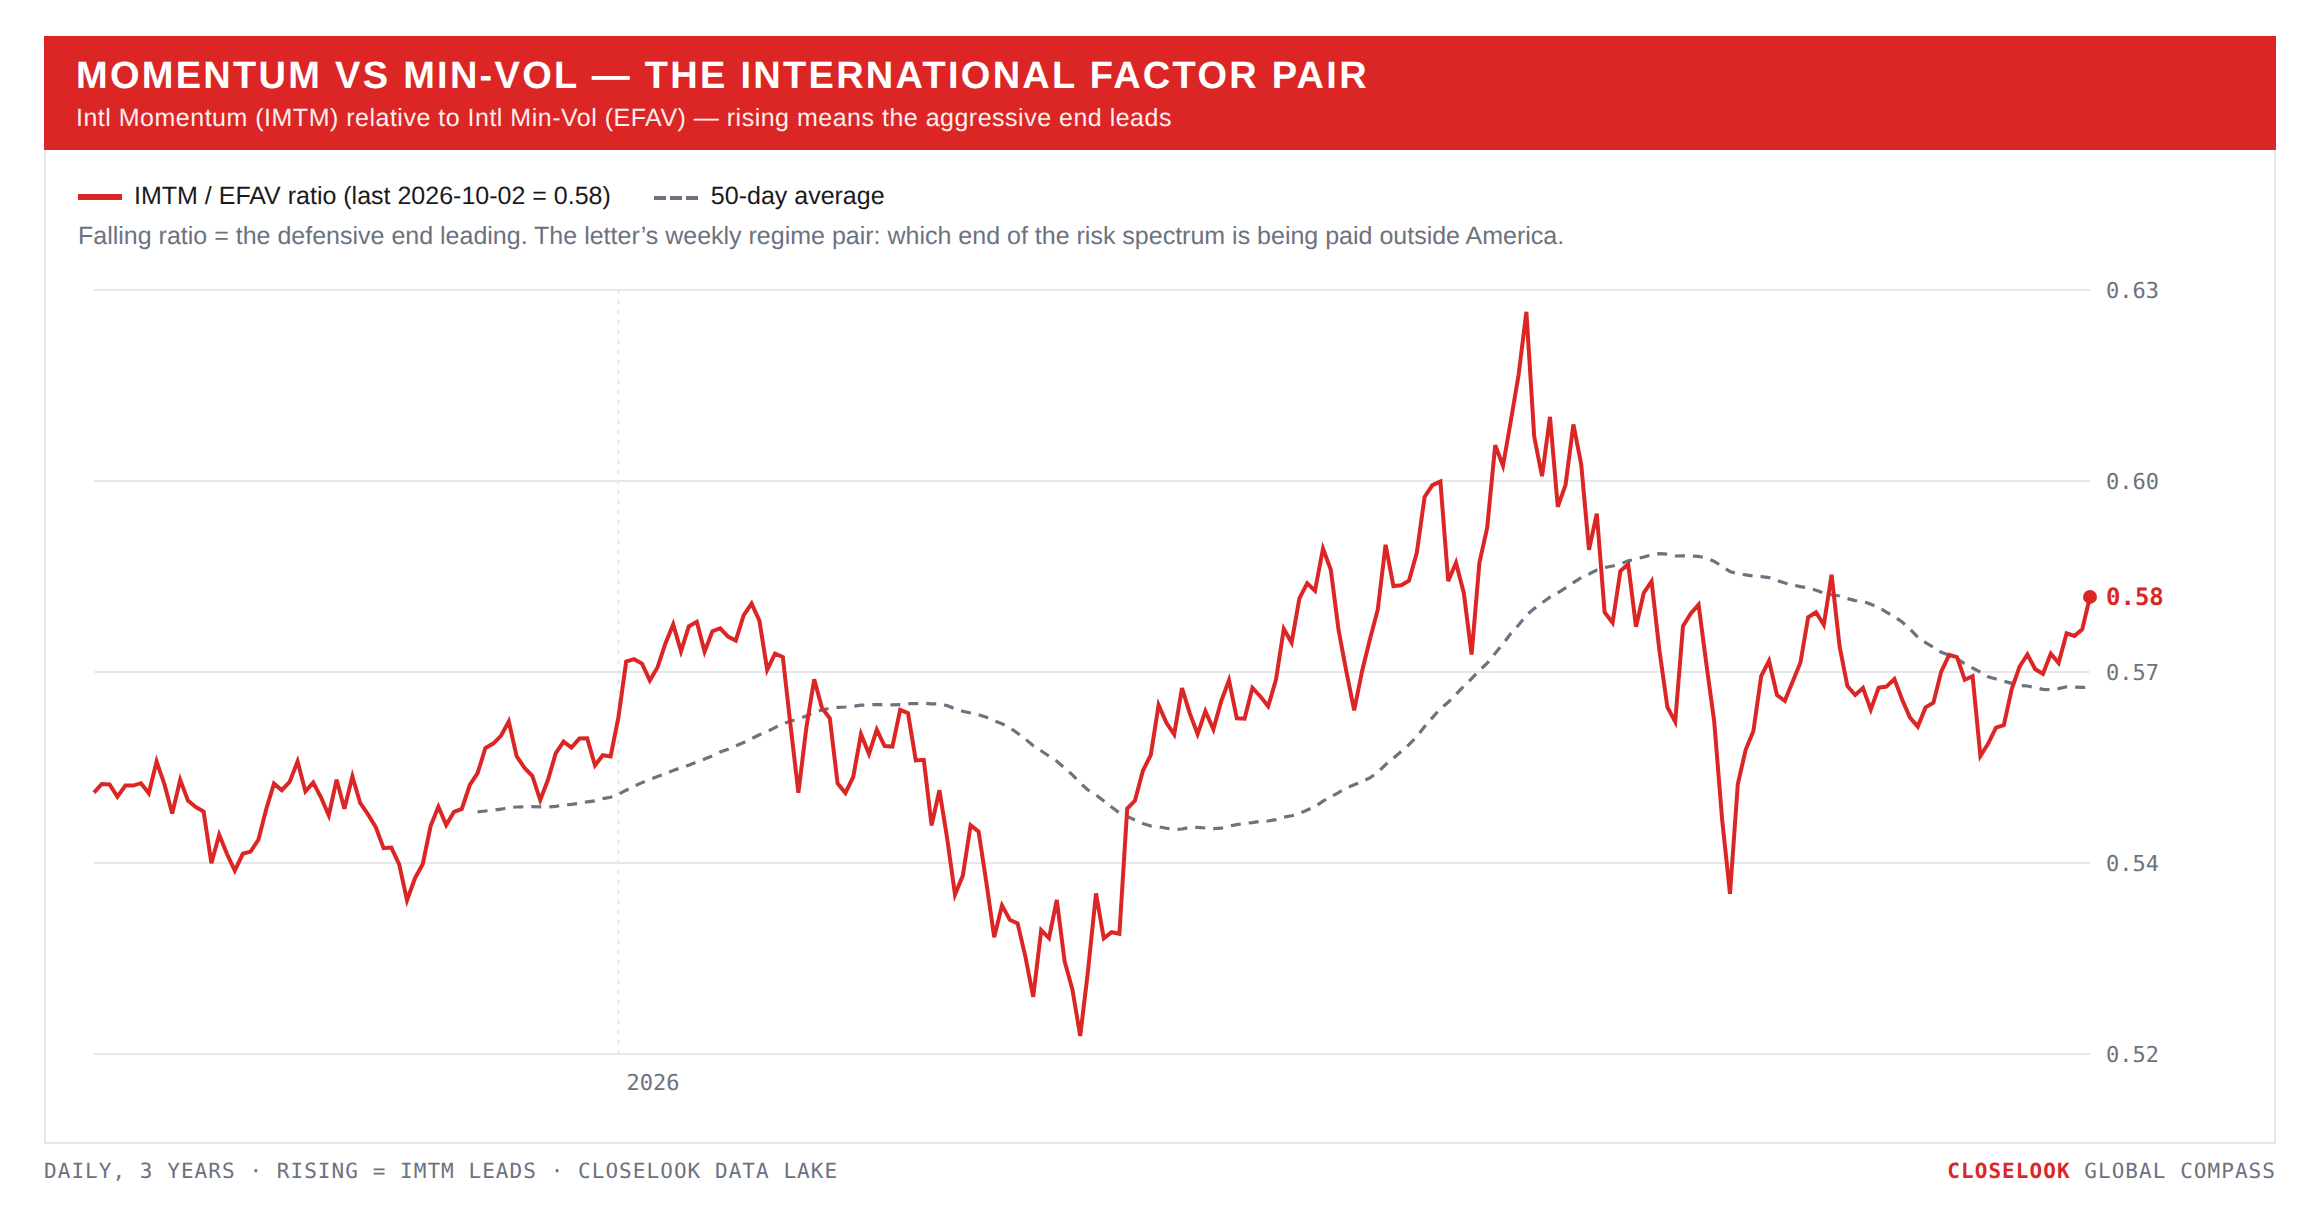
Momentum vs defensive — both down, min-vol more. International momentum fell 0.64% to 53.05; international min-vol 2.02% to 90.96; global min-vol −0.64%. On the year momentum leads +10.6% against +5.5%. The low-volatility funds are full of the utilities, staples and banks that sold off with the long end; that is why the defensive factor was not defensive this week.
One more pair: growth over value, a third week. EAFE growth +0.08% against value −2.94%. On the year value still leads, +9.9% against +6.3%, but the gap has closed from 7.1 points a week ago to 3.6. Value outside America is European banks, energy and materials; this week all three fell.
The Closelook letters — where this one sits. The house thesis, compressed: the stock market is a growing system at the aggregate level in which most constituents slowly fade while a small group massively outperforms — and that group changes dynamically; it never stays static. Own the aggregate, know the current winner group, watch for the rotation. Right now the winner group is the AI stack, and this week the map showed where it lives: in America's technology and Asia's chip corridor, not in Europe's core or in India. This letter reads the map (regions, currencies, rates); Sunday's US letter reads the tape and its levels; Sunday evening's Hypergrowth letter reads the names.