Weekly Chart Pick · 2026-11-06
Travel — the platform that owns the stay presses its four-year ceiling while the booking sites slide
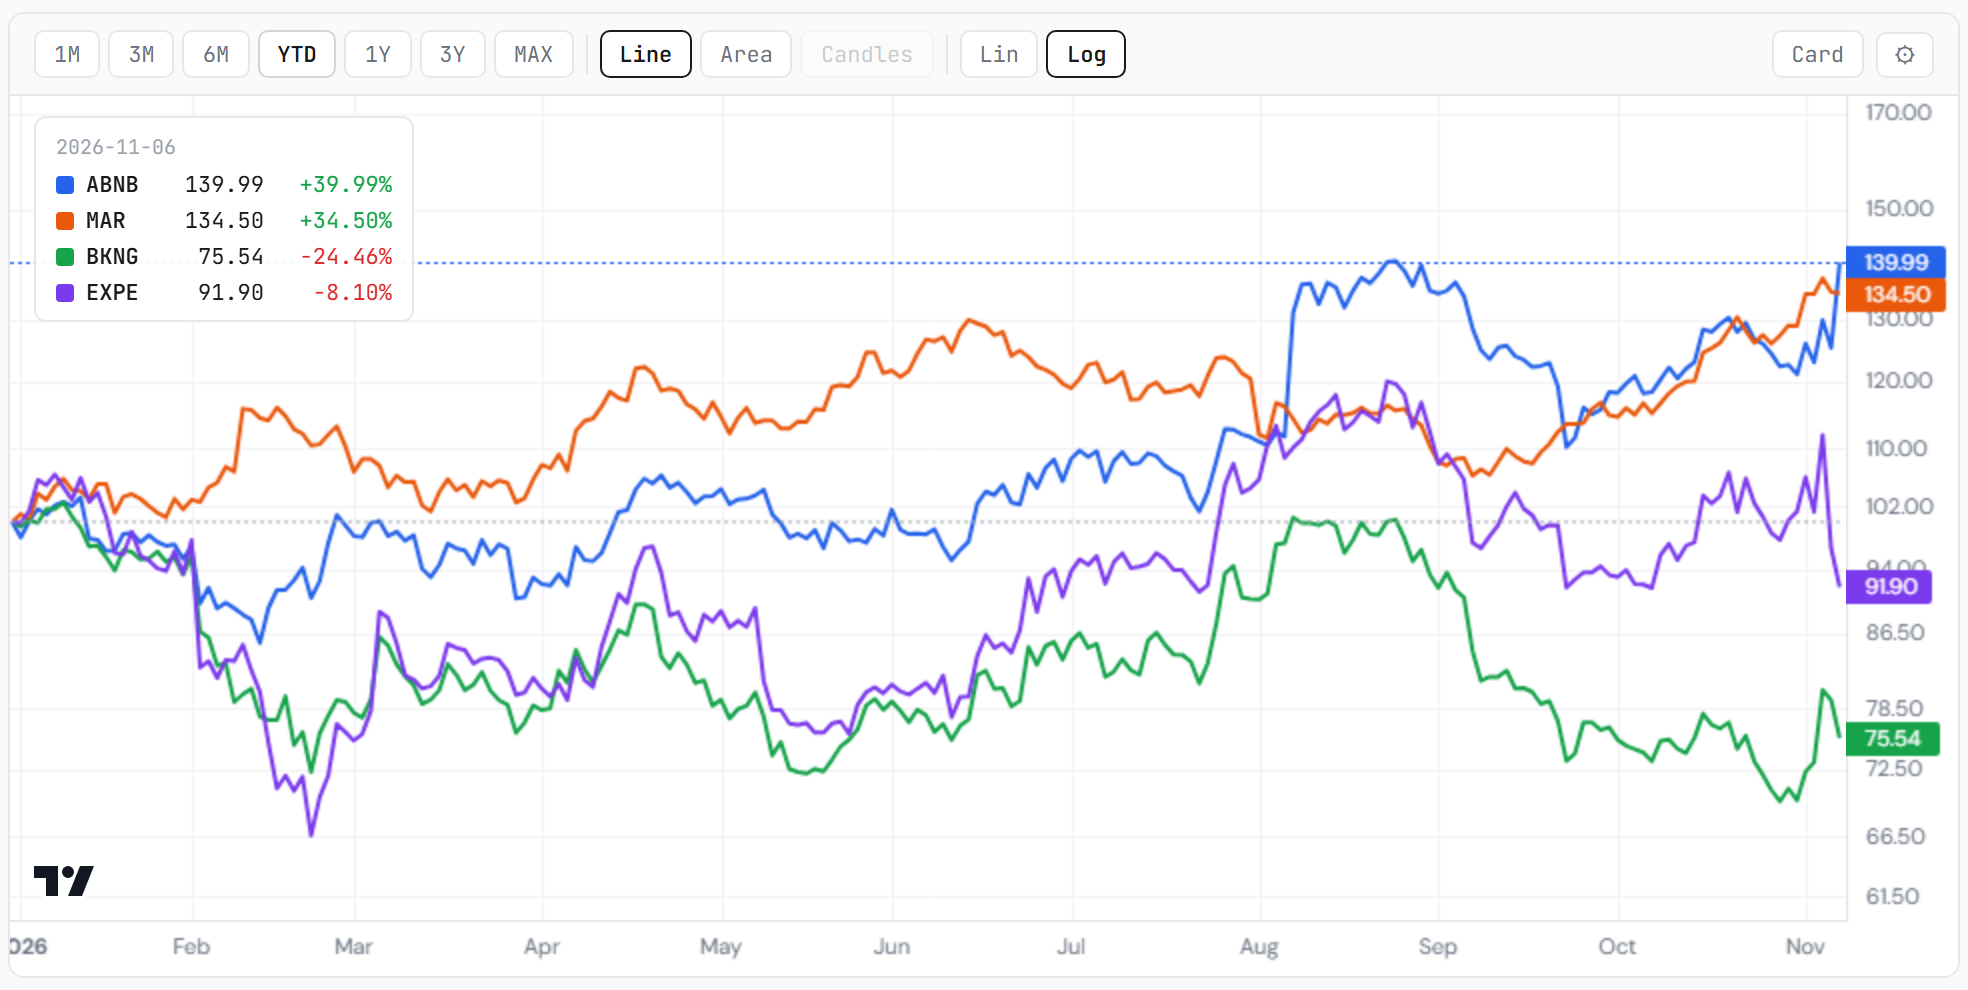
A travel company beat its estimates on Thursday, rose 11.7% on Friday and closed 51 cents under its August high — the level that has capped it since early 2022. In the same week the companies that sell travel search fell. One sector, two directions, and this one sits in our index of companies that use AI rather than build it.
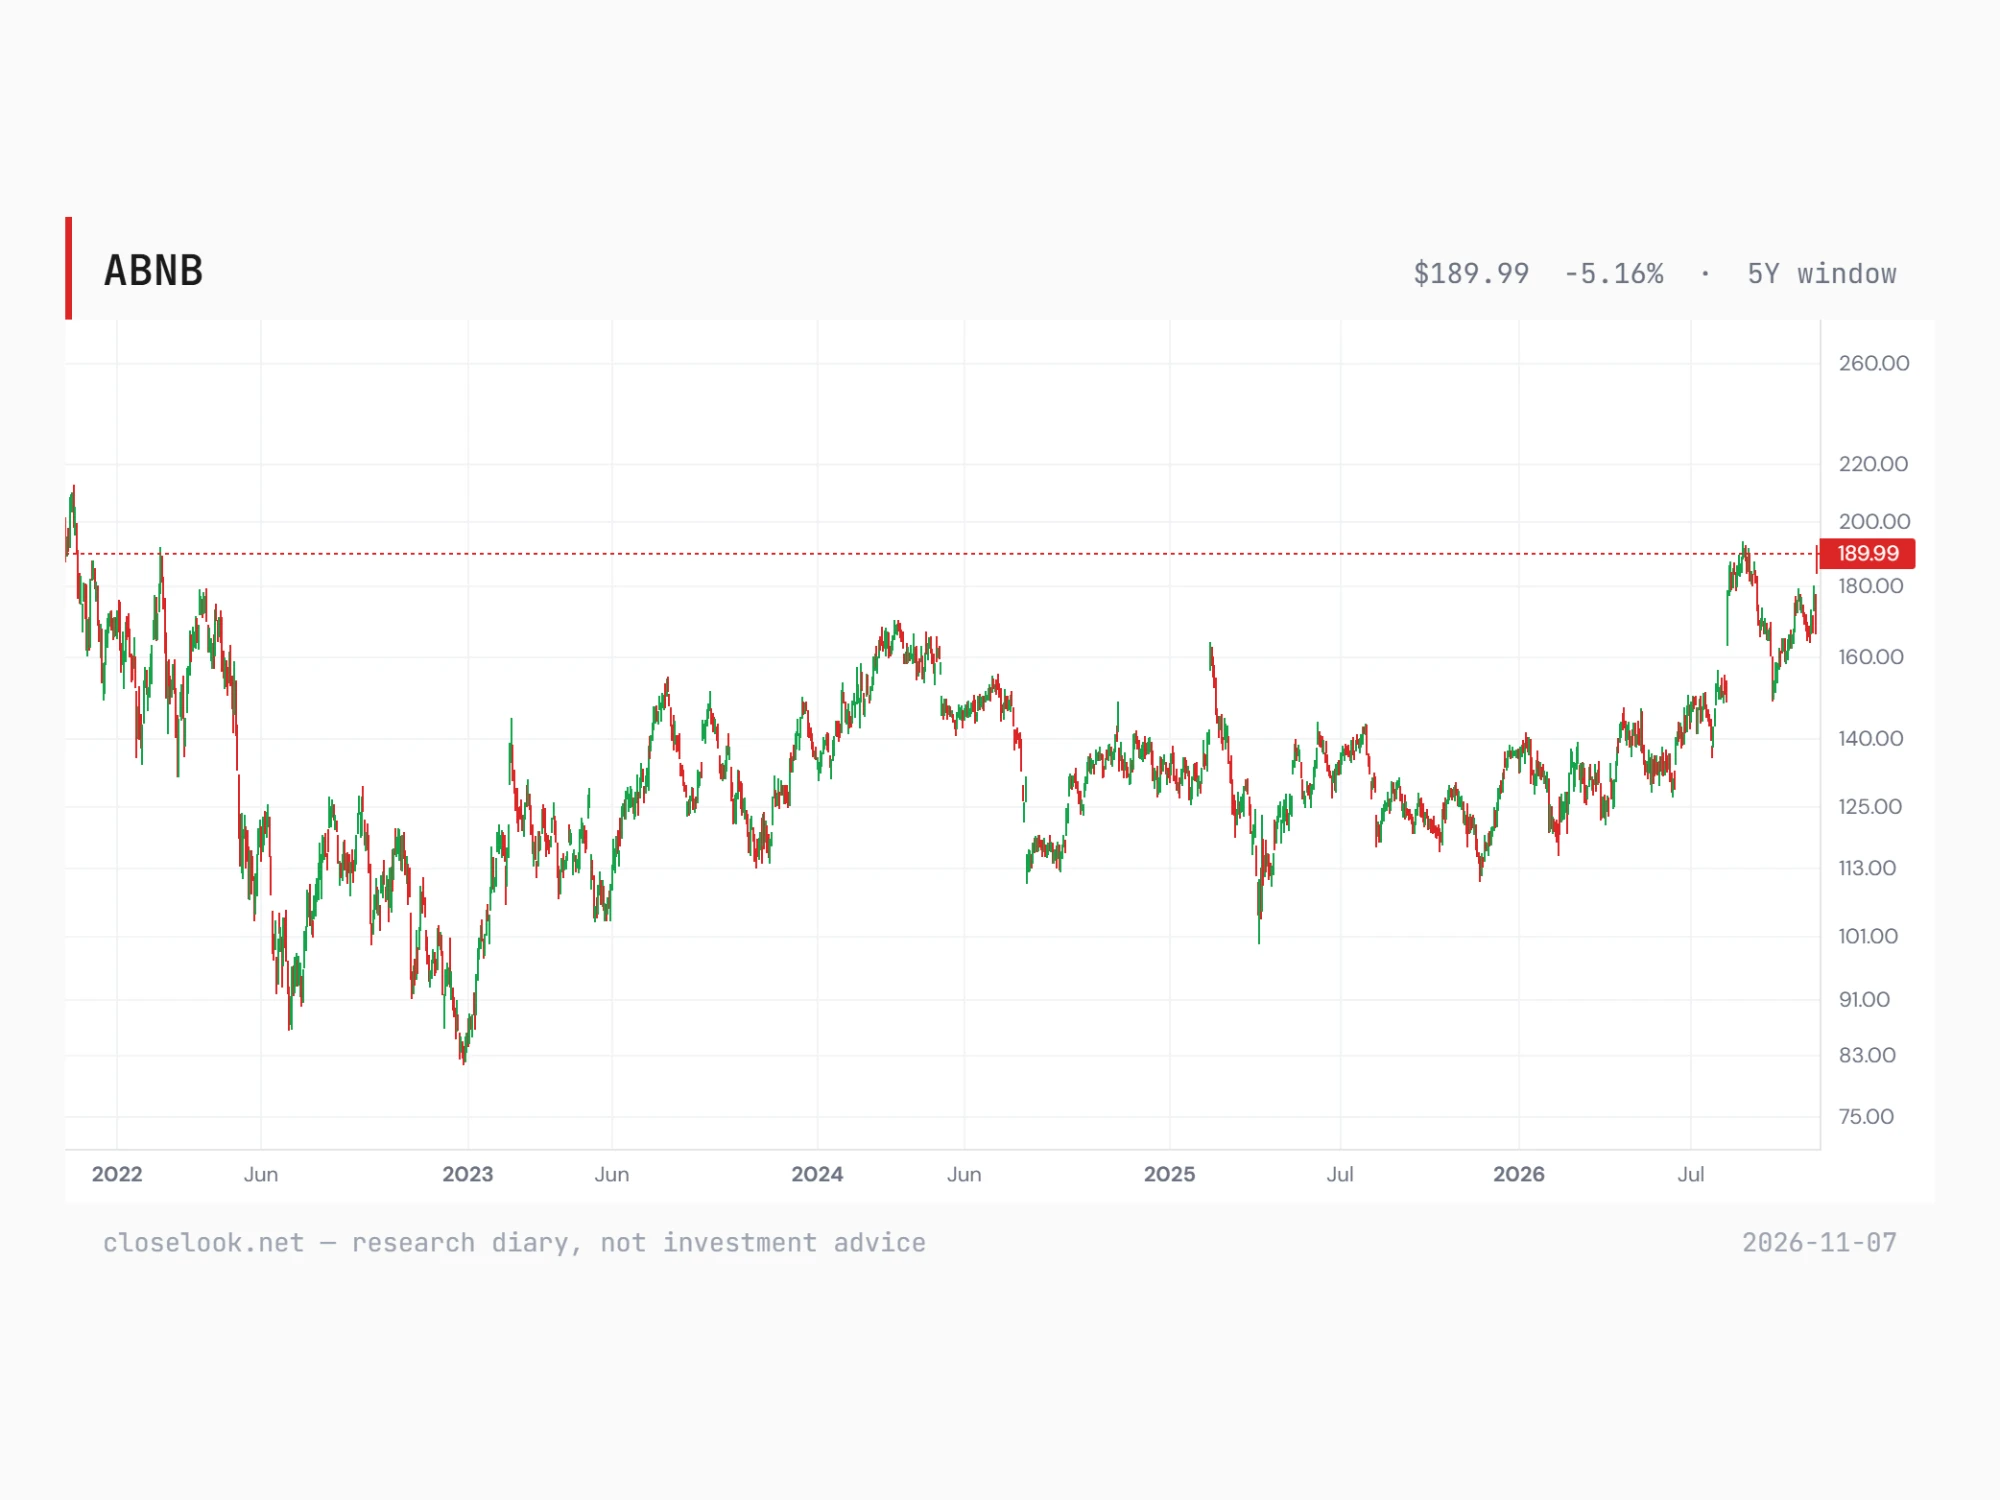
- Four-year ceiling under test: the stock closed at $189.99 on 6 November, 0.3% under its 25 August high of $190.50 — the zone that has capped it since early 2022 on the editor's five-year chart.
- The report did it: on Thursday after the close earnings came in at $3.16 a share against $2.85 expected and revenue at $4.87 billion against $4.75 billion; the stock rose 11.0% after hours and 11.7% on Friday, +15.6% on the week.
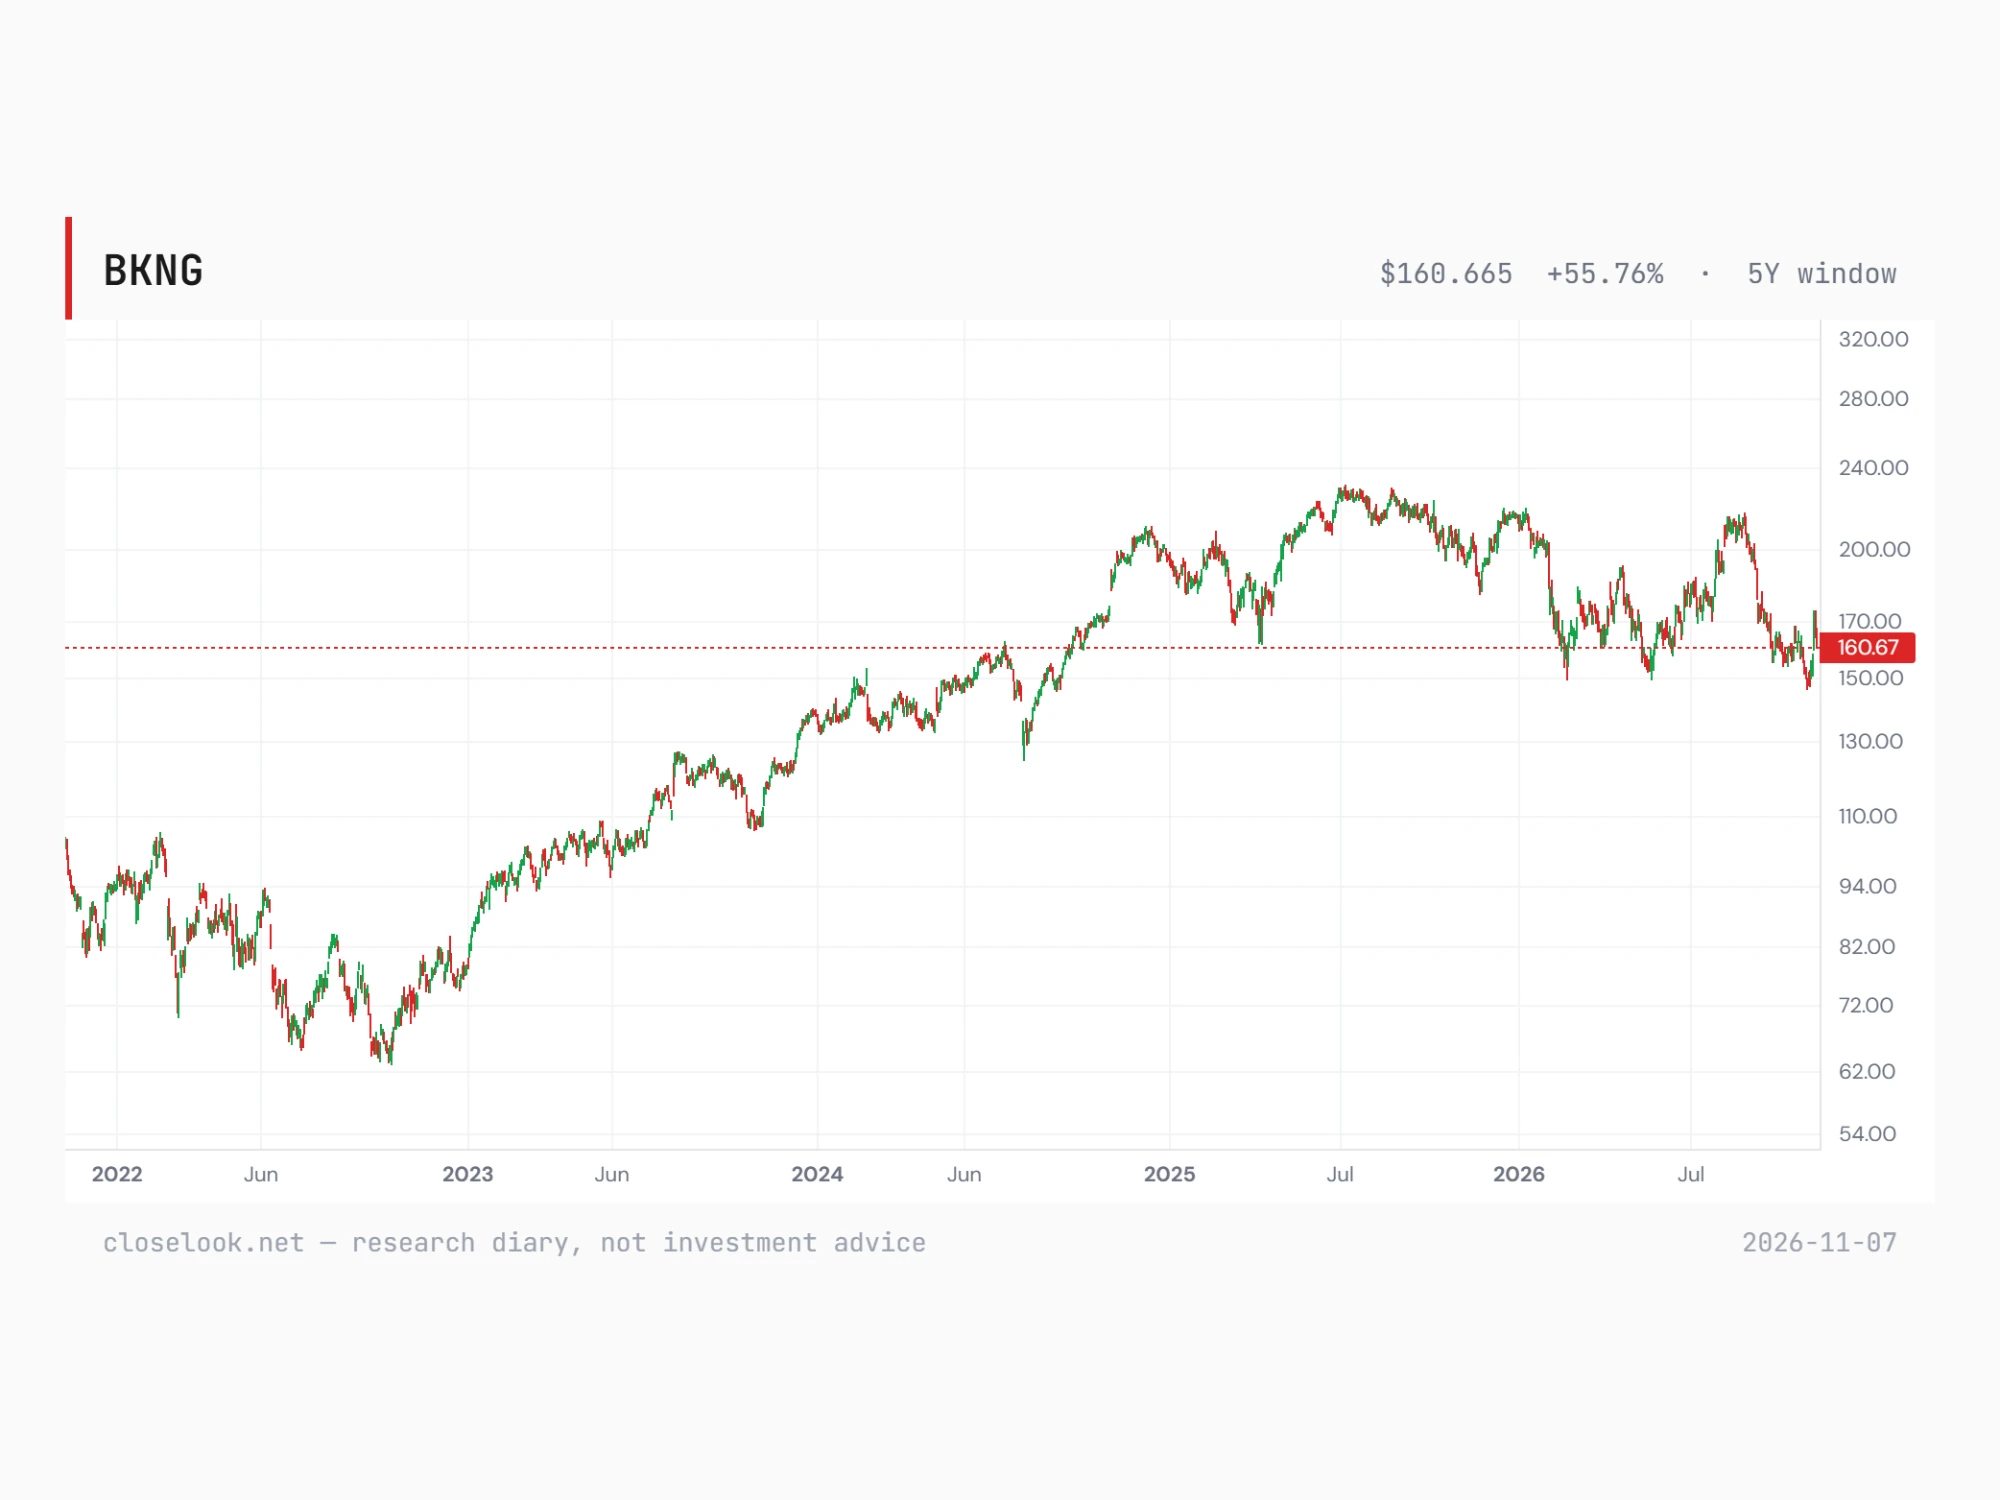
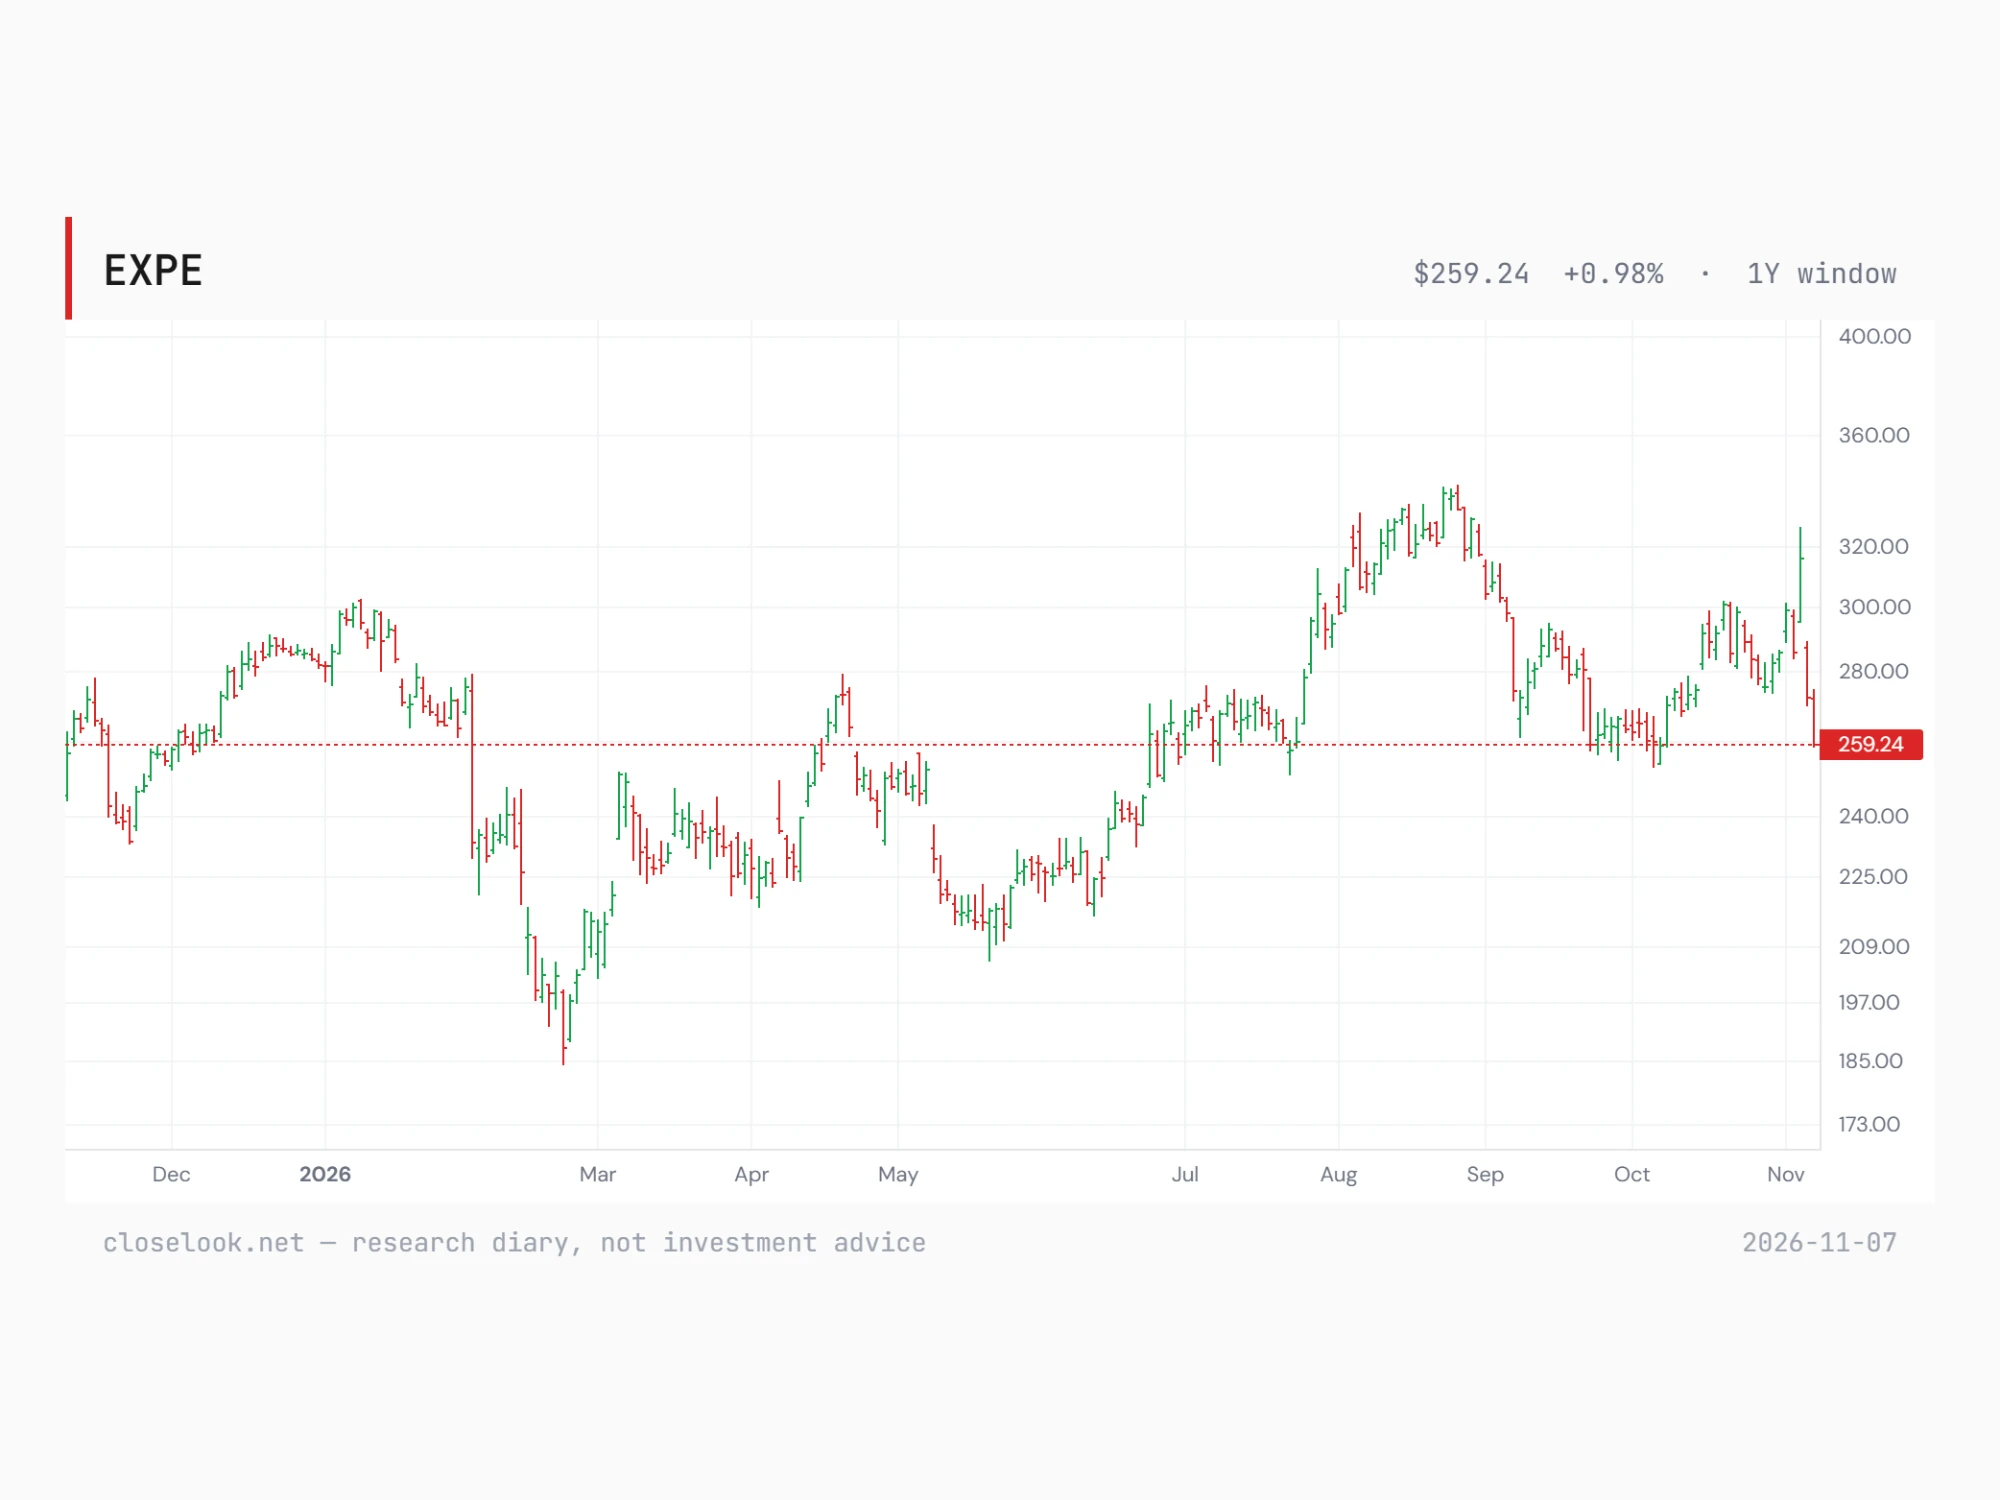
- A split sector: the large online booking site fell 4.8% on Friday and its rival 4.9%; this year they are down 25.0% and 8.5%, a travel-review site 51.9% — while the two largest hotel groups are up 34% and 29% and closed at highs on Wednesday.
- An AI user, not an AI builder: the company sits in our AI Users index, which rose 0.7% in the week the AI build-out index fell 13.2%.
- Strong trend, stretched in the short run: +40.0% this year and +55.1% over twelve months, momentum score 88, but the fast stochastic reads 91.2 — overbought after a two-day jump.
- The same pattern last time: the August report gapped the stock from $151.64 to $178.07 in one session; it gave the whole gap back by 23 September ($149.58) before climbing again. Thursday's close of $170.13 is the first level below.
ABNB Airbnb last close 189.99 (2026-11-06)
The Setup
The claim: travel has split in two, and the market is paying the owners of the stay and selling the sellers of search. This year the company that owns its listings is up 40%, the two largest hotel groups 34% and 29% — while the two large online booking sites are down 25% and 8.5% and a travel-review site has halved. The week made the split sharper: on the Friday the platform rose 11.7%, the booking sites fell nearly 5% each.
Why the split. The diary's reading, not a fact on the tape: a company that sells search results and takes a commission on the click is exposed when AI assistants start to plan and book trips themselves; a company that owns the inventory — the homes, the rooms, the brand the guest asks for — is the place the assistant has to book. That is why this name sits in our AI Users index, not on a list of AI losers.
The chart says the same. The stock is back at the ceiling it first reached in early 2022 and touched again in August. Last time the report's gap was given back within seven weeks. This time it starts from a higher low, in a week when the market sold the builders of AI and bought its users.
In the Closelooknet readings
Said plainly: this is Airbnb (NASDAQ: ABNB), the platform where people rent homes and rooms from hosts — it owns the guest relationship and inventory nobody else lists, rather than reselling hotel rooms found by search. It is a member of our AI Users index: companies that put AI to work in their own business rather than selling the chips or the models.
52-week range (closes): 111.54 – 190.5
The latest print
Last report — published Thursday 5 November after the close. Earnings per share $3.16 against $2.85 expected; revenue $4.87 billion against $4.75 billion. The stock rose 11.0% after hours to $188.84 and closed Friday at $189.99, +11.7% on the day. On the same Friday the large online booking sites fell 4.8% and 4.9%.
The report before — August. The stock gapped from $151.64 to $178.07 in one session (+17.4%) and then gave the whole move back by 23 September, when it closed at $149.58. This time the jump starts from a higher base: Thursday's close of $170.13 was already 13.7% above the September low.
The fundamentals
At $189.99 the company is valued at about $114 billion. On the last twelve months it trades at about 35 times earnings and 8.2 times revenue, with a net margin of about 23%. That is a growth valuation for a company that has already proved it can earn — and the reason a miss would hurt.
The chart, read by hand
Trend: Five-year view: a wide range since early 2022, with the ceiling near $190 — the early-2022 highs and the 25 August 2026 high of $190.50. The August report gapped the stock up to that ceiling, the gap was filled by late September ($149.58), and the climb since has been steady: a higher low, then Friday's jump back to the ceiling. Price now presses the line from below for the second time in three months.
Oscillators: The fast stochastic reads 91.2 after the two-day jump — overbought in the short run; the slower line reads 44.6, so the move is fresh rather than tired. Momentum score 88, quality 84; the uptrend stack (20-, 50- and 200-day) is intact.
Elliott Wave count: No wave count drawn for this edition — the read rests on the four-year ceiling, the August gap and the split in the sector.
Key levels: $190.50 — the 25 August high and the four-year ceiling; a weekly close above it breaks the range · $170.13 — Thursday's close and Friday's gap; holding above it keeps the breakout attempt alive · $149.58 — the 23 September low where the August gap was filled; the floor of the current leg
What the machines say
Technical snapshot (as of 2026-11-06) — vs 20d +10.8% · vs 50d +12.4% · vs 200d +28.6% · off 52w-high -1.8% · stochastic K 91.2 / D 44.6 · Uptrend stack intact
Pattern engine (scan 2026-11-06) — directional-flow 45/100, neutral, flat (5d +0.4%, 21d +1.4%)
Closelooknet scores (as of 2026-11-06) — composite 65/100 · momentum 88/100
Machine blocks render only where our engines actually cover the name — nothing is padded.
The risks, equal billing
What would prove us wrong. A turn lower from $190.50 that closes Friday's gap under $170.13 would repeat the August pattern — a report jump given back — and draw a double top with the August high; the September low near $150 is the floor of that path. A sector-wide travel sell-off on a weaker consumer would take the owners down with the sellers, ending the split this pick rests on. At about 35 times earnings, a disappointing next report would cost more than it did at lower prices.
Our forecasts
Next 2–4 weeks: After a two-day jump and a stochastic above 90, a pause under $190.50 is the normal path; holding above Thursday's $170.13 keeps Friday's gap open and the breakout attempt alive.
The ceiling: A weekly close above $190.50 would break the range that has held since early 2022 and turn the August high into support; a turn lower from here would draw a double top with August, with the gap at $170 and the September low near $150 below.
12 months: If the split holds — owners of the stay and the brand paid, sellers of search marked down as AI assistants start to book trips — the old ceiling becomes the floor; if the whole sector is sold together, the stock falls back into its four-year range.
Diary views, not advice — held publicly alongside the scored record.
Why publish this name? Because our Directional Flow readings are what let us say it: stocks with this or a similar setup have often — historically — done well over the following twelve months. That is the engine's backtested observation about the past, not a forecast; past performance may not be an indication of future performance. Which is exactly why every pick is scored publicly against the tape from today, at one week, one month, three, six and twelve. 12-month view, written 7 November 2026 from the close of 6 November ($189.99). Diary, not investment advice.
Closelooknet publishes an investment research diary, not investment advice. Every pick is scored publicly against the tape at 1w/1m/3m/6m/12m from publication — the record, not the single call, is the product.
Open the live ABNB terminal → All picks & the running record →
A note from the editor: the Weekly Chart Pick is free. Its price is one click — add Closelooknet as a preferred source on Google, and you support this work in Google Discover and Search every time you read.
Google opened in a new tab. Add Closelooknet there, then come back to this tab — the Chart Pick unlocks the moment you return.
The preferred-source setting lives in your Google account — if Google asks you to sign in first, you will land on the selection page right after. Google does not tell us whether you saved the selection. Clicking “Done” unlocks the Weekly Chart Pick on this device for 12 months.