Weekly Chart Pick · 2026-09-25
The AI software company whose sales grew 93% while its stock fell by half: back within 7% of its record after breaking a two-month range — at 83 times next year's earnings
The company sells software that lets governments and large companies run their operations on their own data, and in the June quarter its revenue grew 93% to $1.94 billion, with the US commercial business up 149%. It then raised its full-year revenue forecast to about $8.15 billion, 82% growth. None of that stopped the stock from falling 48% between its record close of $207.18 on 3 November 2025 and $107.27 on 25 June 2026, in the sell-off that hit expensive software. Since the June low it has risen 80%. On 23 September it closed above $188, the ceiling of a range that had held since late August, and on Thursday it tested that level from above and held, closing at $192.59, 7% under the record. Twelve-month view: higher, in our view, but in a band set by the valuation — the business has earned the chart, the price has not yet earned a margin of error.
- The business accelerated while the stock fell. Revenue grew 85% in the March quarter and 93% in the June quarter, to $1.94 billion. US commercial revenue rose 149% to $764 million and US government revenue 90% to $809 million. The company closed $3.37 billion of contract value in the quarter, up 49%, including a record $2.13 billion from US commercial customers.
- Growth and profit at the same time. GAAP operating income was $912 million in the June quarter, a 47% margin, and free cash flow $1.2 billion. The company reports a 'Rule of 40' score — revenue growth plus profit margin — of 155%; most software companies are judged healthy at 40. It carries no net debt.
- The forecast went up again: full-year 2026 revenue of about $8.15 billion, 82% growth, up from $7.65 billion three months earlier; US commercial revenue above $3.42 billion, at least 134% growth; adjusted free cash flow of $4.5 to $4.7 billion. The stock jumped 29.5% on the first session after the report, on 175 million shares.
- The fall was about price, not performance. From its November record the stock lost 48% by late June as investors sold expensive software and bought chipmakers, and on reports of a legal challenge in Switzerland and a lost French intelligence contract. At the low it still traded at more than 100 times trailing earnings.
- This week the chart turned. The stock closed above $188, the high of 28 August that had capped it for a month, on 23 September; on Thursday it dipped to $188.24 and closed at $192.59 — the old ceiling acting as a floor. Six rising sessions in a row, a new US Army contract for ammunition management, new partnerships with Nvidia and Nebius, and two brokers raising their targets.
- The price is the risk. At about $461 billion the company trades at 83 times next year's expected earnings and about 57 times this year's revenue forecast, with the 10-year Treasury yield at 5.16%. A fast-growing company can grow into that; a single quarter of slower growth can take a third off it, as the first half of 2026 showed.
PLTR Palantir Technologies last close 192.59 (2026-09-24)
The Setup
The claim: the market spent the first half of 2026 repricing this company as an expensive software stock, while the company spent it becoming a faster-growing and more profitable one — and the chart has now said, for the first time since November, that the market agrees.
Start with what the fall was. From a record close of $207.18 on 3 November 2025 the stock fell to $107.27 on 25 June 2026, a 48% drawdown. Over the same stretch revenue growth rose in every quarter the company reported: 63%, then 70%, then 85% — and 93% in the June quarter that followed. The market was not reacting to the business; it was repricing every software company that traded at a high multiple, and it rotated that money into chipmakers and memory. This company, at well over 100 times earnings, was the most expensive of them all, so it fell the furthest.
Then the June-quarter report on 3 August: 93% growth, the US commercial business up 149%, the full-year forecast raised to 82%. The stock rose 29.5% the next day. For a month it traded in a range between about $165 and the $188.37 high of 28 August. On 23 September it closed at $191.79, above that ceiling; on Thursday it dipped to $188.24, held, and closed at $192.59. Old resistance turning into support is the cleanest signal a chart can give.
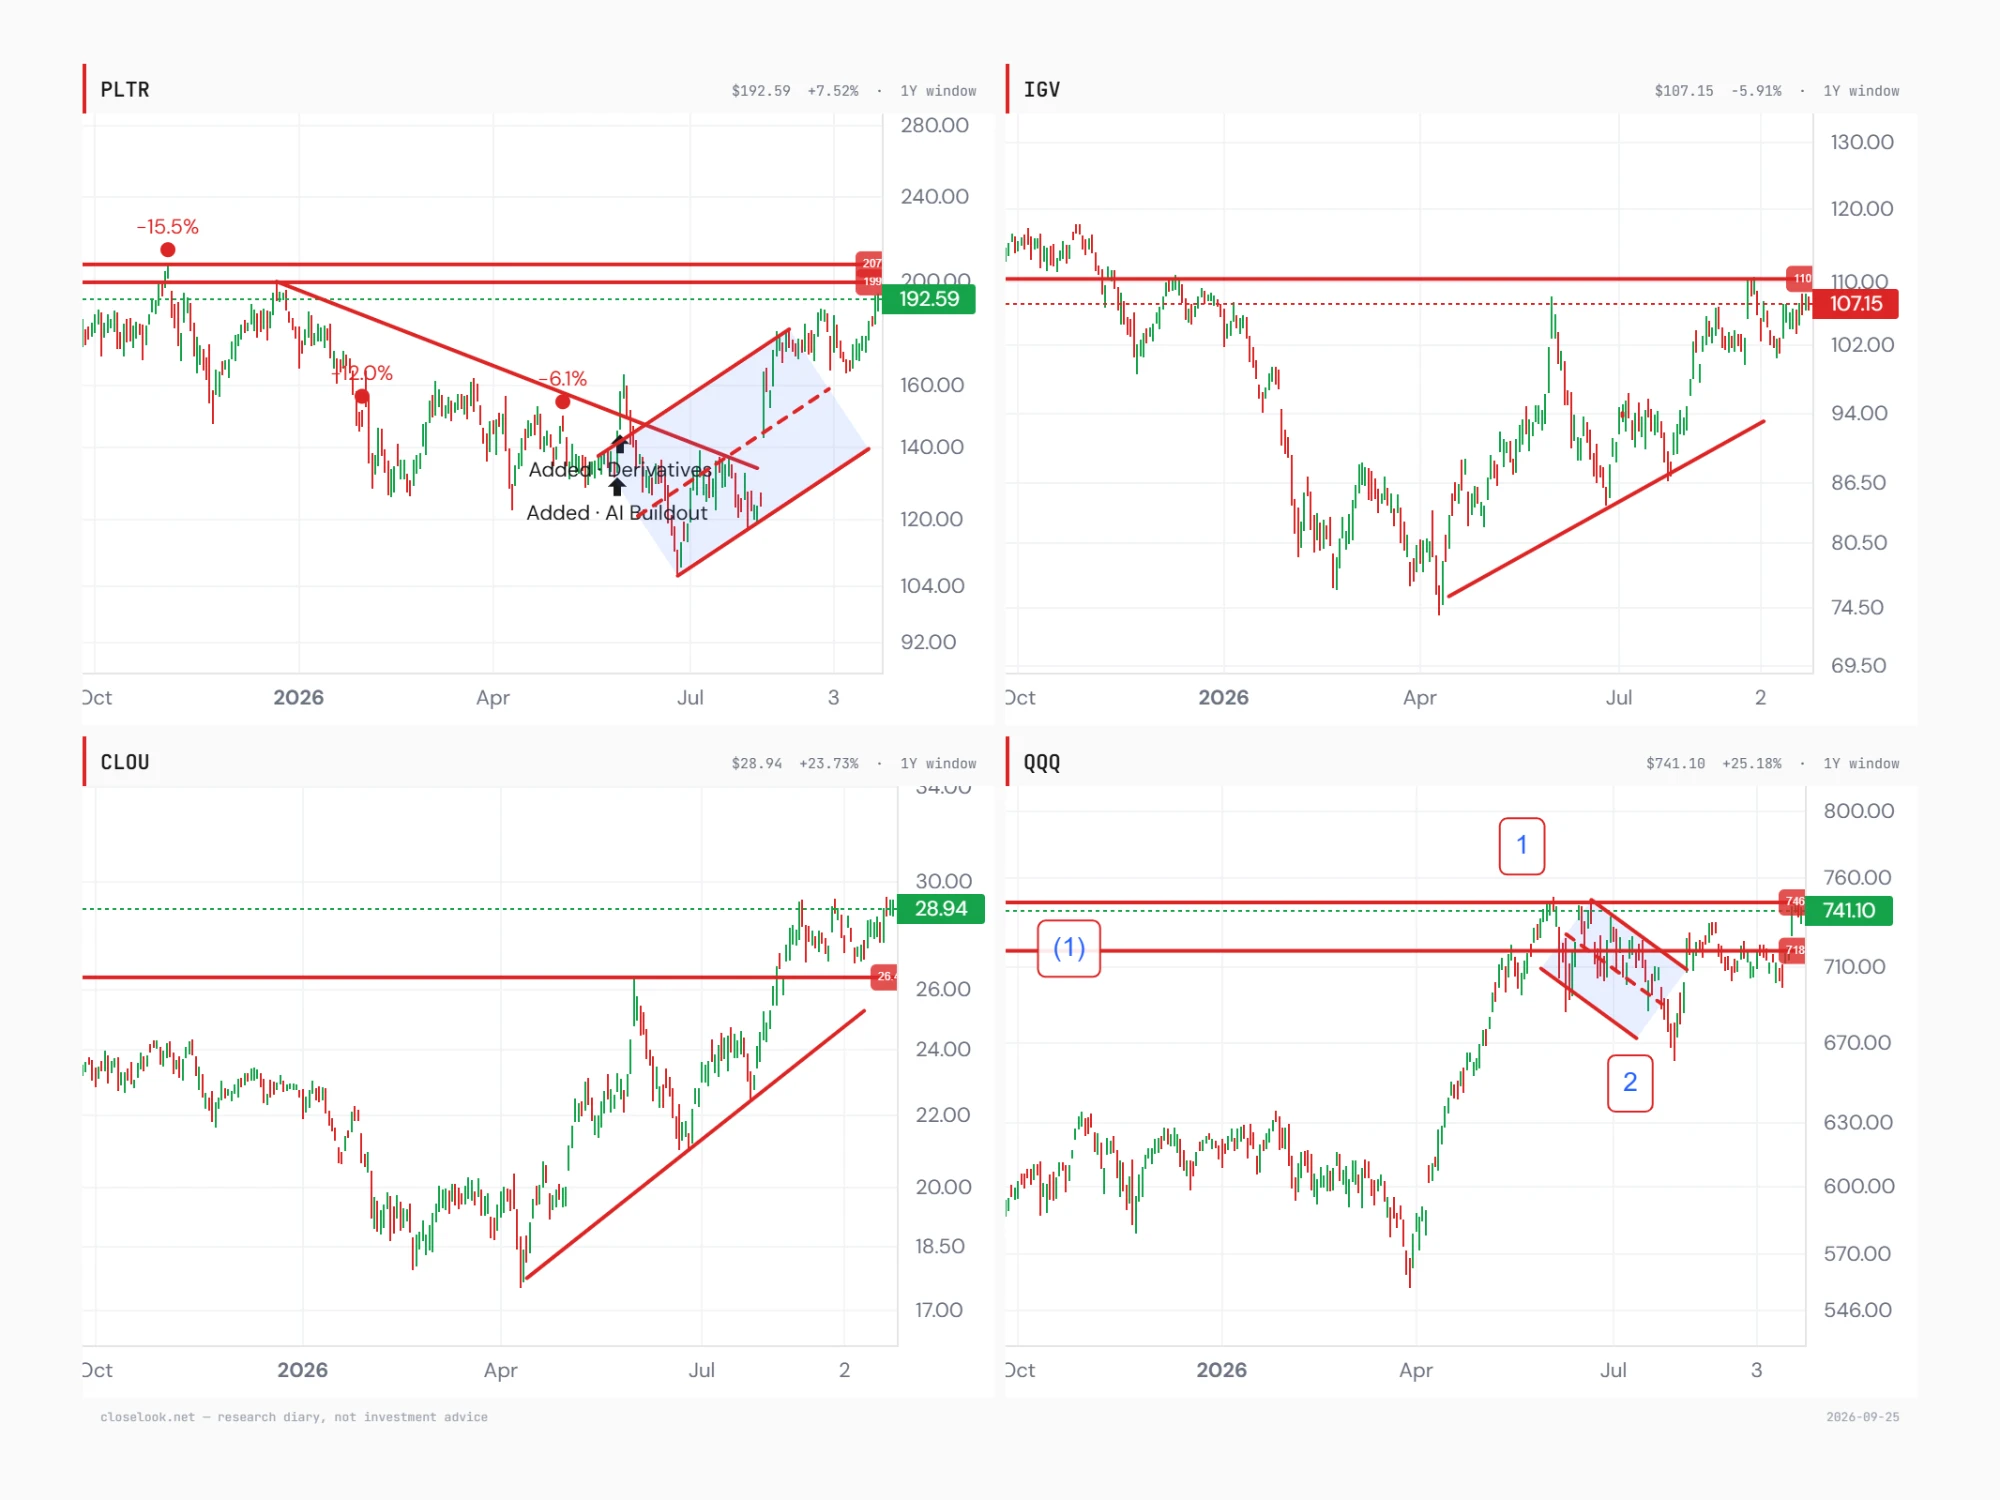
It leads its own group. The software fund IGV is down 5.9% over the year and still under its $110 ceiling; the cloud-software fund CLOU is up 23.7% and has cleared its $26 line; the Nasdaq-100 fund QQQ is up 25.2% and sits between $718 and $746. Our pick is up 7.5% over the year, but it fell further and has come back faster: it is already through its range while the software group is still testing its own. When a sector turns, the leaders break first.
The setup is a business whose growth is accelerating at a scale few software companies have reached, whose profits and cash flow are already large, and whose stock has been through a 48% fall and recovered most of it on the numbers alone. What makes it a diary pick rather than an obvious one is the price: 83 times next year's earnings in a market where the 10-year pays 5.16%. The chart says the market is willing to pay it again; the valuation says it will not forgive a slowdown.
What we do not claim: that the growth rate will hold at 80–90% for long, that government budgets are immune to politics, or that the multiple is justified. We claim that the chart has turned with the business behind it, and that the levels to know are clear.
In the Closelooknet readings
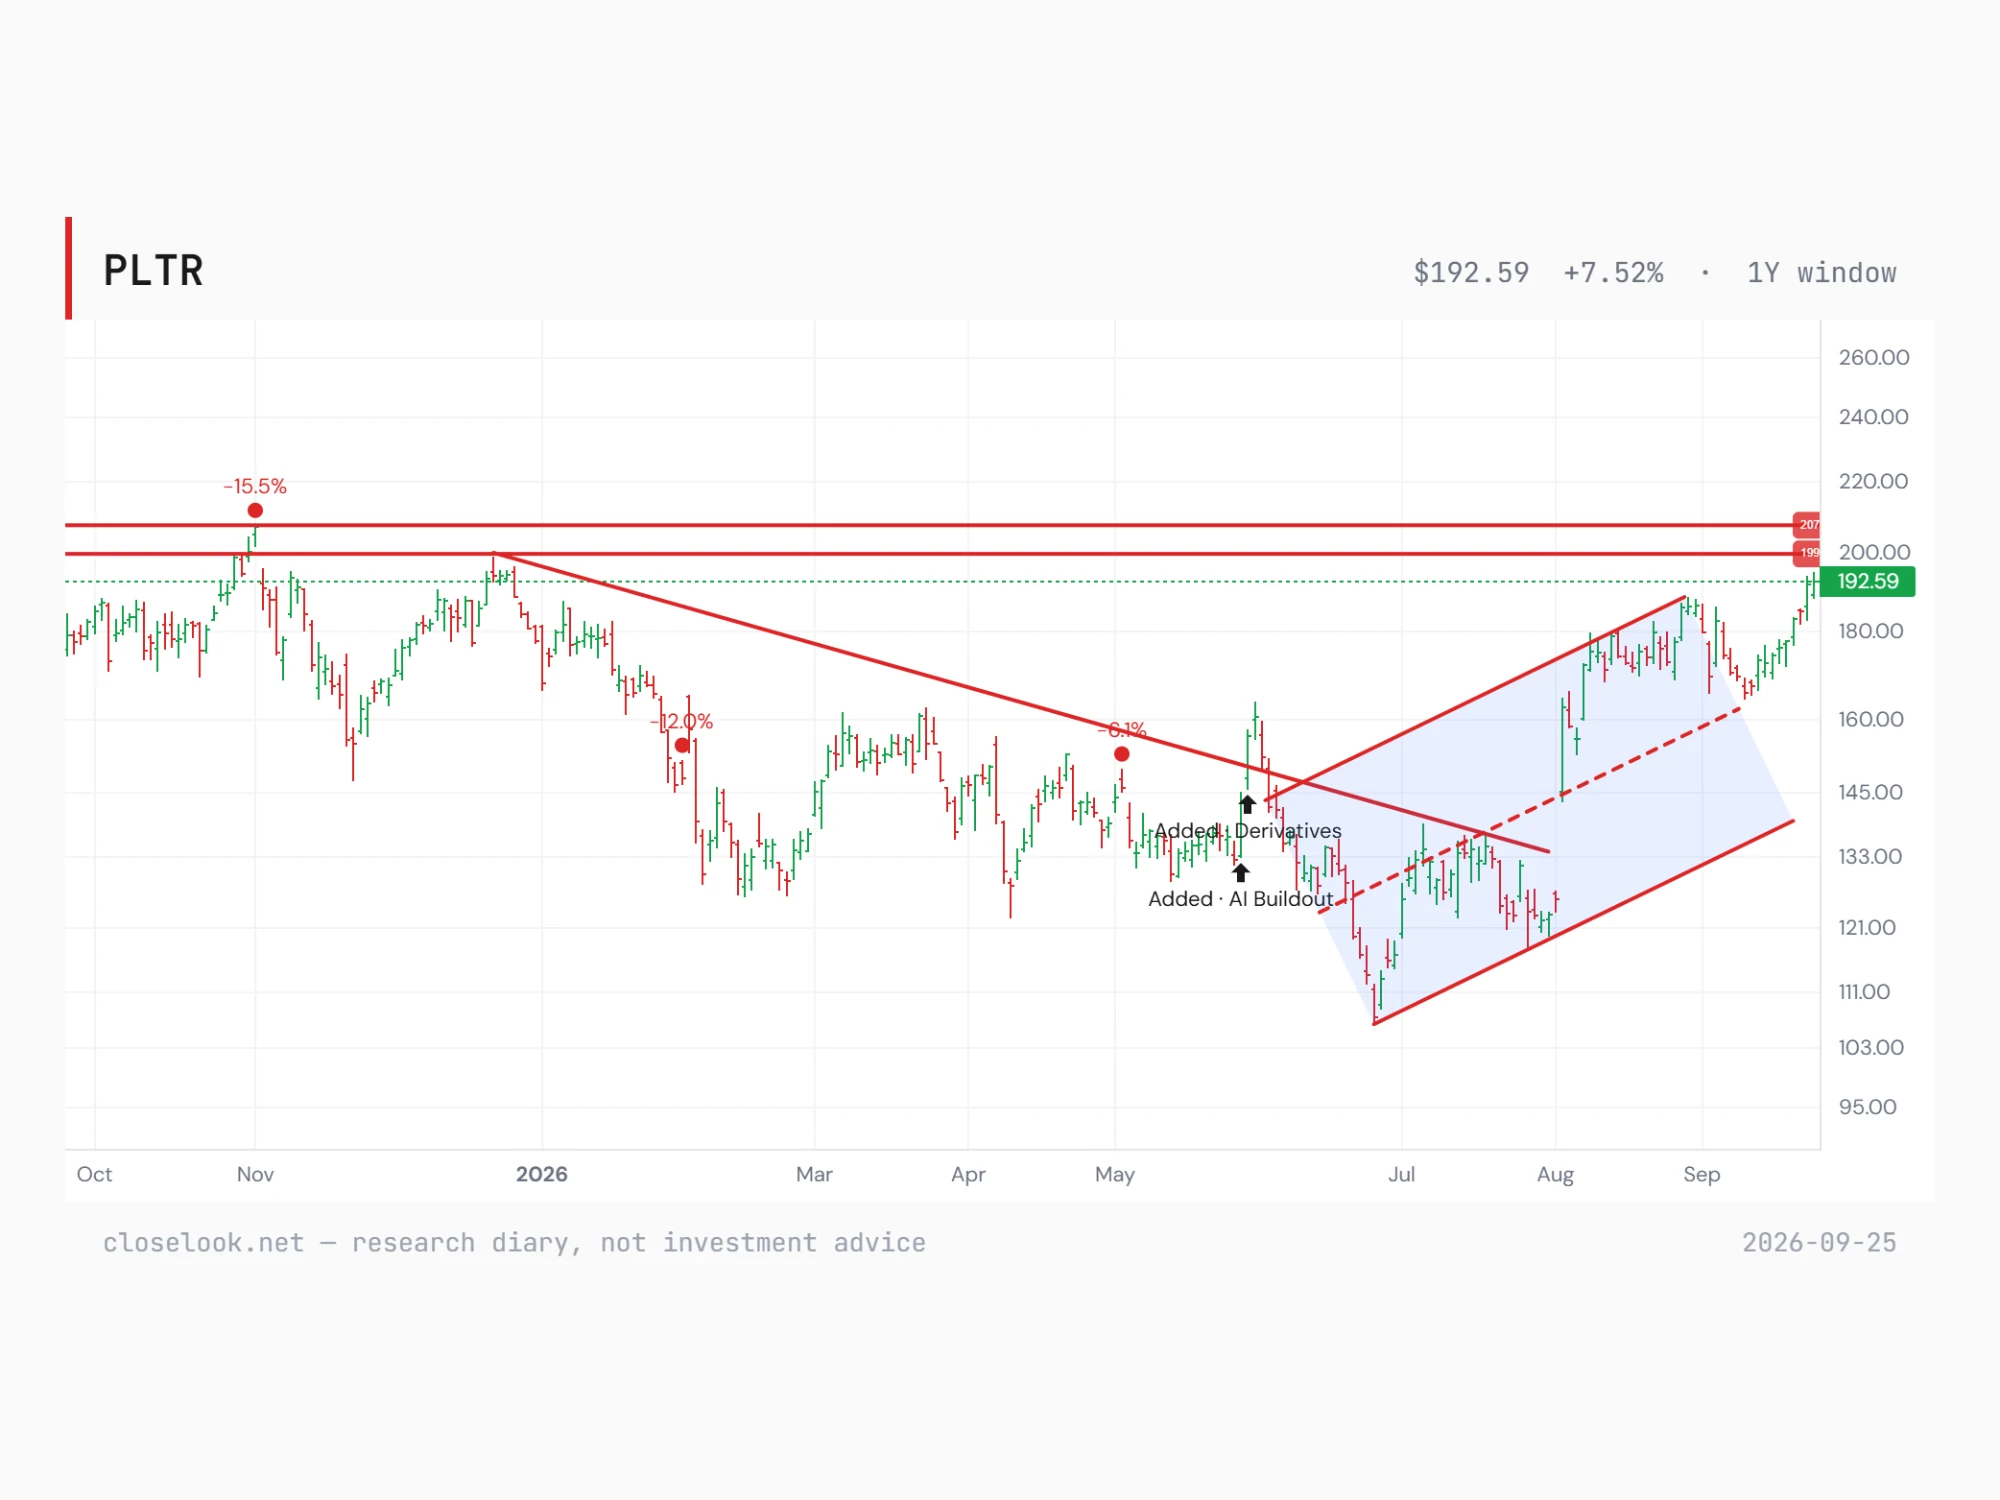
Said plainly: the company holds a seat in our Agentic Winners 40 index, in the Control Plane sleeve — the software layer that decides what AI agents are allowed to do with an organisation's data. Its Closelooknet scores are among the strongest in the universe on the business and middling on the price: quality 90, growth 89, momentum 76, composite 64. Directional Flow reads it as accelerating up, with the 21-day flow change at +27 — money arriving faster, not just arriving. Thursday's technical bake: 8.1% above the 20-day average, 18.6% above the 50-day, 26.2% above the 200-day, a six-day win streak and a slow stochastic in the 90s — stretched in the short run inside a trend that has turned up on every timeframe. As a pick this is the opposite of the last three: not a cheap stock with a story, but an expensive stock with the numbers, bought after a 48% drawdown reset the price once. Disclosure: the diary holds the stock. The AI Buildout and Hypergrowth portfolios each bought 100 shares on 28 May at an average of $143.35, now 34% higher, and the Derivatives portfolio holds one short $150 put, first sold on 29 May and now running to June 2027; two of the four wikifolios hold it as well, AI Cycle 2030 with 15 shares and Closelooknet with 60 — the markers 'Added · AI Buildout' and 'Added · Derivatives' on the charts. The pick is written from that position, not around it. All levels on this page are measured from Thursday's close of $192.59; at publication on Friday, with the US market still open (about 2:40 pm New York time), the stock traded at $191.38, down 0.6% on a day the Nasdaq was up 0.4% — a pause after six rising days, not yet a test of $188.
52-week range (closes): 107.27 – 207.18
The latest print
The June quarter, reported on 3 August, was the fastest growth in the company's history as a public company. Revenue $1.94 billion, up 93% from a year earlier and up 19% from the March quarter. US commercial revenue $764 million, up 149%; US government revenue $809 million, up 90%. The number of customers rose 24% to 1,049; US commercial customers rose 35% to 653. Total contract value closed in the quarter was $3.37 billion, up 49%, with a record $2.13 billion from US commercial customers.
Profit came with it. Gross profit $1.64 billion, an 85% gross margin. GAAP operating income $912 million, a 47% operating margin; net income $1.06 billion; free cash flow $1.2 billion. Share-based compensation was $265 million in the quarter, about 14% of revenue — the cost of the talent that does not show up in the adjusted figures. The company's 'Rule of 40' score, growth plus adjusted margin, was 155%.
The forecast. Full-year 2026 revenue raised to $8.15–8.16 billion, 82% growth, from $7.65–7.66 billion three months earlier. US commercial revenue raised to more than $3.424 billion, at least 134% growth. Adjusted operating income $4.889–4.897 billion; adjusted free cash flow $4.5–4.7 billion. The stock closed at $125.65 on the day of the report and at $162.66 the next day, up 29.5% on 175 million shares.
The next report is due in early November; the company has not yet confirmed the date.
The fundamentals
What the business is. The company builds software that pulls an organisation's data into one model of its operations — soldiers and supplies, factories and orders, patients and beds — and lets people and, increasingly, AI agents act on it. It began with intelligence and defence customers and still earns about 42% of revenue from the US government; the growth engine now is US companies, where its AI platform is sold in short, intensive onboarding sessions that turn into large contracts. It does not train models; it sits between the models and the data, deciding what an agent may see and do.
Scale and margins. Revenue over the last four quarters was about $6.2 billion, and the company guides to about $8.15 billion for 2026. Gross margin 85%, GAAP operating margin 47% in the June quarter, free cash flow $1.2 billion in the quarter and $4.5–4.7 billion guided for the year. It holds net cash and no meaningful debt. Return on equity 38%.
The price. At $192.59 the company is valued at about $461 billion: 164 times trailing earnings, 83 times next year's expected earnings, about 75 times the last four quarters' revenue and about 57 times this year's revenue forecast. The PEG ratio — the multiple divided by expected growth — is 1.8, lower than the headline multiple suggests because the growth is so fast. For comparison, in today's Daily Pulse five of the Magnificent Seven trade at 22 to 25 times next year's earnings.
Where it sits for us. A member of the Agentic Winners 40, in the Control Plane sleeve with the companies that govern what agents can reach. Closelooknet scores: quality 90, growth 89, momentum 76, composite 64 — the gap between 89–90 and 64 is the valuation.
The chart, read by hand
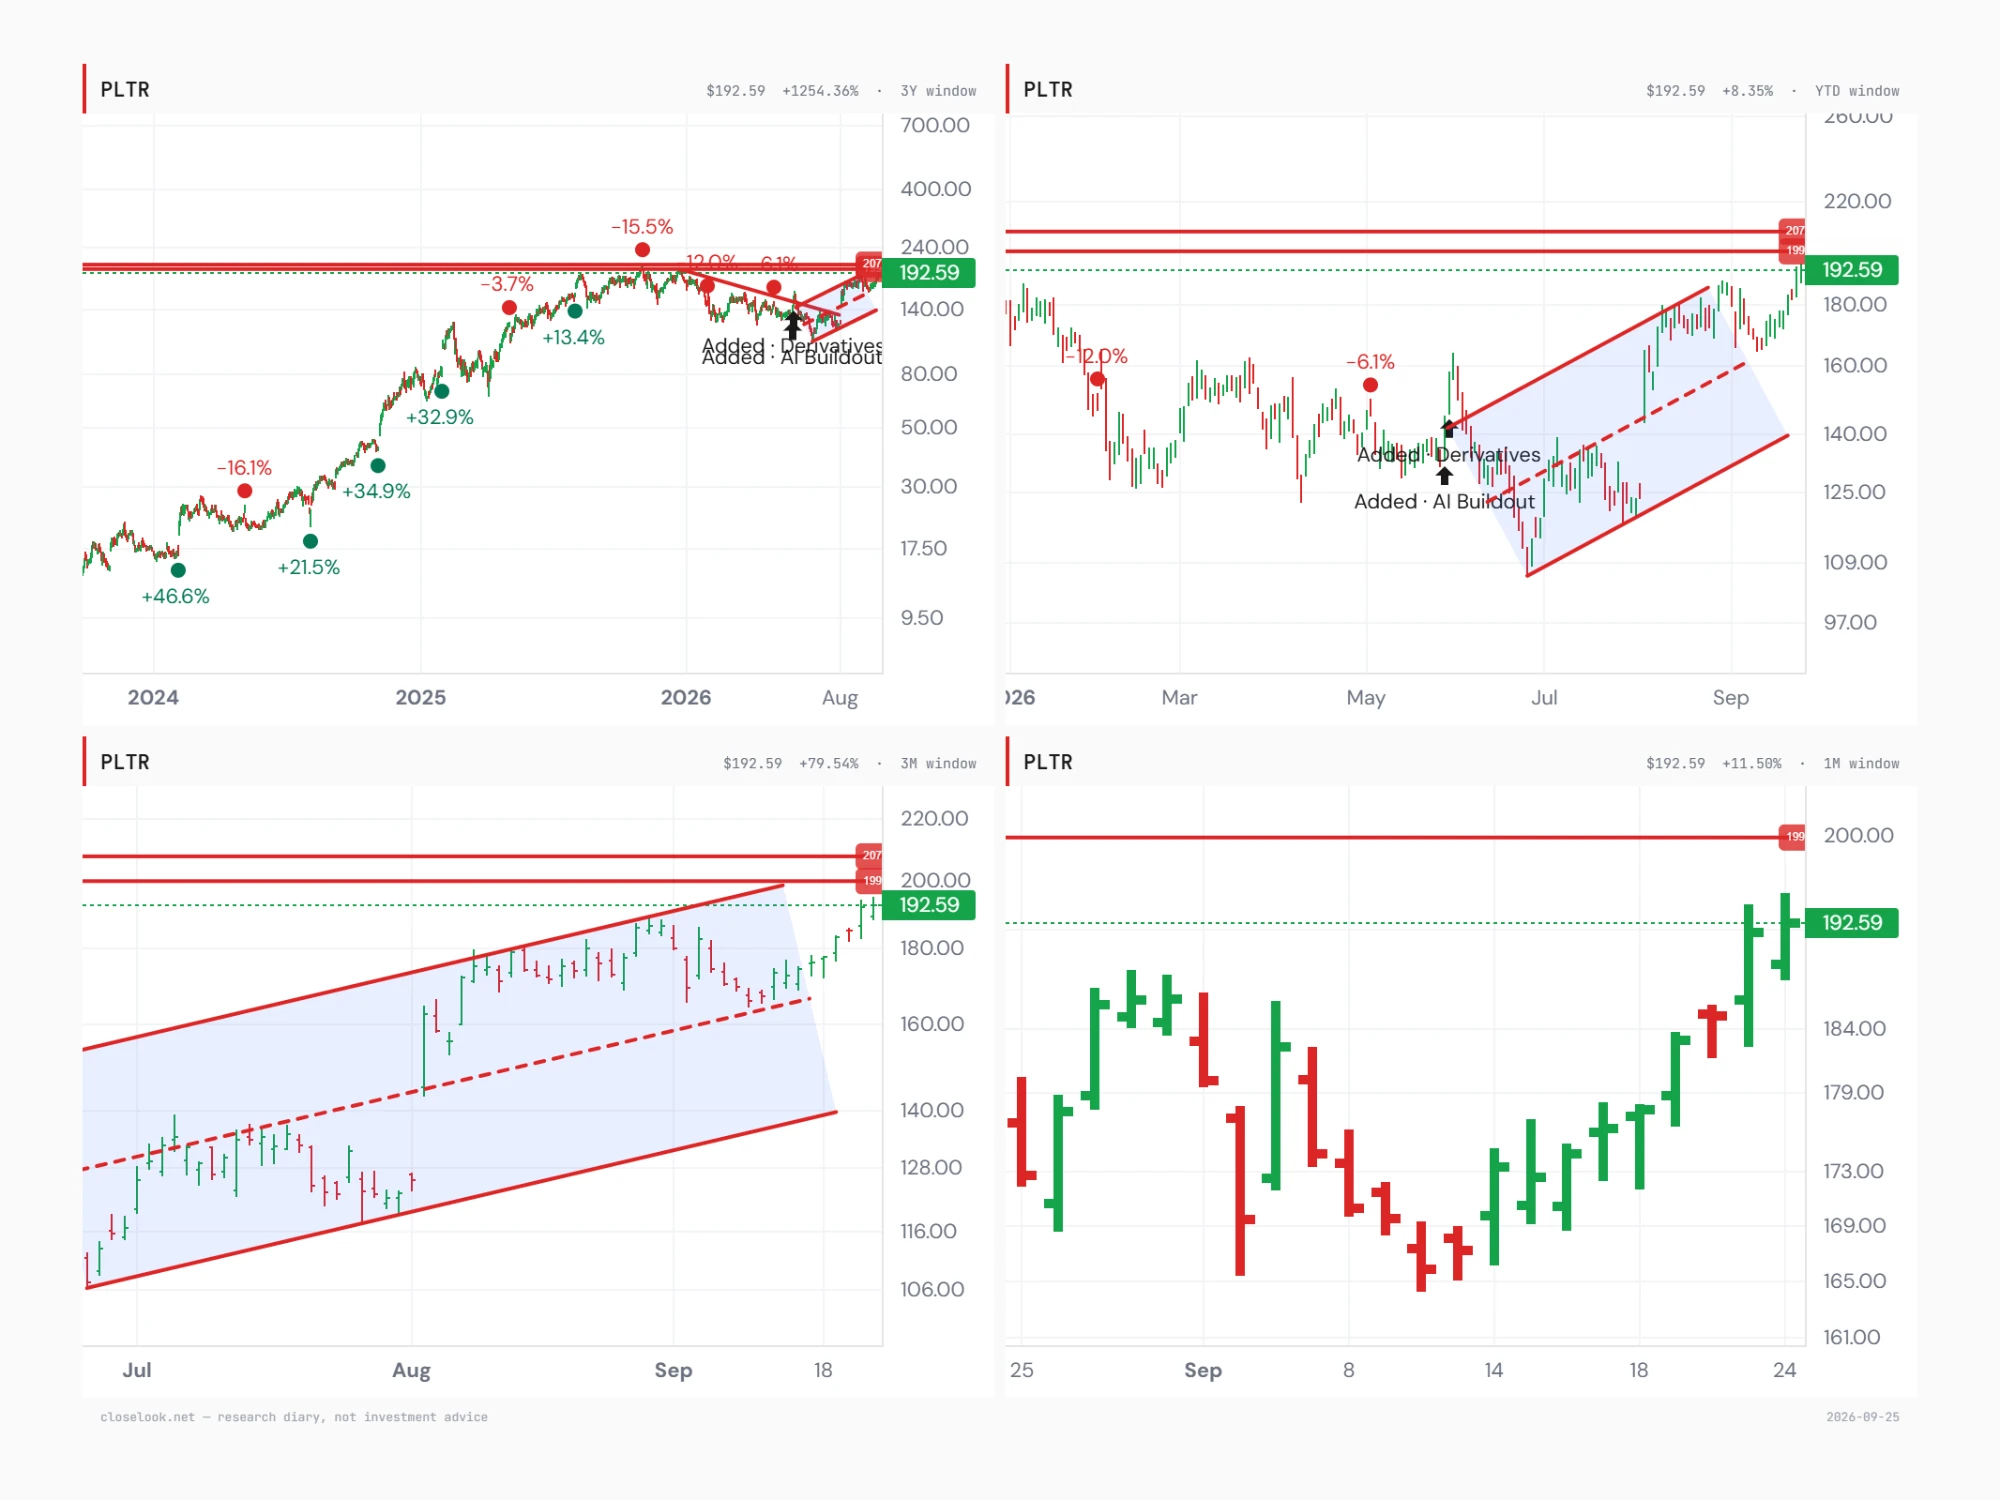
Trend: Thomas's charts lead, drawn on Thursday's close at $192.59. The one-year chart has two horizontals overhead: the record close of $207.18 from 3 November 2025, and $199 — the high of 22 December ($198.88), the lower high that started the fall. From that December high a descending line ran through the February and May lower highs; it broke in June, just as the stock made its low of $107.27 on 25 June. From that low Thomas draws a rising channel: the lower line from the June low through the late-July higher low, the upper line through the August and early-September highs, a dashed midline between them. The 29.5% gap after the June-quarter report took the stock from the lower half of the channel into the upper half, where it has stayed. The three-month panel shows the stock now at the top of the channel, where the upper line meets the $199 horizontal this week. The one-month panel: the 10 September low at $164.55, then six rising sessions to $192.59, through the $188 high of 28 August. The three-year chart, log scale, puts it in context: the 2024–25 run from under $20 to $207, and the swing markers on Thomas's chart — +46.6%, +21.5%, +34.9%, +32.9% and +13.4% on the way up, −15.5% in November, −12.0% in February and −6.1% in May on the way down. The setup is a stock at the top of a rising channel, 3% under the line that started the decline and 7% under the record.
Oscillators: Slow stochastic 94.1 over 88.0 on Thursday's close, computed from the bars: overbought after six rising sessions, at the top of the channel, under the $199 line. That combination usually brings a pause before a break, not a break straight through. A close above $199 with the oscillator still high would say the market is treating December's high as the last obstacle before the record; a turn down from here toward the channel midline near $165 would be a normal reset inside an uptrend, not a failure. The 20-day average at $178, the 50-day at $163 and the 200-day at $152 all rise under price.
Key levels: $207.18 — record close, 3 November 2025 (Thomas's $207 line) · $198.88 — high of 22 December 2025, the lower high that started the fall (Thomas's $199 line); the channel top meets it this week · $194.68 — Thursday's intraday high · $192.59 — Thursday's close · $188.37 — high of 28 August, the old range ceiling; retested and held on Thursday at $188.24 · $178 — 20-day average · about $165 — channel midline; $164.55 — 10 September low · $163 — 50-day average, rising · $152 — 200-day average, turning up · about $140 — channel lower line · $143.35 — the diary's average entry, 28 May 2026 · $107.27 — 52-week low, 25 June 2026
What the machines say
Technical snapshot (as of 2026-09-24) — vs 20d +8.1% · vs 50d +18.6% · vs 200d +26.2% · off 52w-high -7.6% · stochastic K 91.2 / D 77.7 · 6-day win streak
Pattern engine (scan 2026-09-24) — directional-flow 0/100, neutral, accelerating up (5d +7.0%, 21d +27.1%)
Closelooknet scores (as of 2026-09-24) — composite 64/100 · momentum 76/100
Machine blocks render only where our engines actually cover the name — nothing is padded.
The risks, equal billing
The risk the stock trades on first: the multiple. At 83 times next year's earnings, the price assumes growth stays very high for years. The first half of 2026 showed what happens when the market stops paying for that: a 48% fall while revenue growth accelerated. With the 10-year at 5.16% and the 30-year touching 5.50%, every year of future profit is worth less today than it was in June. A long-duration stock in a rising-rate market is exposed even if nothing goes wrong in the business.
The risk in the growth rate. 93% growth at $1.94 billion a quarter is exceptional; the forecast of 82% for the year already implies some slowing in the second half. A quarter in which US commercial growth drops sharply — or in which the contract value closed stops rising — would be read as the peak, and at this multiple the stock would react to the second derivative, not the level.
The risk in the customers. About 42% of revenue comes from the US government, and more from other governments. Budgets, procurement rules and politics change; the reported legal challenge in Switzerland and the lost French intelligence contract in the first half are reminders that government work outside the US is political. A US budget fight or a change in defence priorities would hit the part of the business that looks most stable.
The risk in the share count and the chart. Share-based compensation of $265 million in a quarter dilutes holders every year. And the chart is stretched in the short run: six rising days, the slow stochastic above 90, the price 18.6% above its 50-day average. Breakouts from ranges are often retested; a close back under $188 would say the break failed, and the 50-day near $163 is the next support.
Our forecasts
12 months from now: Higher, in our view, in a band set by the valuation rather than by the business. If the company reports growth above 70% in the September and December quarters and US commercial keeps above 100%, the $199 December high and the record close at $207.18 are the first objectives, 3% and 8% above Thursday's close, and the market will be paying for 2027 growth by the spring. If growth slows faster than the forecast implies, or the 10-year keeps rising, the multiple can compress again even with the business intact; $165 — the floor of the August–September range — and the 200-day average near $152 are the levels that decide whether the twelve-month view survives. A diary view, not advice.
The next few weeks: The stock sits at the top of its rising channel and $6 under the $199 line where the decline began in December, with the short-term indicators overbought after six rising days. The first test is $199: a close above it leaves only the $207.18 record overhead, and a break of the record would take the stock out of the whole 2026 structure. A pause or a pullback from here is the more usual path and would not change the read as long as the old $188 ceiling holds; a close back under $188 says the break failed, and the channel midline near $165 — with the 50-day at $163 — is where the diary would reassess. The September-quarter report in early November is the next hard test.
Diary views, not advice — held publicly alongside the scored record.
Why publish this name? Because our Directional Flow readings are what let us say it: stocks with this or a similar setup have often — historically — done well over the following twelve months. That is the engine's backtested observation about the past, not a forecast; past performance may not be an indication of future performance. Which is exactly why every pick is scored publicly against the tape from today, at one week, one month, three, six and twelve. Twelve months. A diary view, not advice, and not an entry price. The diary holds the stock in two portfolios, a sold put in a third and two wikifolios. Thomas's charts lead; the count and levels are ours and are open to correction.
Closelooknet publishes an investment research diary, not investment advice. Every pick is scored publicly against the tape at 1w/1m/3m/6m/12m from publication — the record, not the single call, is the product.
Open the live PLTR terminal → All picks & the running record →
A note from the editor: the Weekly Chart Pick is free. Its price is one click — add Closelooknet as a preferred source on Google, and you support this work in Google Discover and Search every time you read.
Google opened in a new tab. Add Closelooknet there, then come back to this tab — the Chart Pick unlocks the moment you return.
The preferred-source setting lives in your Google account — if Google asks you to sign in first, you will land on the selection page right after. Google does not tell us whether you saved the selection. Clicking “Done” unlocks the Weekly Chart Pick on this device for 12 months.