C+

Weekly Signal · · 6 min read

The Earnings Bar Meets Its First Prints

Weekly Signal — S&P 500 earnings expectations: EPS estimate paths, revisions and the earnings season cadence over a dawn skyline

One signal to define the week and shape the month. Three minutes, six questions. Every Sunday at 21:00 CET — scored the next.

12 July 2026 · closes through Jul 10.

1 · The signal

Earnings season opens Tuesday against the highest expectations bar of the cycle — and the market just spent a week pricing in the good outcome before seeing a single print.

The signal has two layers. The narrow one: the numbers themselves — the first AI-compute bellwethers, ASML on Wednesday and TSMC on Thursday, print before any US heavyweight opens its books. The broad one, and the more important one: the market's reaction function. How does the tape treat this year's leaders when they print above consensus — and when they merely match or fall short, with guidance the focus either way? And the mirror image: how does it treat the laggards, software above all, on their numbers? The prints answer one week. The reaction read answers the month: whether the leaders still have room to run, and whether the laggards have absorbed all their bad news — or not.

This chart is the tape-side referee: SOXX at 581, sandwiched between the 554 floor it reclaimed and the 590 shelf it hasn't.
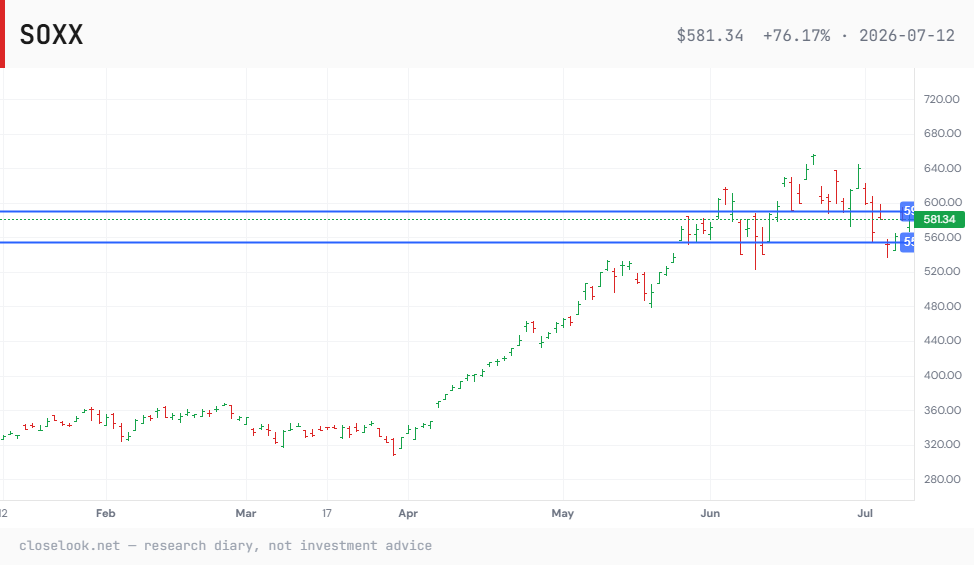
SOXX six-month chart with the 554 floor and the 590 shelf marked — price at 581, between the two lines, into earnings season
The referee: SOXX between the reclaimed 554 floor and the unreclaimed 590 shelf — six months, levels marked. Click through to the live chart.

2 · What it is

Two weeks ago the semiconductor complex repriced 7–12% in three sessions. This week the market took the other side: SOXX +2.7%, SMH +3.2%, fabless +5.1%, Nvidia +8.3% back above its 200-day — while last week's hiding places gave the money back. Software slipped (IGV −1.2%), and the prior week's rotation winners reversed hard across our own universe: HALO's defense cohort −9.4% and space −9.9% after leading everything at +18/+17, the Agentic index's identity tier −6.1% after +14.7%. The dip was bought, the hedges were sold — before the evidence.

And the tape narrowed while it happened: the S&P 500 gained +1.4% but the equal-weight version fell −0.3%, the Dow −0.4%, small caps −0.5%. One theme carried the index into its own examination week.

The bar being examined, in three numbers:

The bar, in three numbersConsensus estimates, sell-side aggregates as of early July+24%CY2026 earnings growth, S&P 500a bar this size normally stands in year one after a recession+40%Q2 projections — tech & AI infrastructurethe cohort that prints over the next three weeks+13%the median S&P stock27 points of dispersion between the theme and the middle — the widest of the cycle
The dispersion is the story: the index-level bar is carried almost entirely by one theme's capex cycle.

3 · Why it matters

A +24% consensus year is post-recession-sized — the kind of number that stands at the start of a profit cycle, not five years into one. When the forward bar crosses roughly 20%, the market has priced flawless execution: small misses and soft guidance get punished out of proportion, and next year's comparisons turn unforgiving before a single number is reported. Add the circularity we track all year — index-level earnings growth currently depends on the build-out spending of a handful of buyers. If the AI-infrastructure prints wobble, the downgrades arrive index-wide, not stock by stock.

That is why this particular week matters more than an ordinary season opener: the market has already repriced the recovery. Semis rallied into the prints; positioning leans toward the bull outcome. Whatever the reports say, the reaction function is now asymmetric.

4 · What to look for

The calendar first — the four checkpoints:

WhenWhatIfThen
TueJune CPI 8:30 ET + the banks open the season (JPM, GS, C, WFC, BAC)CPI hotthe multiple compresses before tech even reports — the bar gets heavier
WedASML — first AI-capex print: bookings and the 2026 frameorders confirm the +40% cohortthe equipment washout was positioning, not information
ThuTSMC — Q2 plus capex and AI-demand commentarycapex guide holds or risesthe build-out thesis survives its examiner; Netflix the same evening tests the bar outside tech
FriSOXX weekly close — the tape-side refereeabove 590reclaim complete; below 554 → the washout was the warning

Then the layer that converts the week into a regime — the top-down view, one 2×2: this year's leaders vs. laggards, against prints-and-guidance above vs. below consensus. Four quadrants, four tests. Not what gets reported — what the tape does with it:

ABOVE CONSENSUSBELOW CONSENSUSYTD LEADERSYTD LAGGARDSTHE ROOM-TO-RUN TESTLeaders beat, guidance firm — does thebeat get paid?Paid & held → leaders keep carryingthe index.Sold on the beat → the bar hasbecome the ceiling.THE PERFECTION TESTLeaders match or miss, guidance soft —how hard is it punished?Damage contained → the bar bends,doesn't break.Punished out of proportion → thedowngrade impulse begins.THE ROTATION TESTLaggards — software above all — surpriseto the upside. Do they get re-rated?Re-rated → the market wants a secondleg; the tape broadens.Ignored → the one-theme tapepersists.THE ABSORPTION TESTLaggards print soft numbers. Do theystill fall on bad news?No longer falls → bad news priced,the base is in.Keeps bleeding → no rotationcushion under the market.The grid gets filled in as the prints land — and scored here next Sunday.
The top-down view: four reaction tests, one per quadrant. The pattern across them — not any single print — selects next month's regime.

The signal is not the prints. It is the close of the tape against the prints: good numbers that can't hold 590 say more than the numbers themselves.

5 · Bull case / bear case

BullBear
ASML and TSMC confirm the capex cohort, beats get paid and held, and the laggards stop falling on soft numbers; SOXX closes the week above 590. The July-2 washout goes in the books as repositioning, the bar survives into the big-tech prints, and the +40% cohort keeps carrying the +24% year.Beats that fade — or guidance that blinks — while software keeps bleeding on its own prints, with SOXX failing at the shelf and slipping back toward 554. That is the expectations peak confirming itself: the first index-wide downgrade impulse of the cycle, opening the correction case during the season rather than after it.

6 · How it may define the next weeks

This is the move from weekly signal to monthly regime. The four quadrants of the matrix compile into one of three regimes for the back half of July and August:

Leaders paid + laggards done falling → the broad regime: room to run on both sides, dips into the heavyweight AI prints (weeks three and four of the season) keep getting bought, and the seasonal midterm drag is the only headwind left.

Leaders sold on good numbers → the ceiling regime: the expectations peak confirms itself while positioning still leans bullish — the highest bar of the cycle starts working in reverse, and the correction arrives during the season, not after it.

Leaders hold, laggards keep bleeding → the narrow regime: the barbell tightens further, the market pays only for proven AI revenue, and every print becomes a single-stock event with no rotation cushion underneath.

Whichever regime the week selects, it inherits a thin calendar: the pre-midterm window we mapped last week gives the tape little seasonal support to lean on. One week, three tests, three very different Augusts. Probability, not prophecy: the referee wears a ticker, and we score this signal next Sunday.

The week, for the record

Closelook indices (EW, wk)Markets (wk)
Agentic Ecosystem+1.3%S&P 500 (SPY)+1.4%
AW40+1.6%Nasdaq-100 (QQQ)+1.8%
Rubin−1.5%Equal-weight (RSP)−0.3%
HALO−2.9%Treasuries (TLT)−1.2%
Rubin systems cohort+7.7%Bitcoin+4.3%
HALO defense / space−9.4% / −9.9%Volatility (VIXY)−4.2%

Source: closelook.net Functional Indices and data lake; ETF and single-name figures verified against vendor EOD data, closes through Jul 10. Earnings dates verified against the vendor calendar (banks Jul 14, ASML Jul 15, TSMC and Netflix Jul 16). Consensus earnings figures from sell-side aggregates (FactSet Earnings Insight, Goldman Sachs U.S. equity forecast) as of early July. This is an investment diary, not investment advice — Look Investment GmbH is not a licensed adviser.