Source page — copy text into Substack/LinkedIn, upload the visuals. noindex · not public

Closelook@Hypergrowth · Weekly Edition
The Payment Came Back, and the Growth Moved Out of Tech
The neocloud challengers gave back every dollar of last week's verdict payments and more, the semis were rejected at the line, and the applications layer rose a second week while the buildout and the operating layer bled. Underneath it, the best names on the board had no AI in them — so this letter opens a standing section for that growth, with a fourth book to follow it.
Closelooknet is a reader-supported publication — to receive new posts and support the work, become a free or paid subscriber.
1 · This Week's Action
Where this letter sits. Sunday's US edition reads this market at index and sector degree — the tape, the levels, the count. This one reads it at name altitude: which individual companies the money actually went into, which ones it left, and what the flow behind each is doing. Same market, one rung lower — and from this week on, with a second pillar beside the AI complex: the growth that has no tech inside it, which is where the names went this week. It gets its own section below.
The backdrop, one line. The semis were rejected at their overhead line on Tuesday, the Treasury doubled its long-end buybacks on Wednesday as the minutes leaned hawkish and Seoul had its sidecar night, Walmart's double beat was sold nine percent on Thursday, the chart pick was paid thirteen on Friday — and the Nasdaq 100 closed the week 2.4% lower, on its 50-day average to the cent, with the VIX up six percent to 15.13.
| Symbol | Name | Last | 5D | 1M | 3M | 6M | YTD |
|---|---|---|---|---|---|---|---|
| DAPP | VanEck Digital Transformation | 19.48 | +9.68% | +1.88% | -8.42% | +26.58% | +17.85% |
| ARKK | ARK Innovation | 86.21 | +6.30% | +13.39% | +12.84% | +20.59% | +12.08% |
| FINX | Global X - FinTech | 27.55 | +2.95% | +7.92% | +11.01% | +15.72% | -6.38% |
| LIT | Global X - Lithium & Battery T | 76.61 | +1.83% | +11.03% | -10.17% | +4.77% | +18.12% |
| NLR | VanEck Uranium and Nuclear | 119.94 | +1.56% | +7.68% | -8.34% | -19.18% | -3.43% |
| IGV | iShares Expanded Tech-Software | 103.37 | -0.68% | +16.12% | +9.96% | +27.96% | -2.20% |
| AIQ | Global X - Artificial Intellig | 63.43 | -1.20% | +5.47% | +0.99% | +27.17% | +24.71% |
| CLOU | Global X - Cloud Computing | 28.05 | -1.30% | +21.06% | +22.65% | +48.18% | +24.01% |
| ESPO | VanEck Video Gaming and eSport | 98.33 | -1.45% | +9.82% | +10.36% | +5.82% | -5.10% |
| FDN | First Dow Jones Internet Index | 286.7 | -1.61% | +8.27% | +4.68% | +20.31% | +6.51% |
| DTCR | Global X - Data Center & Digit | 28.32 | -3.44% | -0.63% | -7.06% | +10.84% | +34.22% |
| GRID | First NASDAQ Clean Edge Smart | 180.93 | -3.69% | +0.25% | -6.01% | +2.91% | +18.24% |
| WTAI | WisdomTree Artificial Intellig | 41.18 | -4.43% | -0.51% | -1.06% | +36.90% | +41.32% |
| BOTZ | Global X - Robotics & Artifici | 36.04 | -4.50% | +3.30% | -10.55% | -7.64% | -0.52% |
| SNSR | Global X - Internet of Things | 47.25 | -4.55% | +0.71% | -6.20% | +17.26% | +27.85% |
| SMH | VanEck Semiconductor | 560.42 | -4.66% | -4.51% | -2.76% | +35.03% | +55.62% |
| CIBR | First Nasdaq Cybersecurity | 94.85 | -4.77% | +6.18% | +12.54% | +48.44% | +32.75% |
| QTUM | Defiance Quantum | 150.47 | -5.17% | +3.89% | -1.94% | +28.30% | +37.22% |
| SHLD | Global X - Defense Tech | 67.09 | -5.25% | +10.47% | +2.98% | -11.09% | +3.55% |
| SMHX | VanEck Fabless Semiconductor | 55.39 | -6.15% | -5.50% | -8.12% | +39.74% | +45.66% |
| XSD | S&P Semiconductor | 498.23 | -8.46% | -5.95% | -17.50% | +39.57% | +54.92% |
Sorted by Weighted Alpha (leaders → laggards) · Barchart, close of week.
The tech shelf — the year's winners did the most, downward. The sleeves this cohort lives in sorted the other way round from last week. The five green lines are what is not the AI stack: crypto equities +9.68% (with the coin), ARKK +6.30%, fintech +2.95%, lithium +1.83%, uranium +1.56%. The four that led seven days ago reversed — WTAI +4.69% became −4.43%, cloud +4.18% became −1.30%, data-centre REITs +3.60% became −3.44%, quantum +3.40% became −5.17% — and the semis were the worst of the board: XSD −8.46%, fabless −6.15%, SMH −4.66%, all still between +45% and +55% for 2026. Software, −0.68%, held — still −2.2% on the year, still the subject of this letter, and this week the half of tech that did not fall.
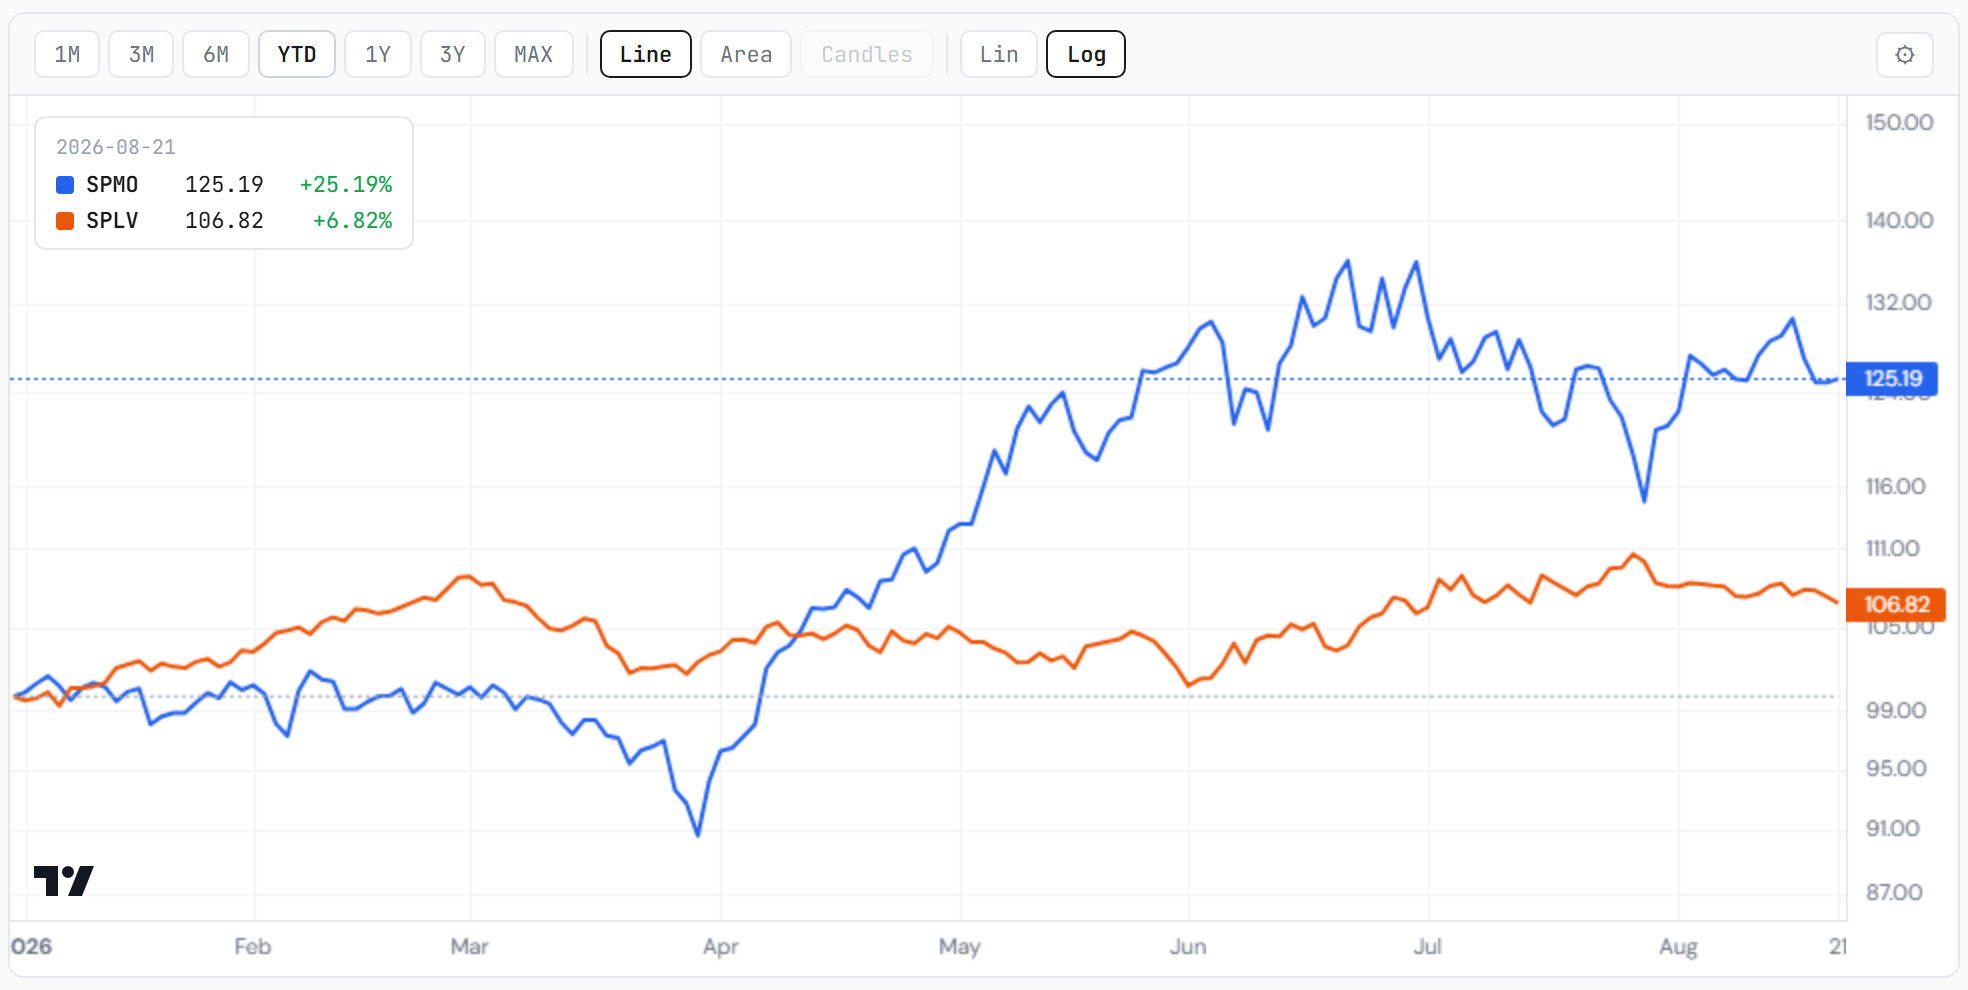
The factor view — the unwind the 95th percentile described. Last week this letter called momentum-over-low-volatility at the 94.6th percentile "both the tailwind and the risk" for this cohort, because hypergrowth is the highest-beta expression of that spread and gets sold to fund the reversal when it turns. It turned. The factor-regime gauge reads 92.3rd percentile, below its 50-day trend — indexed 156.83 against 158.27 — regime label momentum repair attempt below trend. The pair: the S&P Momentum ETF −2.99% on the week against the Low-Volatility ETF's −1.38%; over sixty days momentum is now −0.58% against low-vol's +2.35%. And the cohort was sold to fund it: four green names in ninety inside the capex index, three in thirty-one inside the operating layer. The equal-weight S&P lost only 0.49% against the index's 1.37% — the average stock held; the crowded corner did not.
A note before the ledger. The week's best names — the ten at the top of the family board — carry no AI thesis: a copper miner, a genomics company, an energy-drink maker, a uranium producer, a cosmetics brand, a restaurant, a language app. That is the subject of the new §4, after The Outlook. The ledger below is read with that in mind.
Our own board — the Rotation Ledger. The Directional Flow scan, read as of Thursday 20 August (Friday's scan had not reached the API at build time), counts 83 accelerating-up, 77 reversing-up, 159 decelerating-up, 77 flat and 33 accelerating-down across 429 instruments. Still broad by our own instrument — one in three building flow, one in thirteen losing it outright — but the decelerating-up bucket, the long warning, is the largest, and it grew.
But read the windows separately, because they say different things. The 21-day builds are still the residue of prints already scored — Atlassian +56.5, Duolingo +46.1, e.l.f. Beauty +43.5, Snowflake +42.8, Lenovo +42.1, Workday +38.1 — gaps that have already happened, carried forward. The five-day cut is the honest read of this week, and it says something this cohort should hear: Atlassian +19.0, freee +13.2, Appier +12.0, Elastic +11.7, Workday +11.6, e.l.f. +11.3, Lenovo +11.3, Duolingo +11.1 — software names and consumer names building flow from negative scores, in the week the semis were sold. The software-vs-semis yin and yang has not gone away inside the ledger; it has been demoted from the line that decides the index to a line inside one sector.
And the five-day bottom is unchanged in kind and worse in degree: Z.ai −28.2, KLA −20.3, Kioxia −15.1, SanDisk −13.2, EchoStar −12.8, Fluence −11.2, SK hynix −11.2 — the memory and equipment complex still draining, this week with its prices finally following. SK hynix announced the largest buyback in Korean history on Wednesday night and still sits in the bottom seven on five-day flow.
| Symbol | Bucket | DF | Δ5 | Δ21 | Flow |
|---|---|---|---|---|---|
| TEAM | AW40 | -38 | +19.0 | +56.5 | reversal ↑ |
| DUOL | AW40 | -59 | +11.1 | +46.1 | reversal ↑ |
| ELF | HALO | -29 | +11.3 | +43.5 | reversal ↑ |
| SNOW | AI-Opex | +40 | +10.2 | +42.8 | accel ↑ |
| 0992 | Rubin | +156 | +11.3 | +42.1 | accel ↑ |
| MNDY | AW40 | -86 | +9.3 | +39.5 | reversal ↑ |
| WDAY | AW40 | -49 | +11.6 | +38.1 | reversal ↑ |
| 3994 | AW40 | +23 | +9.6 | +36.7 | accel ↑ |
| 4478 | AW40 | -33 | +13.2 | +36.6 | reversal ↑ |
| SE | AW40·HALO | -40 | +9.4 | +36.2 | reversal ↑ |
| VEEV | AW40 | -30 | +10.3 | +35.2 | reversal ↑ |
| ESTC | AI-Opex | -19 | +11.7 | +34.9 | reversal ↑ |
| RBRK | AI-Opex | +29 | +10.5 | +33.8 | accel ↑ |
| AXON | HALO | -15 | +9.0 | +33.5 | reversal ↑ |
| PANW | AI-Opex | +99 | +7.2 | +32.4 | accel ↑ |
| ZS | AI-Opex | -77 | +9.8 | +31.6 | reversal ↑ |
| NOW | AW40 | +11 | +7.6 | +31.3 | accel ↑ |
| SAIL | AI-Opex | -25 | +8.8 | +31.0 | reversal ↑ |
| NOK | Rubin | +100 | -7.0 | -38.2 | decel ↑ |
| FORM | Rubin | +122 | -7.7 | -41.6 | decel ↑ |
| AMKR | Rubin | +84 | -9.1 | -42.2 | decel ↑ |
| AIXA | Rubin | +150 | -10.2 | -42.3 | decel ↑ |
| BE | Rubin | +128 | -9.2 | -43.4 | decel ↑ |
| ALB | HALO | +5 | -7.6 | -43.9 | decel ↑ |
| 5801 | Rubin | +213 | -8.6 | -44.3 | decel ↑ |
| FLNC | HALO | -25 | -11.2 | -46.0 | accel ↓ |
| 000660 | Rubin | +203 | -11.2 | -47.5 | decel ↑ |
| SATS | HALO | +82 | -12.8 | -49.1 | decel ↑ |
| LITE | Rubin | +165 | -9.6 | -49.9 | decel ↑ |
| AAOI | Rubin | +222 | -9.2 | -50.4 | decel ↑ |
| 042700 | Rubin | +84 | -10.4 | -55.6 | decel ↑ |
| POWL | Rubin | -131 | -3.0 | -61.8 | accel ↓ |
| 285A | Rubin | +313 | -15.1 | -68.4 | decel ↑ |
| SNDK | Rubin | +303 | -13.2 | -72.8 | decel ↑ |
| KLAC | Rubin | -282 | -20.3 | -105.2 | accel ↓ |
| 2513 | AI-Opex | +200 | -28.2 | -155.1 | decel ↑ |
Sorted by Weighted Alpha (leaders → laggards) · Barchart, close of week.
How Directional Flow works — for new readers
Level (trend strength). A weighted linear regression on log prices over the last 252 trading days, with recent days carrying heavier weight. The output is the annualised slope in percent: how strong and how persistent the trend is right now. Most stocks score below 100; only exceptional trends run far above it, and the score can be negative.
Flow (our leading layer). We compute that level not only today but also as it stood 5, 21 and 63 days ago. The difference is the leading indicator: positive means the trend is accelerating, negative means it is losing strength. Price usually reacts later.
Why the 21-day change matters. Price is the slowest signal. Trend strength is coincident. The change in trend strength is what leads. A stock making new highs while its 21-day change declines is decelerating — the move is getting tired. A stock still in a downtrend whose 21-day change is turning up is an early-chance setup.
Four flow states. 🟢🟢 Accelerating-Up · 🟢🟡 Decelerating-Up (long warning) · 🟡🟢 Reversing-Up (early chance) · 🔴🔴 Accelerating-Down. The middle two are the valuable ones — they arrive before the price move does.
Universe and cadence. Over 400 instruments — US headline indices, the 11 sector funds, Nasdaq sub-indices, country ETFs, tech thematics, the Closelook indices and all of their constituents. The scan runs on US trading days at 23:05 UTC, after the close. The full ranking is public at closelook.net/stocks/rankings/directional-flow/.
The four stock tables — this letter's own board. These are the tables the other two letters do not carry, because this is the only one that reads at name altitude. Every row comes from our own Directional Flow scan across more than 400 stocks, not from a vendor screen. This week's tables read as of the 20 August scan.
The strongest trends, confirmed on the medium term. Highest absolute score among names whose 21-day change is positive — established trends still improving. DuPont at 238 (+29.6 on the month — the materials name at the top of our whole board), Dell 200 (+26.3), Iridium 162, Lenovo 156 (+42.1), AMD 149. A high score means a steady, persistent trend rather than a fast one; most stocks sit below 100.
| Symbol | Name | Score | Score | 21-day | State |
|---|---|---|---|---|---|
| DD | DuPont | 238 | 238 | +29.6 | getting stronger |
| DELL | Dell Technologies | 200 | 200 | +26.3 | getting stronger |
| IRDM | Iridium | 162 | 162 | +1.9 | flat |
| 0992 | Lenovo Group | 156 | 156 | +42.1 | getting stronger |
| AMD | AMD | 149 | 149 | +1.8 | flat |
| 6488 | GlobalWafers | 149 | 149 | +1.1 | flat |
| BB | BlackBerry | 144 | 144 | +13.0 | getting stronger |
| ARM | ARM Holdings | 139 | 139 | +1.0 | flat |
| HPE | Hewlett Packard Enterprise | 133 | 133 | +25.4 | getting stronger |
| ALAB | Astera Labs | 129 | 129 | +15.7 | getting stronger |
| AMS | ams-OSRAM | 123 | 123 | +12.6 | getting stronger |
| FTNT | Fortinet | 111 | 111 | +18.6 | getting stronger |
| OVH | OVHcloud | 100 | 100 | +19.3 | getting stronger |
| OVH | OVHcloud | 100 | 100 | +19.3 | getting stronger |
| DDOG | Datadog | 99 | 99 | +21.9 | getting stronger |
| PANW | Palo Alto Networks | 99 | 99 | +32.4 | getting stronger |
| TWLO | Twilio | 94 | 94 | +7.1 | getting stronger |
| CRDO | Credo Technology | 90 | 90 | +13.1 | getting stronger |
| IFCN | INFICON | 86 | 86 | +1.2 | flat |
| CRWD | CrowdStrike | 86 | 86 | +24.8 | getting stronger |
| NTAP | NetApp | 81 | 81 | +28.6 | getting stronger |
| FROG | JFrog | 81 | 81 | +15.1 | getting stronger |
| OKTA | Okta | 78 | 78 | +29.1 | getting stronger |
| MYCR | Mycronic | 74 | 74 | +7.5 | getting stronger |
| ILMN | Illumina | 72 | 72 | +9.9 | getting stronger |
Sorted by Weighted Alpha (leaders → laggards) · Barchart, close of week.
The same list, confirmed on the short term. Where a name appears on this table and not the one above, the strength is fresh rather than established; where it appears on both, the trend is being added to at every horizon we measure. One row to read carefully: Aehr Test Systems at 223, flat on five days — while its price fell 24% this week, the family's worst name. A 252-day regression does not see a one-week crash immediately; the score lags the price on the way down, which is exactly why the change columns, not the level, are the leading layer.
| Symbol | Name | Score | 5-day | 21-day | State |
|---|---|---|---|---|---|
| 0992 | Lenovo Group | 156 | +11.3 | +42.1 | getting stronger |
| PANW | Palo Alto Networks | 99 | +7.2 | +32.4 | getting stronger |
| NTAP | NetApp | 81 | +7.1 | +28.6 | getting stronger |
| HPE | Hewlett Packard Enterprise | 133 | +6.0 | +25.4 | getting stronger |
| OKTA | Okta | 78 | +5.3 | +29.1 | getting stronger |
| CRWD | CrowdStrike | 86 | +5.2 | +24.8 | getting stronger |
| DELL | Dell Technologies | 200 | +5.0 | +26.3 | getting stronger |
| OVH | OVHcloud | 100 | +4.7 | +19.3 | getting stronger |
| OVH | OVHcloud | 100 | +4.7 | +19.3 | getting stronger |
| FROG | JFrog | 81 | +4.7 | +15.1 | getting stronger |
| CRDO | Credo Technology | 90 | +4.2 | +13.1 | getting stronger |
| DDOG | Datadog | 99 | +3.1 | +21.9 | getting stronger |
| AEHR | Aehr Test Systems | 223 | +3.0 | -0.8 | flat |
| AMS | ams-OSRAM | 123 | +2.8 | +12.6 | getting stronger |
| NBIS | Nebius | 139 | +2.6 | -2.4 | losing force |
| FTNT | Fortinet | 111 | +2.6 | +18.6 | getting stronger |
| ALAB | Astera Labs | 129 | +2.3 | +15.7 | getting stronger |
| TWLO | Twilio | 94 | +2.2 | +7.1 | getting stronger |
| DD | DuPont | 238 | +2.0 | +29.6 | getting stronger |
| BB | BlackBerry | 144 | +1.6 | +13.0 | getting stronger |
| M7U | Nynomic | 95 | +1.6 | -2.3 | losing force |
| 6488 | GlobalWafers | 149 | +1.1 | +1.1 | flat |
| MYCR | Mycronic | 74 | +0.9 | +7.5 | getting stronger |
| MRVL | Marvell Technology | 171 | +0.4 | -3.9 | losing force |
| 6857 | Advantest | 75 | +0.3 | -9.6 | losing force |
Sorted by Weighted Alpha (leaders → laggards) · Barchart, close of week.
Where new leadership shows up first — the fastest risers. Ranked by five-day change in the score rather than by the score itself: Atlassian +19.0 (score −38), freee +13.2, Appier +12.0, Elastic +11.7, Workday +11.6 (−49), e.l.f. +11.3 (−29), Duolingo +11.1 (−59). Weak trends improving fast — the engine's historical address for leadership before the price board shows it — and this week the list is software plus consumer, without a chip or a tool on it.
| Symbol | Name | Score | 5-day | 21-day | State |
|---|---|---|---|---|---|
| TEAM | Atlassian | -38 | +19.0 | +56.5 | turning up |
| 4478 | freee | -33 | +13.2 | +36.6 | turning up |
| 4180 | Appier | -33 | +12.0 | +30.6 | turning up |
| ESTC | Elastic | -19 | +11.7 | +34.9 | turning up |
| WDAY | Workday | -49 | +11.6 | +38.1 | turning up |
| ELF | e.l.f. Beauty | -29 | +11.3 | +43.5 | turning up |
| 0992 | Lenovo Group | 156 | +11.3 | +42.1 | getting stronger |
| DUOL | Duolingo | -59 | +11.1 | +46.1 | turning up |
| RBRK | Rubrik | 29 | +10.5 | +33.8 | getting stronger |
| P | Everpure | 16 | +10.4 | +23.0 | getting stronger |
| VEEV | Veeva | -30 | +10.3 | +35.2 | turning up |
| SNOW | Snowflake | 40 | +10.2 | +42.8 | getting stronger |
| ZS | Zscaler | -77 | +9.8 | +31.6 | turning up |
| 3994 | Money Forward | 23 | +9.6 | +36.7 | getting stronger |
| SE | Sea Limited | -40 | +9.4 | +36.2 | turning up |
| MNDY | monday.com | -86 | +9.3 | +39.5 | turning up |
| AXON | Axon Enterprise | -15 | +9.0 | +33.5 | turning up |
| SAIL | SailPoint | -25 | +8.8 | +31.0 | turning up |
| PATH | UiPath | -21 | +8.0 | +21.8 | turning up |
| NOW | ServiceNow | 11 | +7.6 | +31.3 | getting stronger |
| TOST | Toast | -20 | +7.5 | +30.4 | turning up |
| SAP | SAP | -49 | +7.5 | +23.8 | turning up |
| SAP | SAP | -43 | +7.4 | +24.0 | turning up |
| S | SentinelOne | 35 | +7.2 | +28.1 | getting stronger |
| PANW | Palo Alto Networks | 99 | +7.2 | +32.4 | getting stronger |
Sorted by Weighted Alpha (leaders → laggards) · Barchart, close of week.
And the draining side. The same measure inverted: Z.ai −28.2, KLA −20.3, Kioxia −15.1, SanDisk −13.2, EchoStar −12.8, Fluence −11.2, SK hynix −11.2, Hanmi −10.4. Kioxia and SanDisk still carry scores above 300 — among the highest in the universe — while losing force faster than almost anything else. Last week this was "a strong trend being drained, price not yet following". This week the price followed: SanDisk −2.7%, Western Digital −9.7%, storage −4.2% after the prior week's +21%. KLA is the one in outright acceleration-down, at −282.
| Symbol | Name | Score | 5-day | 21-day | State |
|---|---|---|---|---|---|
| 005930 | Samsung Electronics | 149 | -7.2 | -37.2 | losing force |
| MKSI | MKS Instruments | 113 | -7.3 | -29.3 | losing force |
| DOCN | DigitalOcean | 177 | -7.4 | -28.6 | losing force |
| NVMI | Nova Ltd | 38 | -7.5 | -32.8 | losing force |
| ALB | Albemarle | 5 | -7.6 | -43.9 | losing force |
| FORM | FormFactor | 122 | -7.7 | -41.6 | losing force |
| ARRY | Array Technologies | -63 | -7.8 | -33.0 | getting weaker |
| GFS | GlobalFoundries | 82 | -8.4 | -34.6 | losing force |
| COHR | Coherent | 114 | -8.5 | -37.6 | losing force |
| 5801 | Furukawa Electric | 213 | -8.6 | -44.3 | losing force |
| 6920 | Lasertec | 76 | -8.7 | -30.4 | losing force |
| WDC | Western Digital | 191 | -8.8 | -35.6 | losing force |
| AMKR | Amkor Technology | 84 | -9.1 | -42.2 | losing force |
| AAOI | Applied Optoelectronics | 222 | -9.2 | -50.4 | losing force |
| BE | Bloom Energy | 128 | -9.2 | -43.4 | losing force |
| LITE | Lumentum | 165 | -9.6 | -49.9 | losing force |
| AIXA | Aixtron | 150 | -10.2 | -42.3 | losing force |
| 042700 | Hanmi Semiconductor | 84 | -10.4 | -55.6 | losing force |
| FLNC | Fluence Energy | -25 | -11.2 | -46.0 | getting weaker |
| 000660 | SK hynix | 203 | -11.2 | -47.5 | losing force |
| SATS | EchoStar | 82 | -12.8 | -49.1 | losing force |
| SNDK | SanDisk | 303 | -13.2 | -72.8 | losing force |
| 285A | Kioxia | 313 | -15.1 | -68.4 | losing force |
| KLAC | KLA Corp | -282 | -20.3 | -105.2 | getting weaker |
| 2513 | Zhipu AI / Z.ai | 200 | -28.2 | -155.1 | losing force |
Sorted by Weighted Alpha (leaders → laggards) · Barchart, close of week.
2 · The State
The four buckets, briefly. New readers: we cut the growth trade into functional indices rather than sectors — capex (Rubin Build-Out, what gets built), opex (Agentic Ecosystem, what it costs to run), applications (Agentic Winners, what gets sold on top), and HALO as the control group carrying no AI thesis at all.
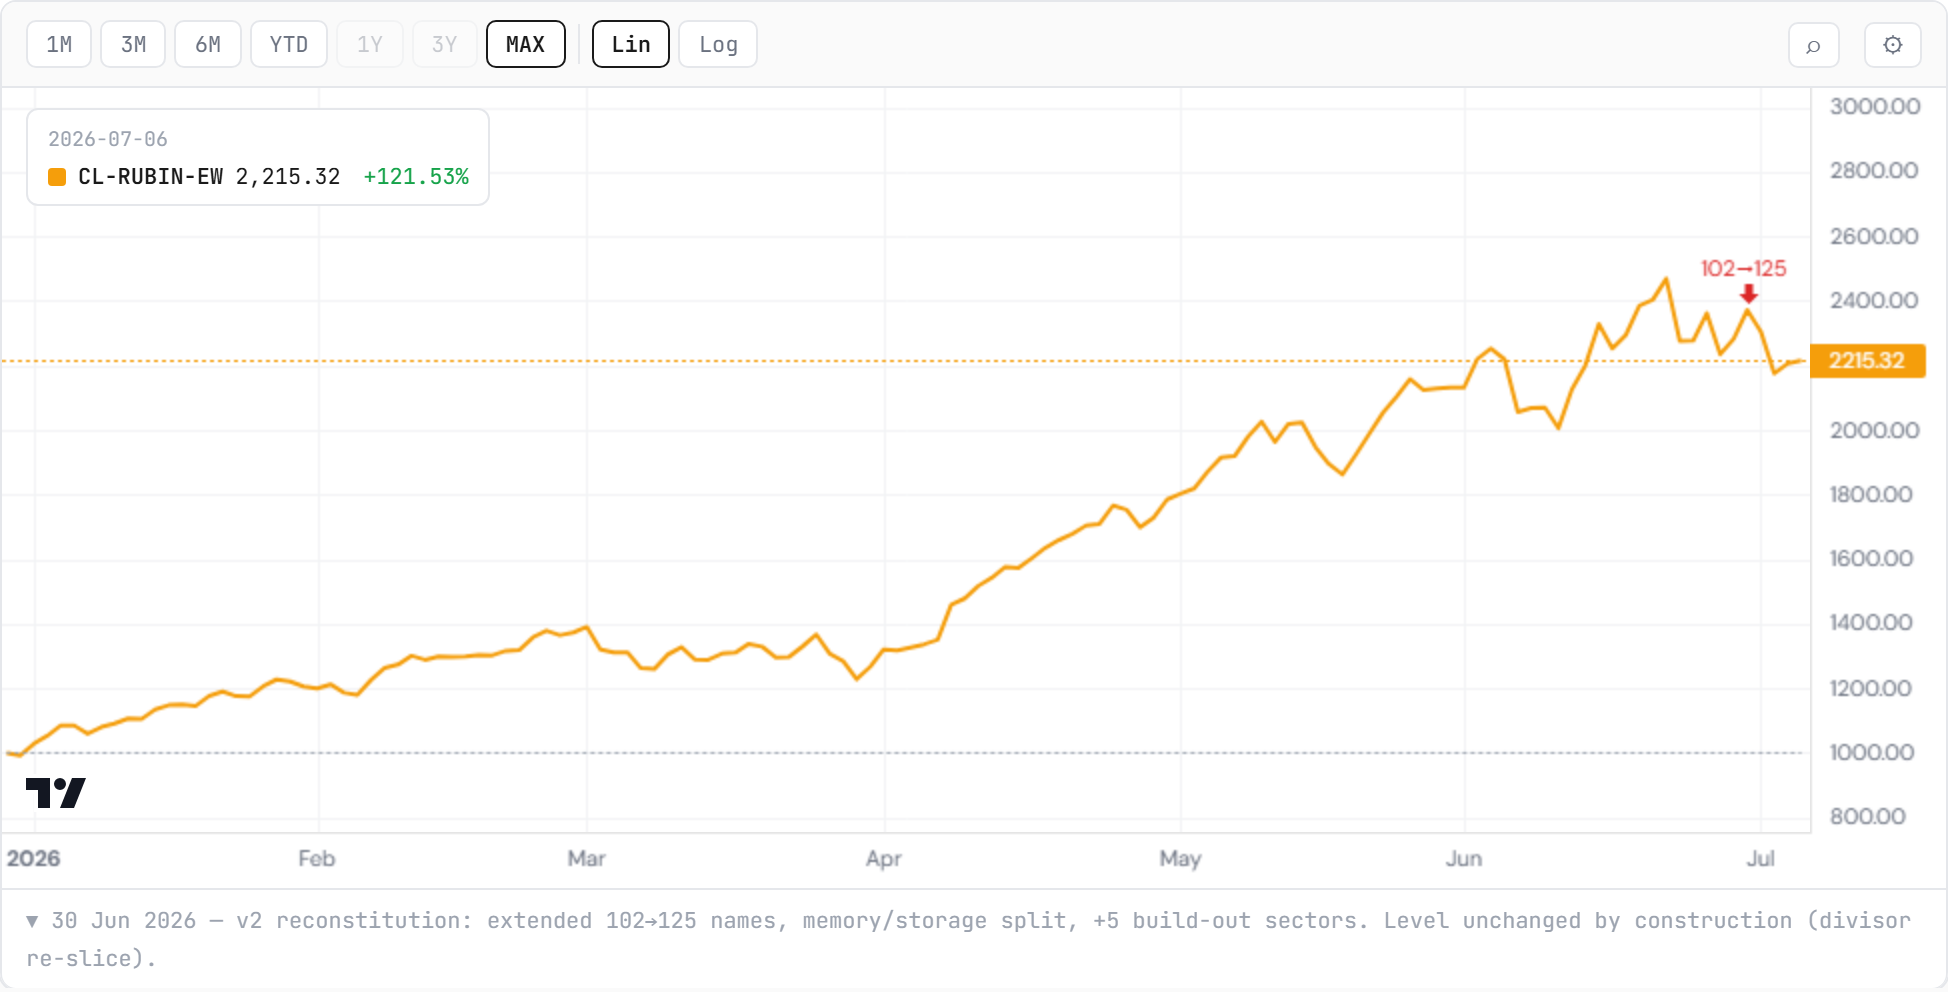
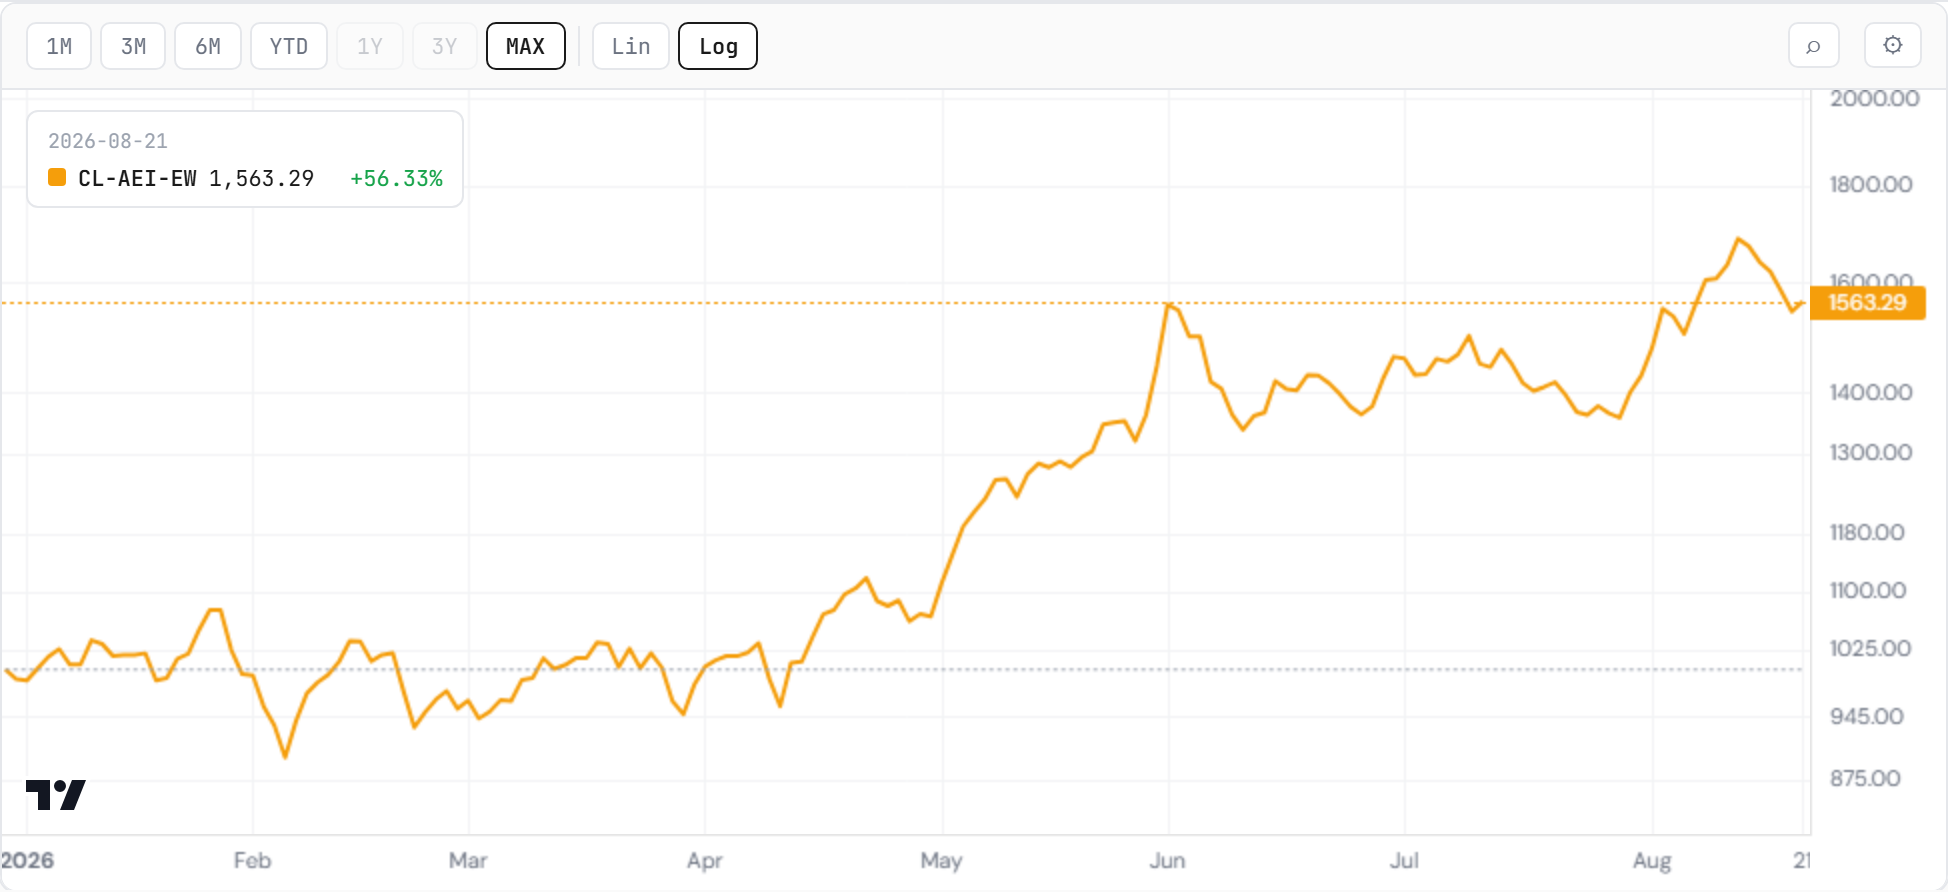
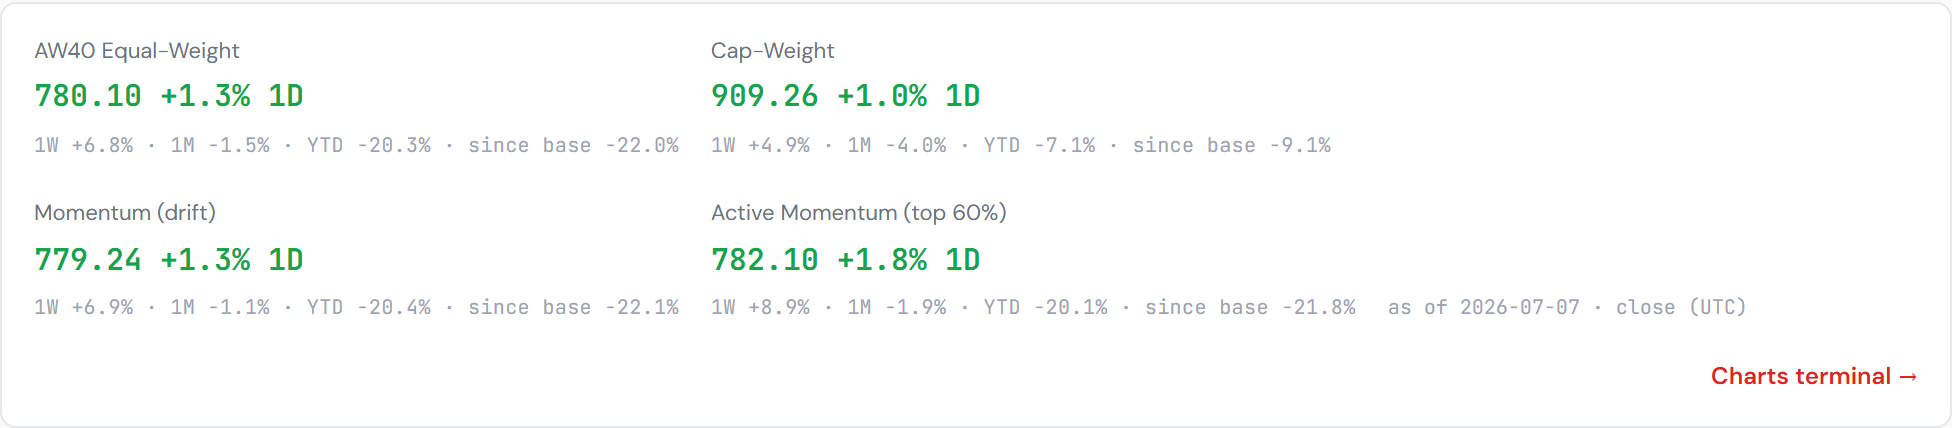
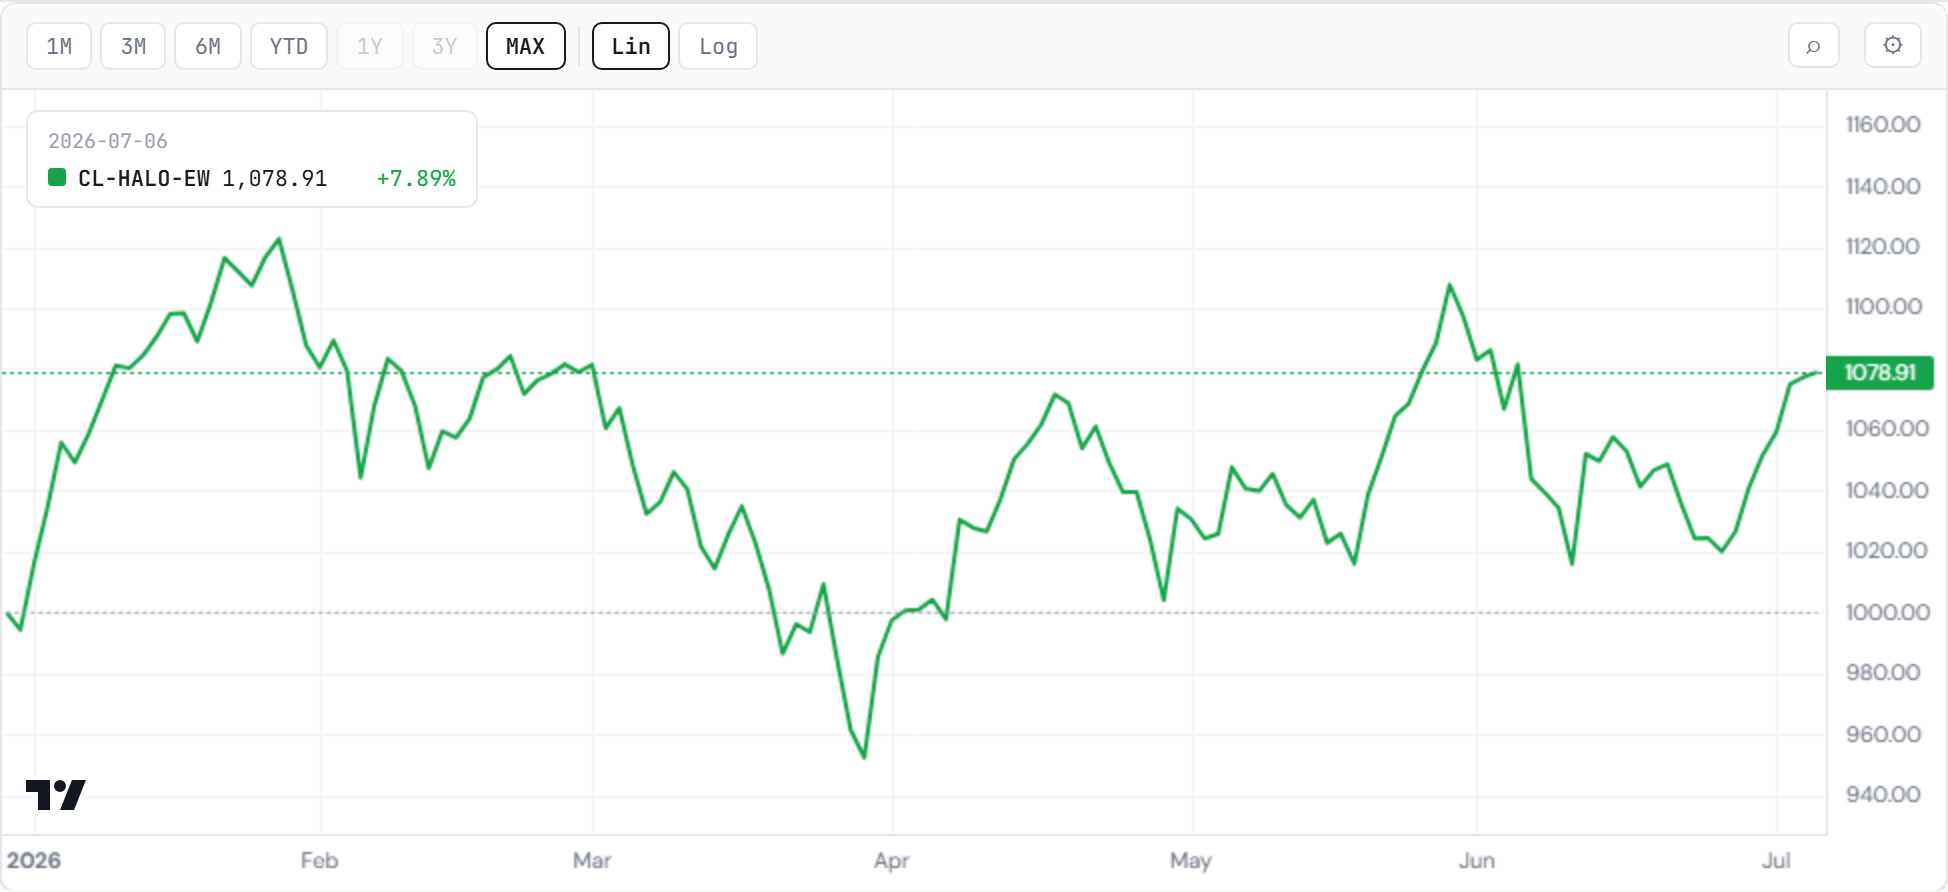
The week's ladder: applications +2.7%, HALO 0.0%, opex −6.5%, capex −7.3%. On the year: capex +90.5%, opex +58.4%, applications −4.6%, HALO +8.4%; Euro-AI −3.5% on the week, +31.7% on its year. The lightest layer led for a second week; the two heavy layers gave back more than a third of their recovery off the July lows; the buildout still owns the year by a distance.
The control group settles what kind of week it was. HALO closed flat against opex −6.5% and capex −7.3%. Growth was not sold this week — AI was. That is the mirror of last week's "growth was not bid, AI was", and for this cohort it is the more important of the two readings: the thing that gets bought by mistake in broad risk-on weeks is also the thing that gets sold first in an AI de-risking, and HALO, the index with no AI thesis, was the only one left standing.
Two floors were re-tested, and this time the results floor was the one that broke.
The challenger floor gave way. Last week the neocloud payments held through day three and Nebius added 8.8% on top; this letter asked whether retention would survive a third week and called the falsifier mechanical — "payments that survive a week and die in the third". It died in the second. Nebius −21.1% to 219.13, below every close since its print; CoreWeave −16.5% to 87.85; Fastly, last week's fourth-best name at +30.4%, −16.6%. The payment is gone, and with it the season's one exhibit of a paid print that was kept.
The incumbent floor held. Workday, the takeout floor built on a reported conversation, traded down to 190.64 on Tuesday and closed the week at 200.01, +0.7% — above where it gave back a third of the spike a week ago. Silver Lake's talks are still talks, at a reported valuation near $43 billion, nothing signed and no comment from either side. So the asymmetry this letter described reversed: the floor built on results deflated, the floor built on a cheque held. Both remain evidence the disruption discount overshot. This week only the cheque could be scored, and it scored.
Inside the buckets — the sub-sleeves put names on the week. Inside applications: Application Leaders +6.05%, Enterprise +4.11%, Control Plane +2.81% — the three most negative sleeves on the year led the week — while Endpoints −0.55%, Consumer −0.88% and Megacap Gateway −2.47%, the only sleeve positive for 2026, red for a second week. The layer bought again what it sold all year and sold again the one thing it owned.
Inside opex the names that made 2026 led the way down: Foundation Models −11.02% against +753% on the year, Substrate −9.29%, Edge −9.22%, Compute Operators −9.19%, Runtime −8.25%; the best sleeve was operations and observability at −3.70%. Inside capex one sleeve was green of twenty-four — HBM Memory +3.78%, the week SK hynix announced its buyback — and the fab floor was the bottom: wafer processing −11.25%, testing and metrology −10.66%, foundry −10.35%.
And read the buckets against their highs — the focus change, revised. Last week: opex 7.3% above its June record, applications 5.6% through theirs, the buildout 13.7% below June. This week: the Agentic Ecosystem set a new high last Thursday, the 13th, and is now 7.3% below it; the Agentic Winners are still above their summer high and 7.4% below January's; the Rubin Build-Out is 21.0% below June. The two lighter layers' distance from their records is now measured in the other direction for one of them. The focus change is intact — the lightest layer is still the one nearest its high and the only one that rose — but the operating layer spent the week closer to the buildout than to the applications.
The opex verdict at name altitude — software built flow while the tape sold AI. The flow ledger puts the operating and application layer's software names at the top of the board again: Snowflake +42.8 on 21-day flow, accelerating-up, and +1.2% on the week in a tape that fell; Atlassian +56.5 and +19.0 on five days, Workday +38.1 and +11.6, Elastic reversing up — while the semis and the memory complex drained. Cybersecurity, the sleeve this letter keeps naming as the opex category where the biggest-customer-becomes-competitor threat structurally does not apply, fell 4.77% with the rest of the layer: the logic held, the price did not, and it stays a watch rather than a buy until the layer stops bleeding.
The referee this week was the retention window, and it failed. Last edition named the neocloud prints the referee for the cohort and scored the first week a pass. The second week was the fail: both payments gone inside five sessions, the cluster sold on every day but one. The season's rule — paid prints die — reasserted itself on the two names that had seemed to escape it.
The structural read — the count retreated, not voided. The US letter carries the contract; here it matters as the gate on everything above. QQQ lost 723.85 on Tuesday and closed 713.44 — its 50-day average to the cent; 746 is still the confirmation and 694 the kill-switch, 4.4% above and 2.7% below. Neither line traded. The long-term count is unchanged from last week: no invalidation.
The structural read — applications still above their summer high; the buildout further from June. The lows tell it earlier still: capex and opex are +14.7% and +15.2% off their 29 July lows (from +23.6% and +23.1% a week ago); applications is +26.4% off its 23 July low (from +31.2%) — the smallest give-back of the three, in the index that refused the others' later low. Probability, not prophecy — the candidate is still the candidate.
3 · The Outlook
The tells from last edition — scored.
- Challenger retention, third week — failed in the second: Nebius −21.1%, CoreWeave −16.5%. Scored no.
- The software floor — whether the takeout conversation becomes a deal. Still talks; the floor held at 200.01 through a −2.4% index week. Scored partially, again provisionally.
- MAGS at the shelf, attempt three — attempt four failed too: 67.28, −1.44%, 3.2% below 69.5. Detail in §5.
The watch-class from last week — resolved, by price coming down to flow. This letter's reading of the week before was that storage led the capex price board at +21.1% while its two largest names sat at the bottom of the flow ledger, and that "a sector cannot lead the price board and trail the flow board indefinitely — one of the two is early". The flow was early. Storage −4.16% this week, SanDisk −2.7%, Western Digital −9.7%, Micron −0.5%; Kioxia and SanDisk still at the bottom of the five-day flow table, SK hynix with them despite a forty-trillion-won buyback. The instrument did what it was built for: it filed the memory strength as a move to be respected rather than chased, and the week respected it. The one green line in the whole capex table was HBM Memory, +3.78% — the sleeve the buyback landed in.
The regime gauges, one paragraph. The Handoff Board jumped two rungs in a week: use-against-operate +11.3% to 1.2076, use-against-build +9.0% to 1.5293, beyond-gateways +5.2% — the applications pulling away from both the operators and the builders at once — while operate-against-build fell 2.1%: the operating layer fell faster than the buildout it runs on. The Money Temperature composite reads 53, two points warmer, still the middle of its range; the house inflation composite reads 49, contained, while the 30-year sat at 5.275% — the long end is pricing supply, not inflation.

The week ahead — one print, one speech. Walmart completes its scoring window on Tuesday; Nvidia prints Wednesday after the close — consensus $2.09 on $92.0 billion — into a semis tape that lost between 4.7% and 8.5% this week; Jackson Hole runs Thursday to Saturday with Warsh's first keynote as chair on Friday. For this cohort the referee is Wednesday, and the tape arrives already leaning.
4 · Growth With No Tech Inside — the second pillar
Why this section exists, from this week on. For most of the year the line that decided this cohort ran through technology: software against semis, one half paid and the other charged. This week the line that decided the index ran around technology — and the names that led the family board were not in the AI complex at all. Thomas's framing, which this letter adopts as its standing second pillar: the axis has turned from software-versus-semis to tech-versus-everything-else; the year still belongs to tech, but the month and the quarter are going to growth with no AI exposure — plus 2025's stars, gold and bitcoin, alongside the industrial commodities and materials, usually with a weaker dollar. Probability, not prophecy. This section measures it the same way every week.
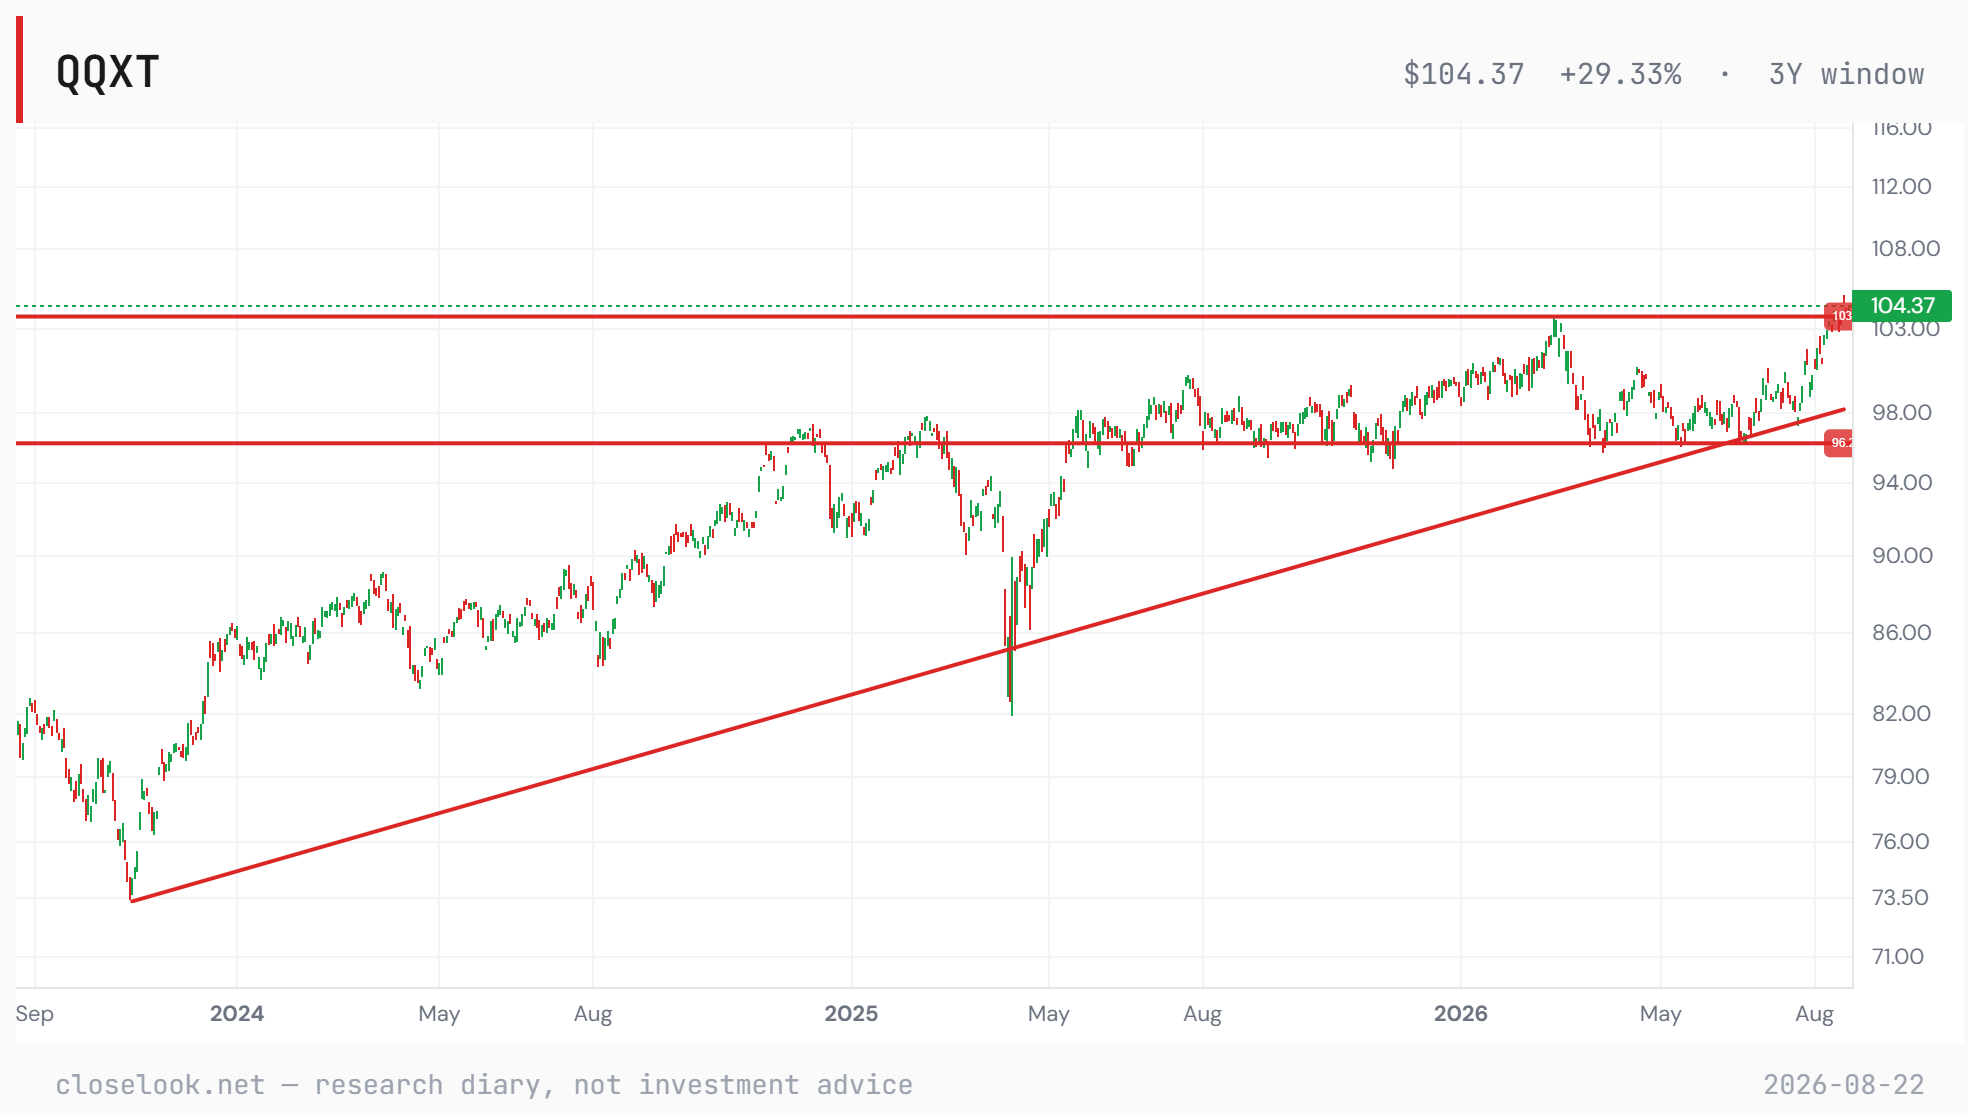
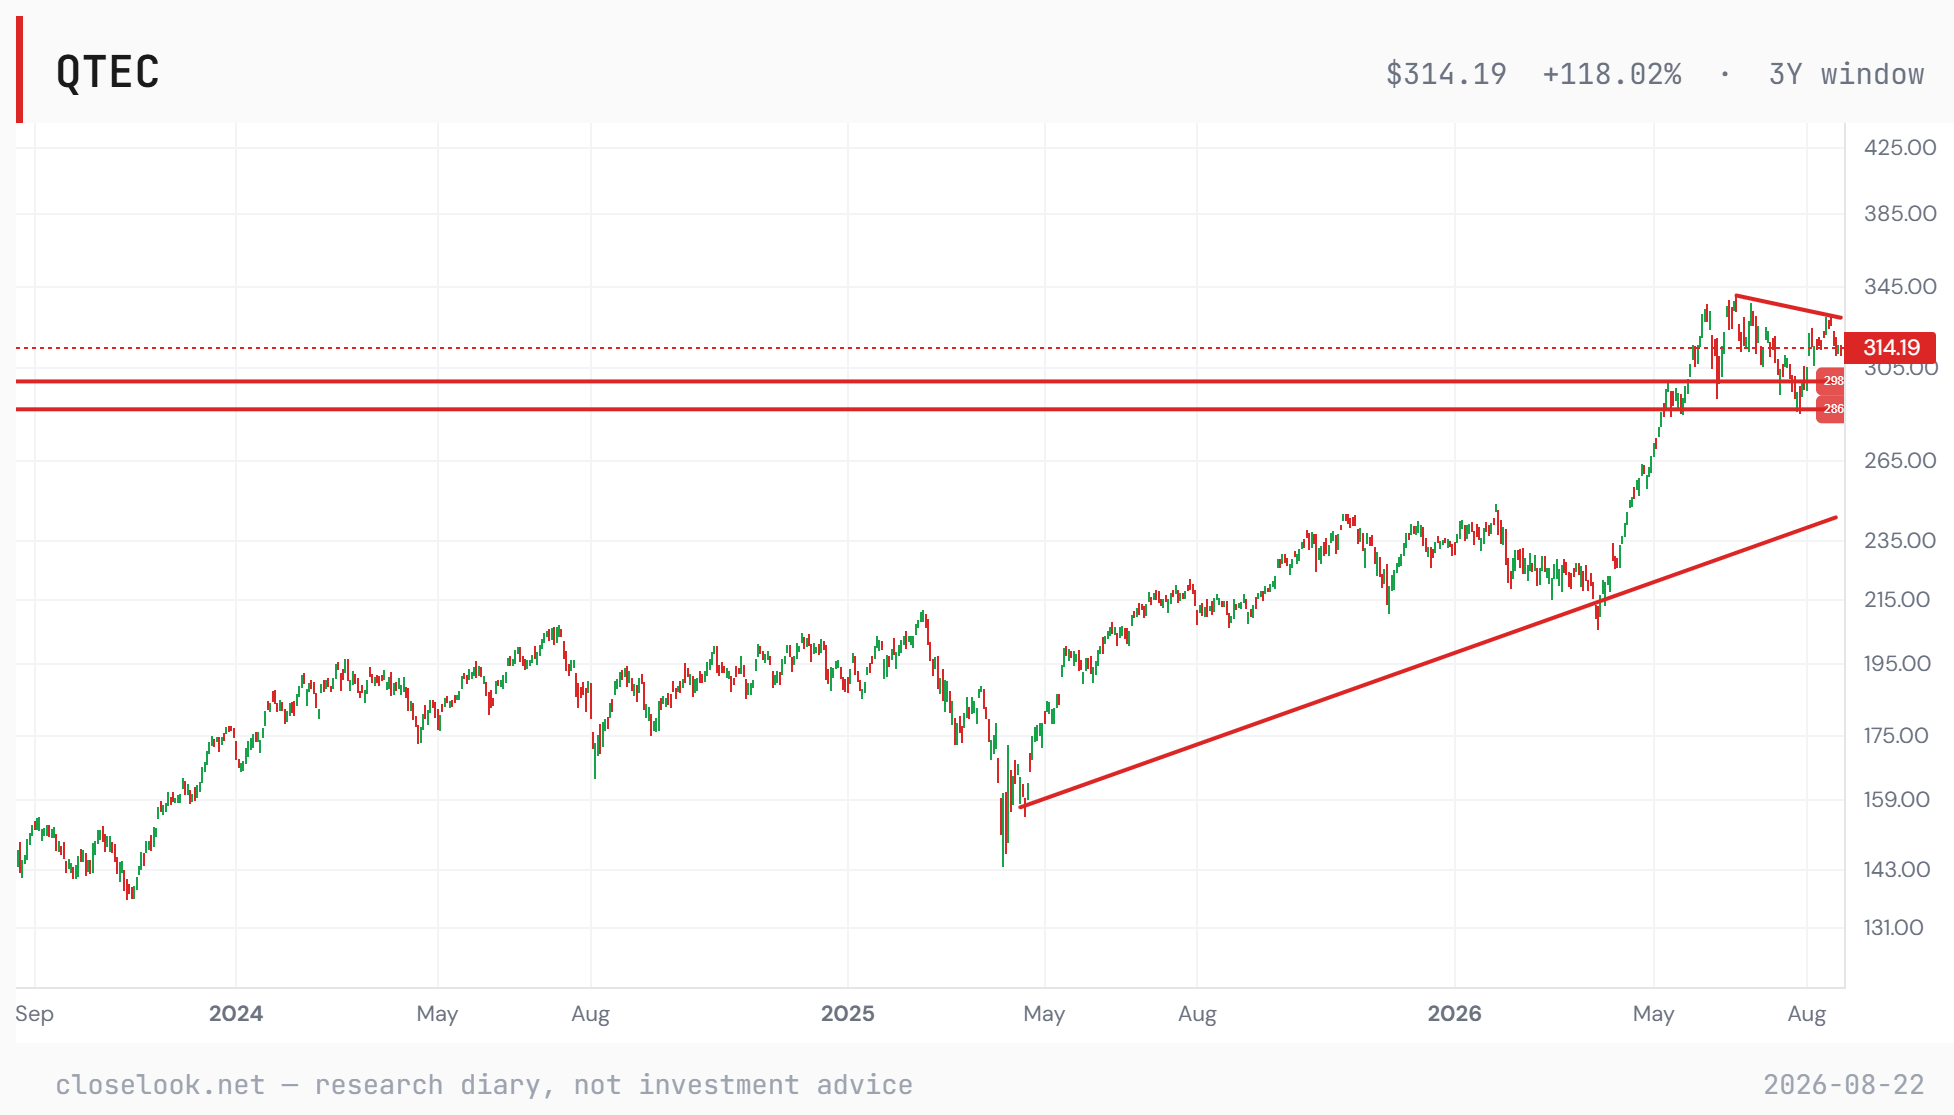
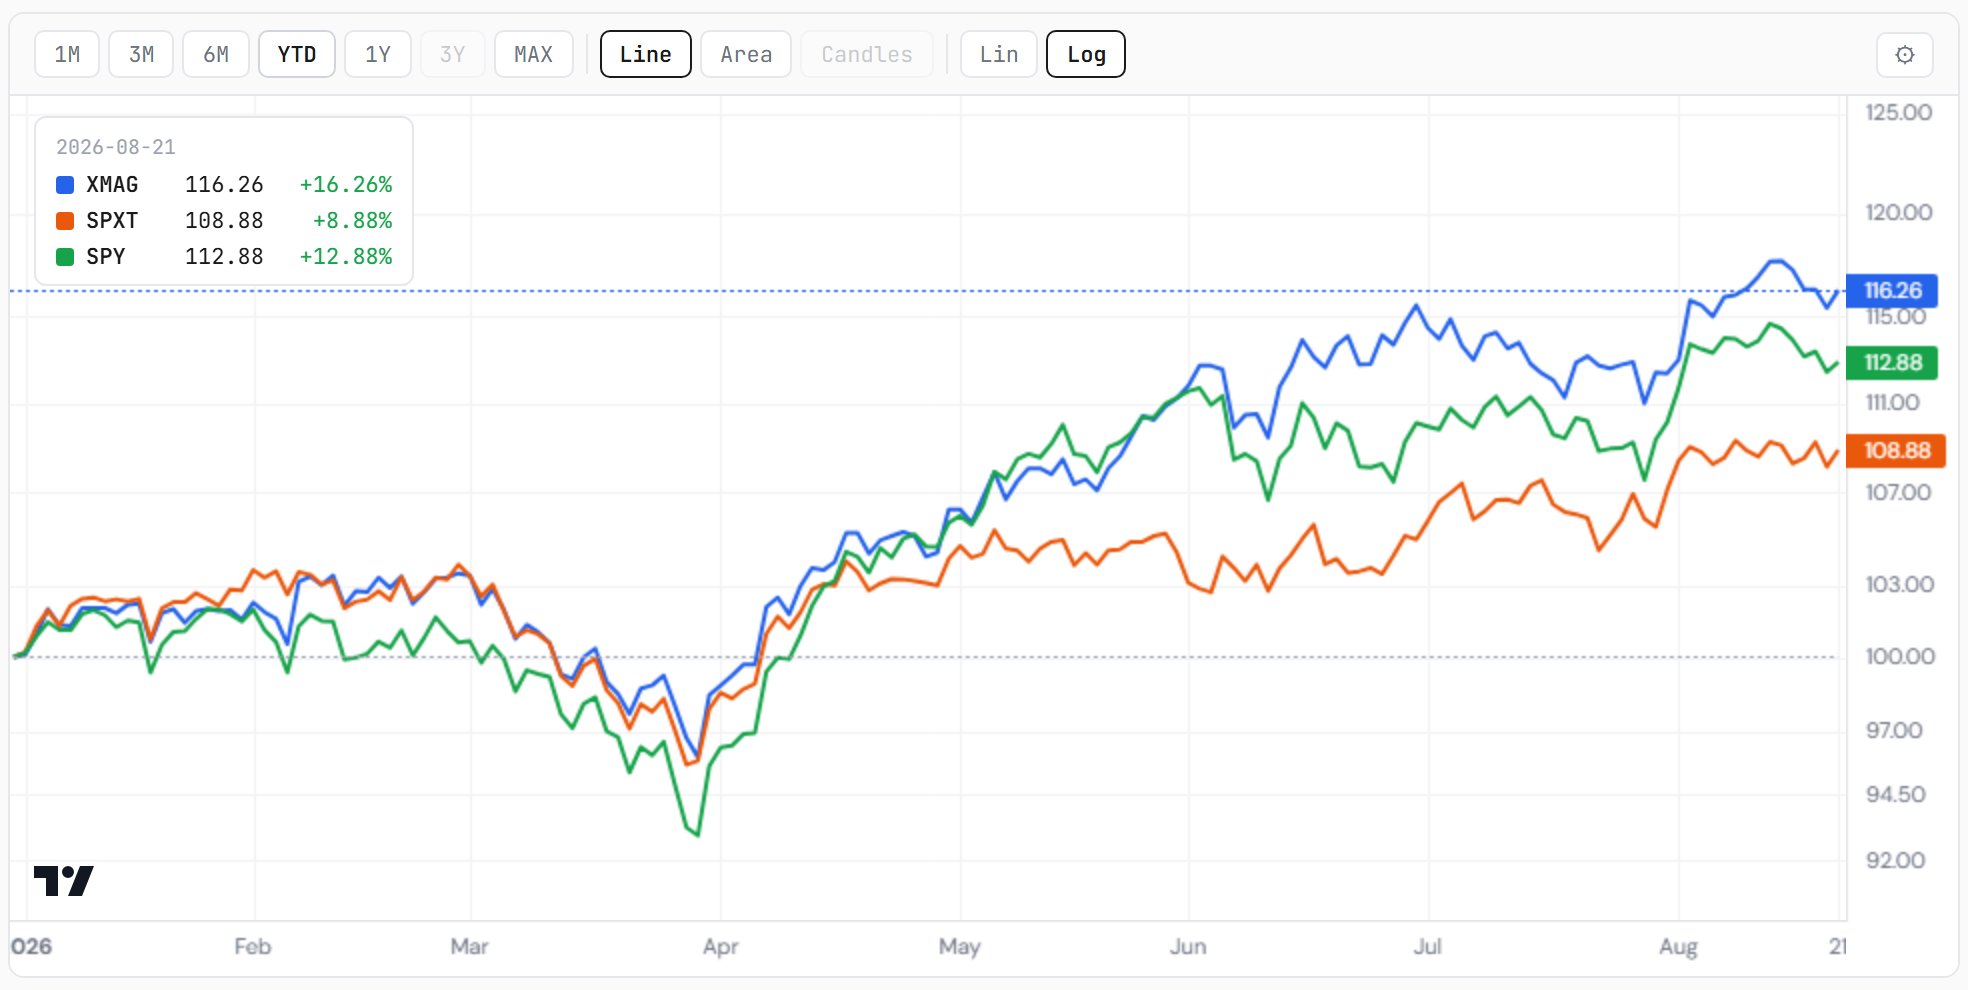
The index proof. The Nasdaq 100 ex-technology closed at 104.37, +0.49% on the week, at a three-year high, through the 103 shelf that had capped it since February. Its tech sleeve closed 314.19, −3.82%, 6.4% below its June high and under a descending line drawn from it. The windows: ex-tech +6.0% on the month and +6.0% on the quarter against the Nasdaq 100's +0.6% and −0.1%; on the year the Nasdaq 100 still leads, +16.1% against +5.0%. Trailing on the year, leading on every shorter window — that is what a rotation looks like while it is happening, before the year-to-date number admits it. The S&P ex-tech tells the same story at lower amplitude: +2.7% and +3.8% against +2.3% and +3.1%.
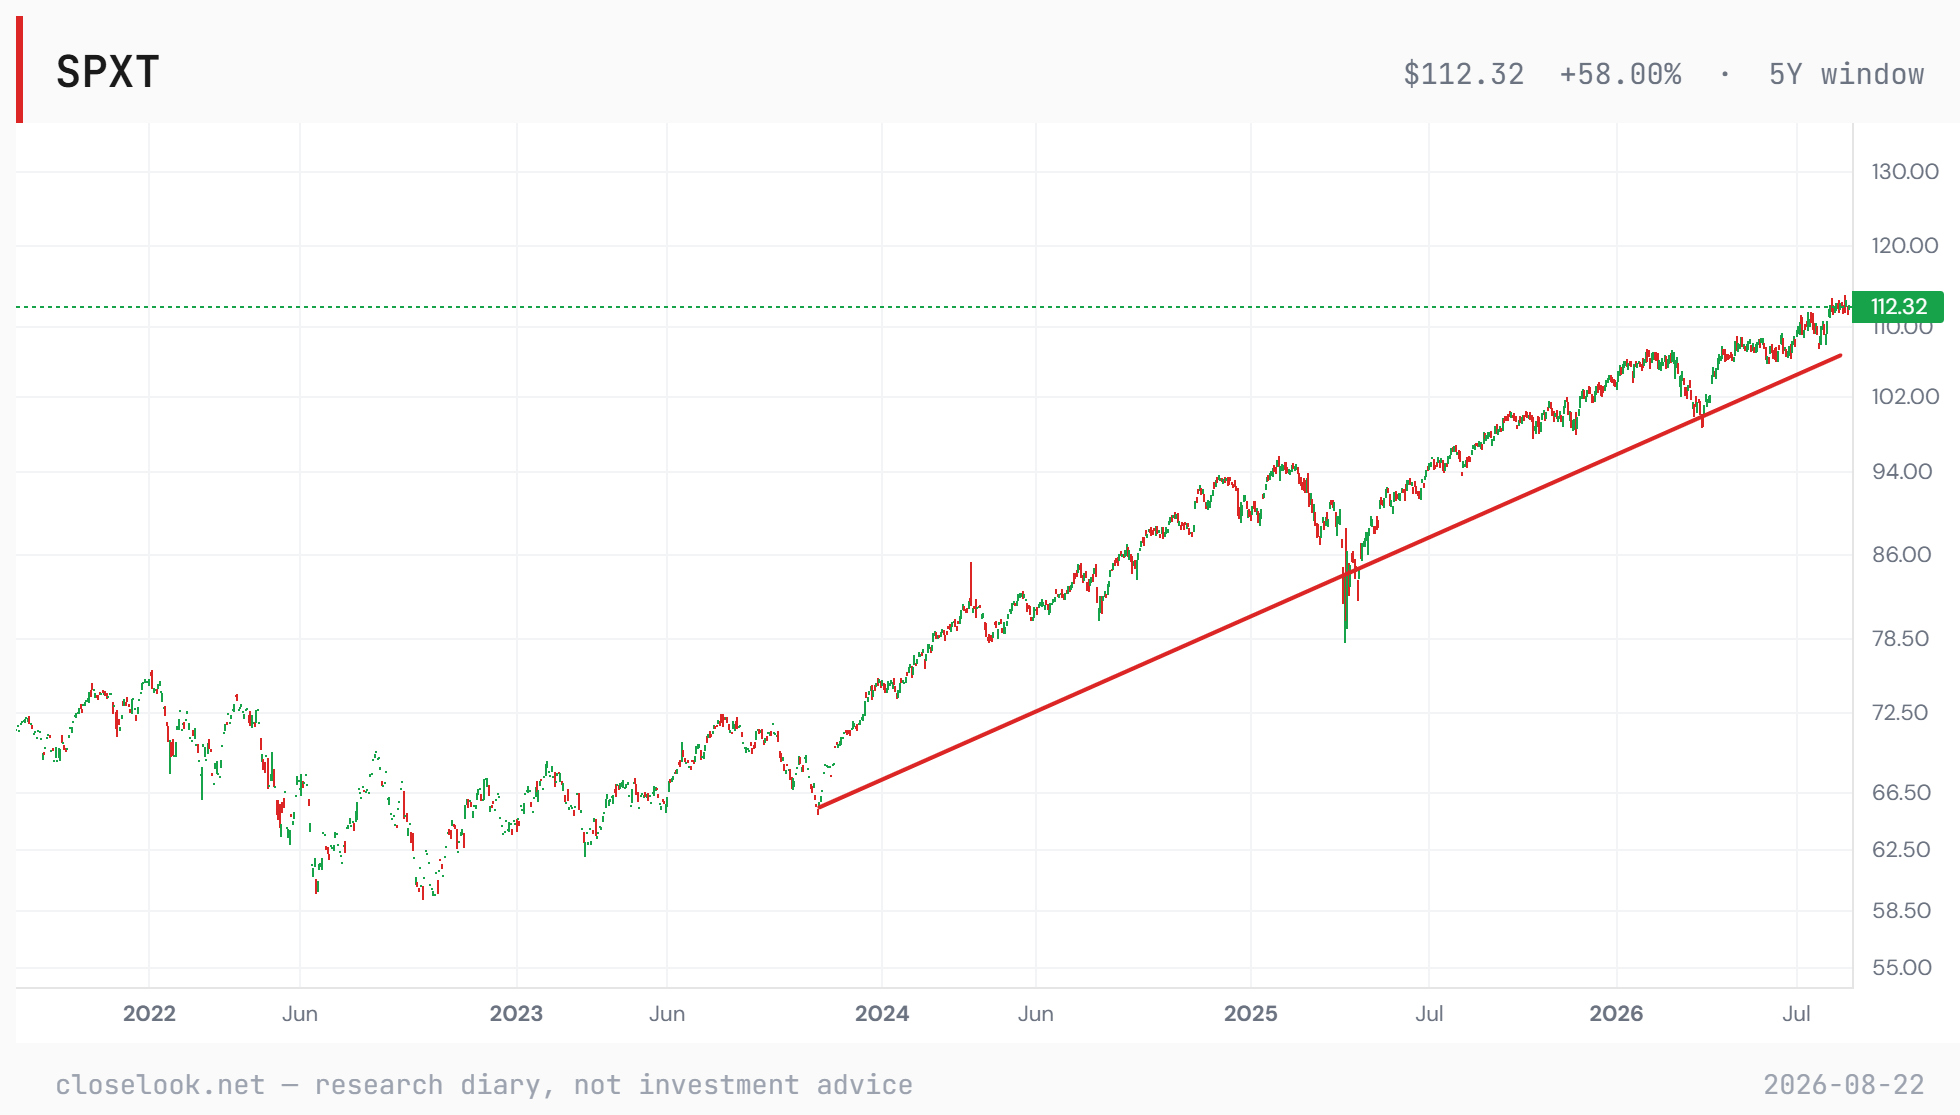
The S&P version of the same chart. The S&P 500 ex-technology closed at 112.32, −0.20% on the week against the S&P's −1.37%, +2.7% on the month against +2.3%, +3.8% on the quarter against +3.1%, and +8.1% on the year against +12.3% — the same signature, lower amplitude: trailing on the year, leading on every shorter window.
And the cut that is not ex-tech at all — ex-Magnificent-7. One more instrument belongs on this page, and it has to be read precisely: the S&P 500 ex-Magnificent 7 fund strips out the seven largest names and keeps the rest of technology — semis, software, everything below the top seven. It closed at 26.24, −1.20% on the week against the S&P's −1.37%, +3.0% on the month against +2.3%, +7.0% on the quarter against +3.1% — and +16.3% on the year against the S&P's +12.3%. The S&P without its seven largest names has beaten the S&P all year. Put the three side by side and the year's structure is visible: ex-Mag-7 +16.3%, the S&P +12.3%, ex-tech +8.1%. The year belonged to technology below the top seven — the semis and the buildout — not to the seven themselves; the month and the quarter belong to growth outside technology altogether. Two different sentences, both true, and the instruments to keep them apart are now all on one chart.
The control group, read as a pillar. HALO — the house's growth index carrying no AI thesis — closed the week flat against the AI indices' −6.5% and −7.3%, with 48 of its 89 constituents green against four of ninety in the buildout. Its leading sleeves were Longevity & Healthspan +5.53%, Circular Economy +3.61%, Better Food +3.02%, Nuclear & Uranium +2.80%, Payments +2.05%; its losers were the AI-adjacent ones — Space & Satellite −8.02%, Autonomous Defense & Drones −7.01%, Energy Transition −6.41%. HALO is now the house expression of this pillar, and this letter will read it that way.
The names. The family's best week, by name: Tempus AI +39.5%, Freeport-McMoRan +15.3%, Illumina +14.9%, Celsius +14.7%, Uranium Energy +13.8%, e.l.f. Beauty +11.5%, Chipotle +10.1%, Duolingo +10.0%, Ivanhoe Mines +8.4%, Vertex +8.4% — a copper miner, a genomics company, an energy-drink maker, a uranium producer, a cosmetics brand, a restaurant, a language app, a biotech. Nine of ten are HALO or application names; none is a chip, a tool or a cloud. And the flow ledger agrees on timing: e.l.f. +43.5 on 21-day flow, Duolingo +46.1, both reversing up from negative scores — the engine's address for leadership before the price board shows it.
Two things Thomas would add, and this letter does. First: the best-performing stock in the S&P 500 over the long run — by the commonly cited multi-decade tallies — is not a technology company. It is Monster Beverage, an energy-drink maker. Growth with no tech inside is not a consolation category; it is where the index's single best compounder came from. Second: application- or consumer-oriented global disruptors tend to perform exceptionally well, and there are only a handful of them at any time — which is why this pillar reads names rather than sectors, and why Celsius, e.l.f., Duolingo and Chipotle appearing on one week's list together is the kind of thing it exists to notice.
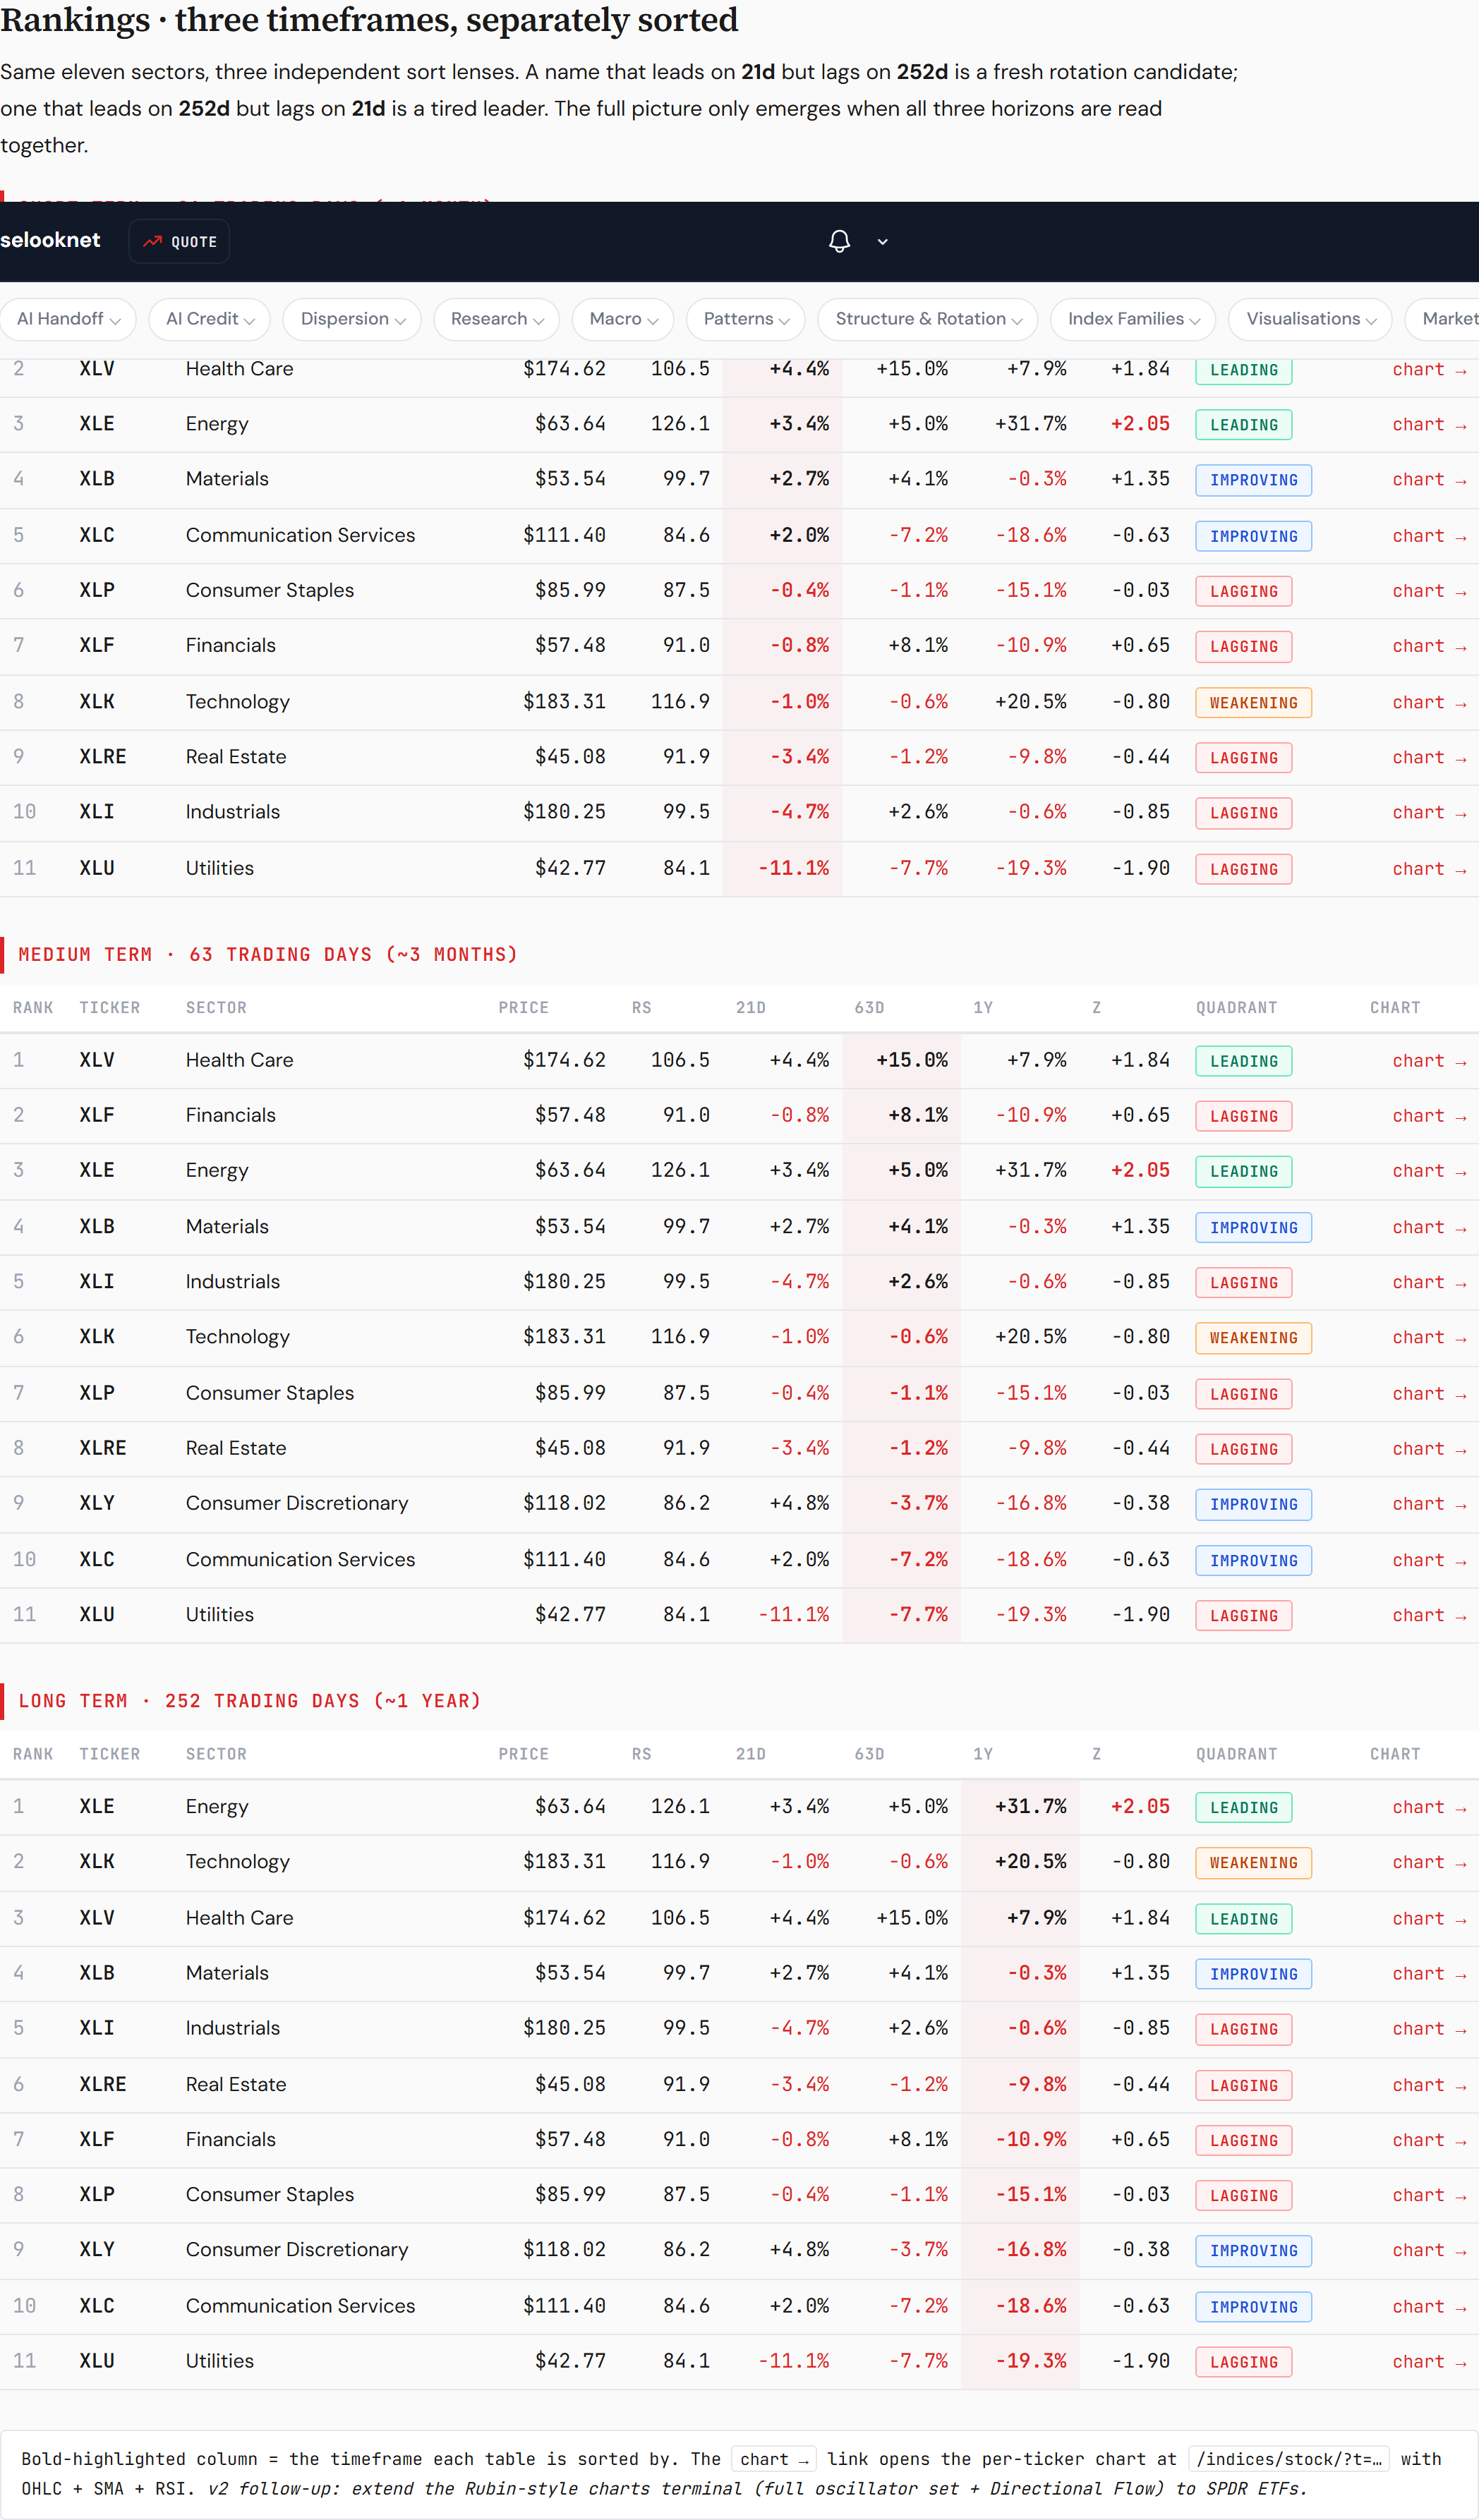
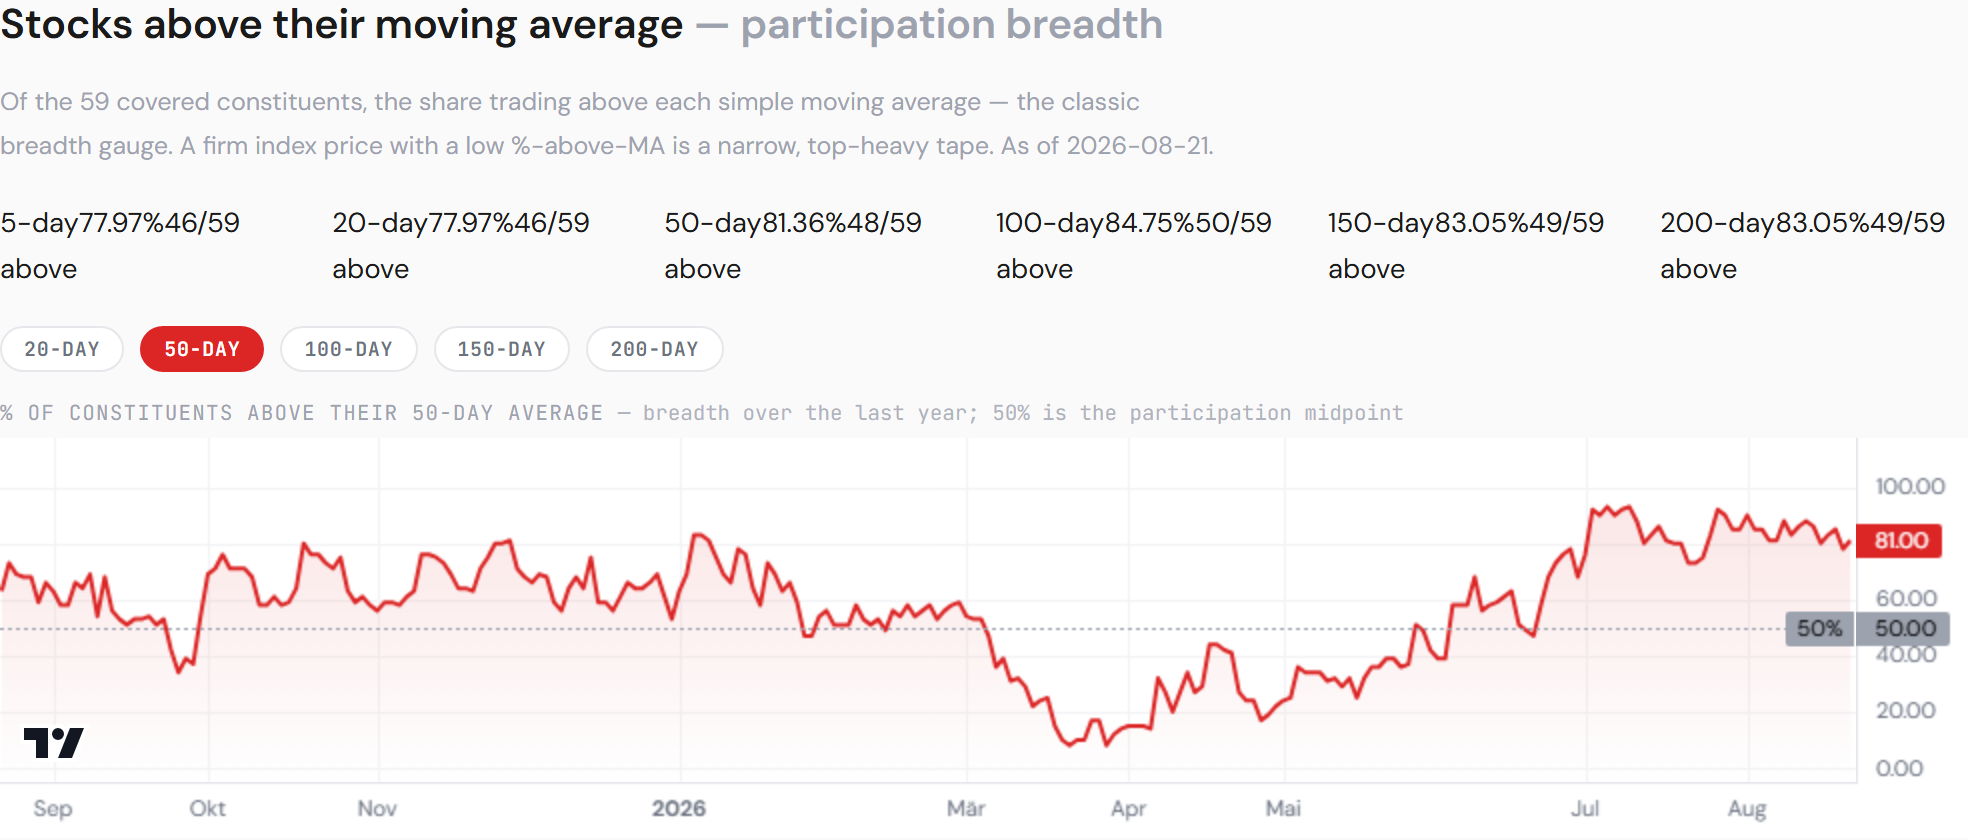
The sectors, underneath. On the house sector-RS board health care is Leading on all three lenses — RS 106.5, +4.4% against the S&P over 21 days, +15.0% over 63, z-score +1.84 — and underneath the ETF, 81% of its constituents sit above their 50-day average with ten names at new 52-week highs, the median member +9.2% on the month, a point ahead of the fund. Materials is Improving (global materials at a new 2026 high, 54% of the US sector at five-day highs on Friday); financials second on the quarter lens; technology tagged Weakening — RS 116.9 on the year, −1.0% and −0.6% on the month and quarter, 47% of its constituents above the 50-day and none at a new 52-week high. The strong sectors are strong underneath; the largest one is narrow underneath.
The hard-asset side, and the dollar. Gold +5.45% on the week and +13.0% on the month, the bitcoin fund +22.6% and +16.0%, copper miners +10.4% and +20.9%, US materials +1.9% and +6.9%, global materials +4.9% and +11.4% — every one of them closed Friday at its one-month high, while the Nasdaq 100 closed 2.5% below its. And it travelled with the weaker dollar it usually travels with: the dollar index fund −0.75% on the week. Saturday's Global letter carries these as a board; here they matter as the other half of the pillar — the 2025 stars are back, alongside the industrial commodities and the materials.
The book that expresses it — The Compound. The house's fourth tradable book is built for exactly this pillar. The Compound, published on wikifolio on 18 August, pursues a global growth approach that avoids the dominant big-tech and AI names: roughly a third ETFs, a third mega-cap growth, a third mid-cap growth — strategic core positions plus tactical ones for valuation discounts, market overreactions, sector rotations and corporate events — across developed and selected emerging markets, with focus areas in healthcare, industrials, infrastructure, consumer, financial services, energy and specialised market leaders; selection on sustained revenue, profit and cash-flow growth, balance sheets, capital returns, competitive advantages, pricing power, management quality and valuation. It is in its preview period now and becomes investable later this year; like the other three it will be inspectable position by position, and this section will carry its diary once it trades. Research diary, not a recommendation — and the same discipline as the AI books: the names are found wherever they are, not only where the mandate already points.
5 · What May Lie Ahead
Three questions, carried and renewed.
Question 1 — renewed: does the give-back stop, or does the cluster round-trip its print? Nebius at 219.13 sits below every close since its print; CoreWeave at 87.85 is at its lowest since before its. The payments are gone; the question is now whether the verdict-day gaps themselves survive Wednesday. The falsifier is a close through the pre-print levels.
Question 2 — do the talks become a deal? Unchanged in substance, better in price: Workday held 200.01 through the week, the floor tested at 190.64 on Tuesday and bought. The sources-say stage is still where deals go to be denied; a signed deal makes the takeout floor real and turns the screen — cash-flowing, roughly half-priced, doing work agents do not obviously absorb — into a live list; a denial retests 190.
Question 3 — MAGS at the shelf, attempt four: failed. The basket closed 67.28, −1.44%, 3.2% below the 69.5 shelf — further away than last week's 1.8%, a fourth consecutive week the defaults trail the average stock. Underneath: hyperscalers −1.18% as a cohort, Meta −6.77%, the supplier −4.64% into its own print. Four failed attempts at one shelf is a ceiling with a record; the December pivot at 62.56 sits seven percent below and remains the level that would turn consolidation into something else.
The levels that gate everything (the US letter's contract, compressed): QQQ 746 confirms the live count and a close back under 694 kills it — 723.85, last week's support, is now resistance and 713.44 is the 50-day the index closed on; SOXX 505 is 2.9% below, back in play; IEF 93.17 is the bond line that has now failed twice. For this board specifically, software's −2.2% year is the shelf that has to turn before the applications layer's 2026 deficit closes — and the ex-tech index at a three-year high is the new reference line for the pillar this letter just opened.
The bellwethers. Nvidia: −4.64% on the week into Wednesday's print, the referee for everything above. CoreWeave and Nebius at 87.85 and 219.13: last week the cohort's proof that a paid print can be kept; this week the proof that it usually cannot. Workday at 200.01: the takeout floor's price, held. Tempus AI at +39.5%: the family's best name, a health-care AI company — the pillar and the complex in one ticker.
6 · The Portfolio — Hypergrowth
The book, as published. Nineteen equity lines, four short calls and a cash reconciliation. Equity lines marked at Friday's closes; the option overlays carry their 14 August marks until the weekly export refreshes them.
| Position | Weight (equities) | Unrealised |
|---|---|---|
| NBIS | 13.43% | +123.6% |
| NET | 8.99% | +57.7% |
| DDOG | 7.22% | +78.2% |
| NVDA | 6.59% | +17.6% |
| TSM | 6.45% | +14.8% |
| MU | 5.93% | −0.6% |
| LLY | 5.78% | +23.2% |
| ASX | 5.64% | +59.3% |
| PLTR | 5.52% | +25.5% |
| QCOM | 4.95% | −6.0% |
| GLW | 4.60% | −21.4% |
| NU | 4.47% | −13.3% |
| RKLB | 4.45% | +2.7% |
| SMHX | 4.25% | +40.6% |
| BESIY | 3.80% | −32.1% |
| ATEYY | 3.45% | +26.4% |
| IFNNY | 3.01% | −31.7% |
| BB | 1.48% | −29.5% |
| WMT-Q | <0.1% | — |
The four short calls open are ASX 40.00C January 2027 (six contracts), DDOG 210.00C January 2028, NBIS 130.00C December 2026 (two), NET 250.00C December 2026 — covered positions writing premium against lines the book intends to keep.
Live book, updated continuously: closelook.net/portfolios/hypergrowth/
What we did this week: nothing. Zero transactions — the AI Build-Out book did the week's trading (two swaps, five trims, Saturday's trade-log edition carries the fills) and the derivatives book rolled its Nvidia call out a year; this book sat.
The book, marked. The equity lines closed Friday at $326,208, down $25,450 on the week — −7.2% — with Nebius alone accounting for roughly $11,700 of it at −21.1%, then Corning −9.7%, BlackBerry −9.7%, Rocket Lab −9.6%, BESI −8.8%, Infineon −8.8%, Datadog −7.8%, ASE −7.7%, Cloudflare −7.2%. Two lines rose: Eli Lilly +6.4% and Palantir +3.4% — the health-care name and the applications name, which is §4 in two tickers. The four short calls move the other way in a week like this — the Nebius 130 calls most of all — and are marked with the weekly export, as is the headline net liquidation; last week's mark was $298,379, +19.4% on the $250,000 deposited. The honest summary until the export lands: a bad week for the equity lines, partly cushioned by the premium the book had written against exactly these names.
What we plan to do — diary, not advice. Nothing before Wednesday's print. The referee for the count, the tilt and the retention rule prints inside 72 hours and this book does not act ahead of its own scoring convention. The two live watch-items are the ones §3 and §5 name — whether the challenger give-back stops above the pre-print levels, and whether the software names building flow from negative scores (Atlassian, Workday, Elastic) turn into price while the semis repair. And the new one: the pillar in §4 now has a book of its own, so the question "is this a growth name or an AI name" becomes a routing question between the two.
The four tradable books, open for inspection. Alongside the reference portfolios on this site, the tradable Closelook-companion books are published as personal wikifolios and can be inspected position by position at any time via closelook.net/portfolios/. The first three — two concentrated stock books and the conservative index core — have cleared their emission requirements and are expected to become investable before the end of August. The fourth, The Compound, the growth-with-no-tech-inside book described in §4, is in its preview period and becomes investable later this year. Every decision prints with a timestamp. A research diary made investable for its author; not a recommendation.
7 · What May Go Wrong
One: the payment came back, and the record was optimistic. This letter's falsifier said payments survive a week and die in the third; this one died in the second. The rule "paid prints die" is now undefeated this season, and Wednesday's print carries the longest expectation on the board.
Two: momentum turned below its trend on both continents. This cohort is the highest-beta expression of that spread and was sold to fund the reversal this week — four green names in ninety in the capex index. A spread that turns from the 92nd percentile does so mechanically, and the Global letter found the same turn in international instruments.
Three: the referee arrives with the tape already leaning. The semis were rejected at their line, the index sits on its 50-day, 694 is 2.7% below and Nvidia prints into it on Wednesday. A clean beat charged is the season's pattern; a clean beat charged on the index's largest weight is a different event.
Four: the flows were right about memory — and now point at software. The ledger called the memory give-back a week early; it now has Atlassian, Workday, Elastic and Snowflake building flow from negative scores into the same referee's week. If it is right twice, the software-vs-semis line inside tech reopens just as the tech-vs-everything-else line closes. If it is wrong, the names building from −50 have a long way to fall.
Five: a pillar built on one month is a pillar. The ex-tech index leads on the week, the month and the quarter and trails on the year by eleven points. Rotations out of technology have started and stopped before inside a quarter; the year-to-date number is the one that has not yet admitted anything. This section will say so every week it is true.
Each of these has a falsifier that prints within a fortnight. The book acts on prints, not on the fear of them.
8 · The Weekly Chart Pick — one name, worked by hand
This letter reads the market at name altitude — that is what separates it from Sunday's US edition, which reads the same market at index and sector degree. Once a week we take that altitude all the way down: one name, one chart, worked by hand rather than by screen.
This week's pick was published on Friday morning at 95.10 and closed the same day at 108.13 — +13.70% on day one. It is a brokerage that printed a record quarter — revenue $1.31 billion, up 32% year over year, earnings of 62 cents against roughly 43 expected — while its crypto engine ran in reverse, that line down 38% to $100 million, as prediction and event contracts rose roughly tenfold to $156 million. This week bitcoin ran through 75,000, the ten-asset crypto index fund broke a year-long falling wedge and the spot vehicle confirmed its channel break; the listed crypto equities ran with it and this name had closed lower, the laggard of its own complex. On Friday it stopped lagging.
The setup, as published: a five-wave advance from the 2022 low reading 0-1-2-3-4 complete with wave 5 unfolding — wave 3 at the October-2025 high of 152.46, wave 4 at the 30 March low of 65.16 — with price at publication sitting on the multi-year uptrend line inside a year-long symmetrical triangle, falling boundary near 115, rising floor near 87, mid-structure at 95.10. A manual Directional Flow read of −23.6, reversing up. The falsifiers, stated in the piece: a daily close under the triangle floor puts the count on probation; below 65.16 it is dead. The standing forecasts are published with it, and one day is one day.
Why it belongs in this letter. The name sits in none of the four buckets — it is the financial plumbing of the crypto complex, an application- and consumer-oriented disruptor in the sense §4 means — and the name-level opportunity of the week was, again, outside the buckets this cohort owns. That is worth knowing precisely because this letter's job is names: the discipline is to find them wherever they are.
The full version — the annotated chart, the wave count, the levels, the fundamentals and the risks at equal billing — is published weekly at closelook.net/chart-pick/. Every pick is scored publicly at 1 week, 1 month, 3, 6 and 12 months from publication. The record, not the single call, is the product.
9 · Knowledge Corner
What "growth with no tech inside" measures — and how to read it. The question this letter's new section asks — is the market rotating out of technology or out of growth? — cannot be read off the index, because the index is mostly technology. It needs three instruments. First, the ex-tech indices: the Nasdaq 100 and the S&P 500 with their technology sectors removed, each read against its parent across several windows; trailing on the year while leading on the month and quarter is the signature of a rotation in progress. Second, a control group: a growth index that carries no AI thesis — HALO here — read against the AI indices; flat against −7% says the selling is AI-specific, not growth-specific. Third, names: the week's best and worst across the family's constituents, because a handful of application- and consumer-oriented disruptors tend to do the exceptional compounding — and the S&P's best long-run performer, Monster Beverage, is the standing reminder that the biggest winner need not be a technology company at all. The house compare tool runs the index pairs on demand: /indices/compare/; the flow ledger runs the names: /stocks/rankings/directional-flow/.
10 · Final Words
A payment becomes a floor only if it is still there the week after. This week it was not.
What was there instead was a list of names with no AI in them leading the board, an ex-tech index at a three-year high, and a control group that did not fall. The AI complex was de-risked into its referee; the growth around it was not.
Price is the only truth — and this week it drew the line around technology rather than through it. Wednesday says whether the line holds.
The Closelook letters — where this one sits. The house thesis, compressed: the stock market is a growing system at the aggregate level in which most constituents slowly fade while a small group massively outperforms — and that group changes dynamically; it never stays static. Own the aggregate, know the current winner group, watch for the rotation. Right now the winner group is the AI stack, and the live question is which of its layers — building, operating, using — earns the next leg, and, as of this week, whether the next leg belongs to the stack at all. Three letters read that question at three altitudes: Closelook@Global Stock Markets (Saturdays) follows the geography of the money — regions, cross-asset, the core thesis owned through ETFs. Closelook@US Stock Markets (Sundays) reads the tape — the four-layer AI thesis at sector and index degree, the levels, the print records. Closelook@Hypergrowth (Sundays) reads the names — four growth buckets, the flow ledger, the tactical sleeve, and now the growth with no tech inside. Same market, top down. This is the name altitude.