C+

Weekly Signal · · 6 min read

TLT: The Crowded Trade

WEEKLY SIGNAL · TLT · KW 21
Sunday, May 25, 2026

TLT — The Crowded Trade

Hold 83 on a monthly close and long-duration Treasuries may be carving a major bottom. Break it decisively and the message flips to a durable inflationary regime. The cross-asset evidence sides with the bottom — price still has to confirm.

Aggregate read🟡 Contested
Line in the sand$83 monthly
Wave count(5) testing (3)
R2K · 52w · YTD · 1MBest major
The whole thesis fits on one number. With the rate-sensitive cohort refusing to break, the contrarian case is gaining credibility — but it isn’t validated until TLT defends 83 on a monthly close. A regime-decision week, not a regime-confirmation week.
TLT — iShares 20+ Year Treasury Bond ETF · Monthly · 2020–2026
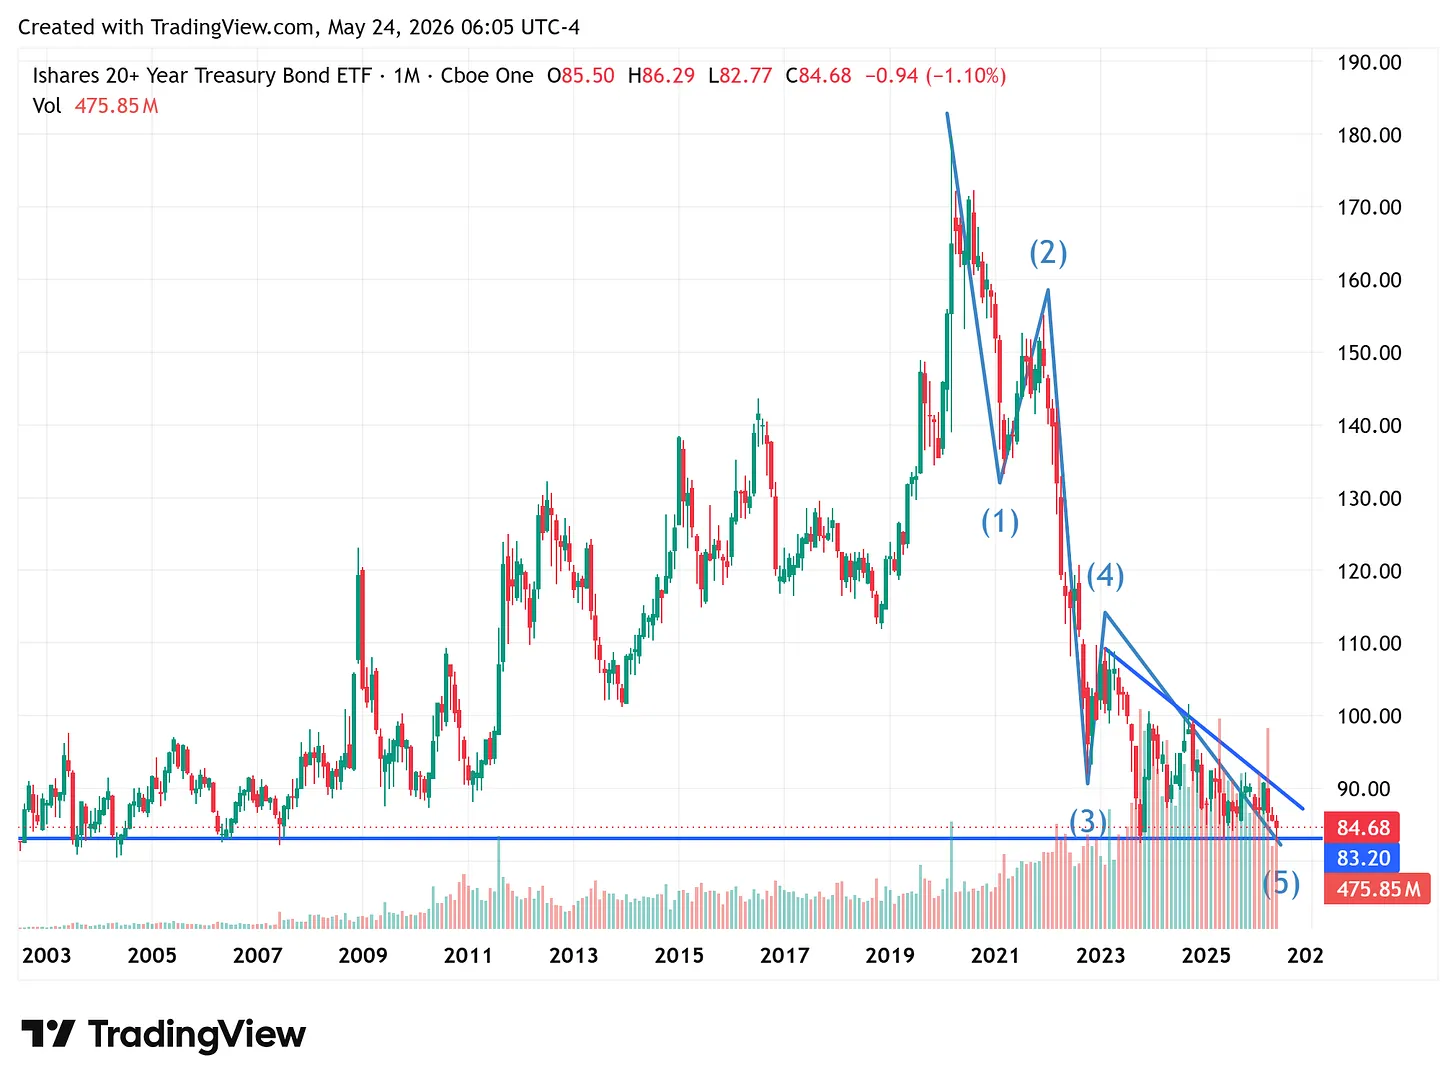
TLT monthly chart — five-wave decline from the 2020 high near 180, wave (5) testing the wave (3) low near 83 — the line in the sand for the long-duration bottoming thesis.
A five-wave decline from the 2020 high (~180); wave (5) is testing the wave (3) low at ~83 — the line in the sand. Source: TradingView, 24 May 2026.

The Grid (L1–L3)

Directional read drawn from the tape and the chart. Numeric scores plug in from the data lake.

Dimension Weight This week’s read Light
Macro 20% Consensus is sticky inflation → bearish duration. But the internals aren’t ratifying a fresh rate shock. 🟡
Liquidity 15% Financial-conditions / real-yield input — plug from data lake. 🟡
Trend 15% Still inside the five-wave decline; price under the long-term regression. Decelerating into 83. 🔴
Participation 15% R2K is the top major index over 52w / YTD / 1M, with broad risk-on alongside. A cohort, not a single-name squeeze. 🟢
Breadth 10% The rate-sensitive complex — REITs, small / regional banks — is holding or leading. The sectors that crack first under higher-for-longer are not cracking. 🟢
Volatility 10% Bond vol (MOVE) input — plug from data lake. 🟡
Sentiment 10% “Higher rates” is the obvious, crowded trade. On the contrarian axis, that’s fuel — not confirmation. 🟢*
Momentum 5% Monthly momentum still down; the reclaim of 84 is minor until it’s a close. 🟡

* Sentiment is scored on the contrarian axis: extreme one-sided positioning reads as opportunity, not trend confirmation. A reader used to the trend frame should know the sign is deliberately flipped here.

L1 · Regime

The market is priced for a durable higher-rates world. The internal evidence is ambiguous. That makes this a week where the regime is decided, not confirmed — and the deciding level is published below.

L2 · Trend (Structure)

A five-wave decline from the 2020 high (~180). The count is valid: wave (4) (~115) stays below the wave (1) low (~132), so there’s no overlap. Wave (5) is testing the wave (3) low rather than extending decisively through it — the classic shape of a fifth that runs out of sellers.

L3 · Health (Cross-Asset)

This is the spine of the contrarian case, and it’s a cohort signal — not a single index. The most rate-sensitive corners of the equity market are the canaries: small caps, real estate, regional banks. In a genuine higher-for-longer regime they break first, because they’re the most funding-cost-sensitive. They are not breaking. The Russell 2000 is the best major index over 52 weeks, YTD and the last month; REITs aren’t crashing; small and regional banks aren’t either. The cohort that should be weakest if a high-rate regime were arriving is instead behaving as if the peak in rates is already in. The equity market is voting against the inflation headline.

Russell 2000 (IWM) · Intraday · 18–22 May 2026
Russell 2000 (IWM) intraday — rallying off the week’s low near 270 to clear 282.49 and hold near 285. The rate-sensitive cohort leading, not breaking.
Small caps rallied off ~270 to clear 282.49 and hold near 285 — the rate-sensitive cohort leading, not breaking. Source: Barchart, 22 May 2026.

L4 · Context

The “higher rates” trade has become obvious — maybe too obvious. Everyone can see the same thing now: sticky inflation, rising yields, pressure on long duration. It’s a clean macro thesis, but a very crowded one. That is exactly why TLT is interesting here: the chart may be saying something different from the narrative.

L5 · Timing

The monthly close versus 83 is the only trigger that counts. The intramonth reclaim of 84 doesn’t confirm a bottom, but it does suggest sellers failed to break the key level when they had the chance. Same with the latest Japanese inflation print — inflation is still the headline, but markets often turn before the story does.

L6 · Decision — The Line in the Sand

One number settles it

  • Hold 83 (monthly close): Constructive. Wave (5) testing the wave (3) low, sellers failing at the level → long-duration bottoming setup, contrarian to the crowd.
  • Decisive break below 83: Thesis invalidated. The message changes to a more durable inflationary regime where long bonds stay under pressure → favour short duration, real assets, equities-over-bonds.

L7 · Risk

Invalidation is a clean monthly close below 83. Beyond that: Elliott counts are discretionary; small-cap leadership has alternate explanations (risk-on rotation, squeeze) that aren’t a rates call; and the crowd may simply be right. For now the crowd is still focused on higher rates — but the chart may already be whispering: be careful.

For all Weekly Signals, turn to closelook.net/weekly.
Closelooknet Weekly Signal — analytical framework, skin in the game, reference portfolios. Not investment advice.