Weekly Signal · · 10 min read
Stock Market at a Crossroads
Stock Market at a Crossroads
First TLT Weekly Signal — composite score 34/100 (Red regime) at multi-decade horizontal support. Path A vs Path B framework, April CPI/PPI shock, sector dispersion at extremes, XHB breaks $100.
The bull market has reached a point where two diametrically opposed regimes are both fully consistent with the price action — and only one of them survives the next eight weeks intact.
The Two Paths
Path A · The Bull Continues
TLT holds multi-decade support at $83. Yields stabilize. April inflation prints are recognized as Iran-war energy-shock distortion that fades by autumn. Earnings revisions stay positive, agentic AI capex compounds, and narrow Tech leadership broadens into a healthier tape as Financials, Discretionary, and Small Caps join.Path B · Regime Change
The inflation shock is structural, not transitory. Services PPI confirms broad-based passthrough. The Fed is forced to actively fight prices into 2027. Long-end yields break above 5%. TLT loses $83, the equity rally dies on duration compression, multiples reset 15–25% lower across the long-duration cohort. “Higher for longer” becomes “higher and harder.”This week, both paths are still alive. By the end of June, only one will be.
What the Inflation Data Says
The April prints removed any remaining “transitory” framing.
Headline CPI rose 3.8% year-over-year in April — the highest since May 2023, up from 3.3% in March and above the 3.7% consensus. Core CPI accelerated to 2.8% from 2.6%, with the 0.4% monthly core gain the firmest reading in over a year.
Then came the wholesale shock. Producer prices rose 1.4% month-over-month in April — nearly three times the 0.5% consensus, the largest monthly gain since March 2022, pushing the annual rate to 6.0%. Core PPI advanced 1.0% on the month, lifting the annual rate to 5.2%.
The composition matters more than the headline. Services PPI rose 1.2% — its biggest gain since March 2022 — and accounted for nearly 60% of the April move. Two-thirds of that came from a 2.7% jump in trade-services margins, with another 3.5% rise in machinery and equipment wholesaling.
This is no longer just an oil story. It is becoming a margin story — and margins, once they start pricing through, are sticky.
The Rate Repricing
The interest-rate complex has done a complete 180° in six weeks.
Fed funds futures now price zero rate cuts for the remainder of 2026, reversing the earlier expectation of at least one quarter-point cut. More striking: the implied probability of a rate hike by December 2026 has climbed to roughly 30–50%, and the odds of higher rates by June 2027 now sit near 60%. William Blair’s macro desk noted markets are now pricing better than a coin-flip chance of a March 2027 hike.
The internal Fed picture matches the external repricing. The April FOMC vote produced four dissents — the highest count since 1992 — indicating real fracture inside the committee about both the path and how to communicate it. New Fed Chair Kevin Warsh, despite being a Trump appointee, faces a far harder communications environment for justifying cuts with core services inflation pushing toward 3%.
TLT at the Fulcrum
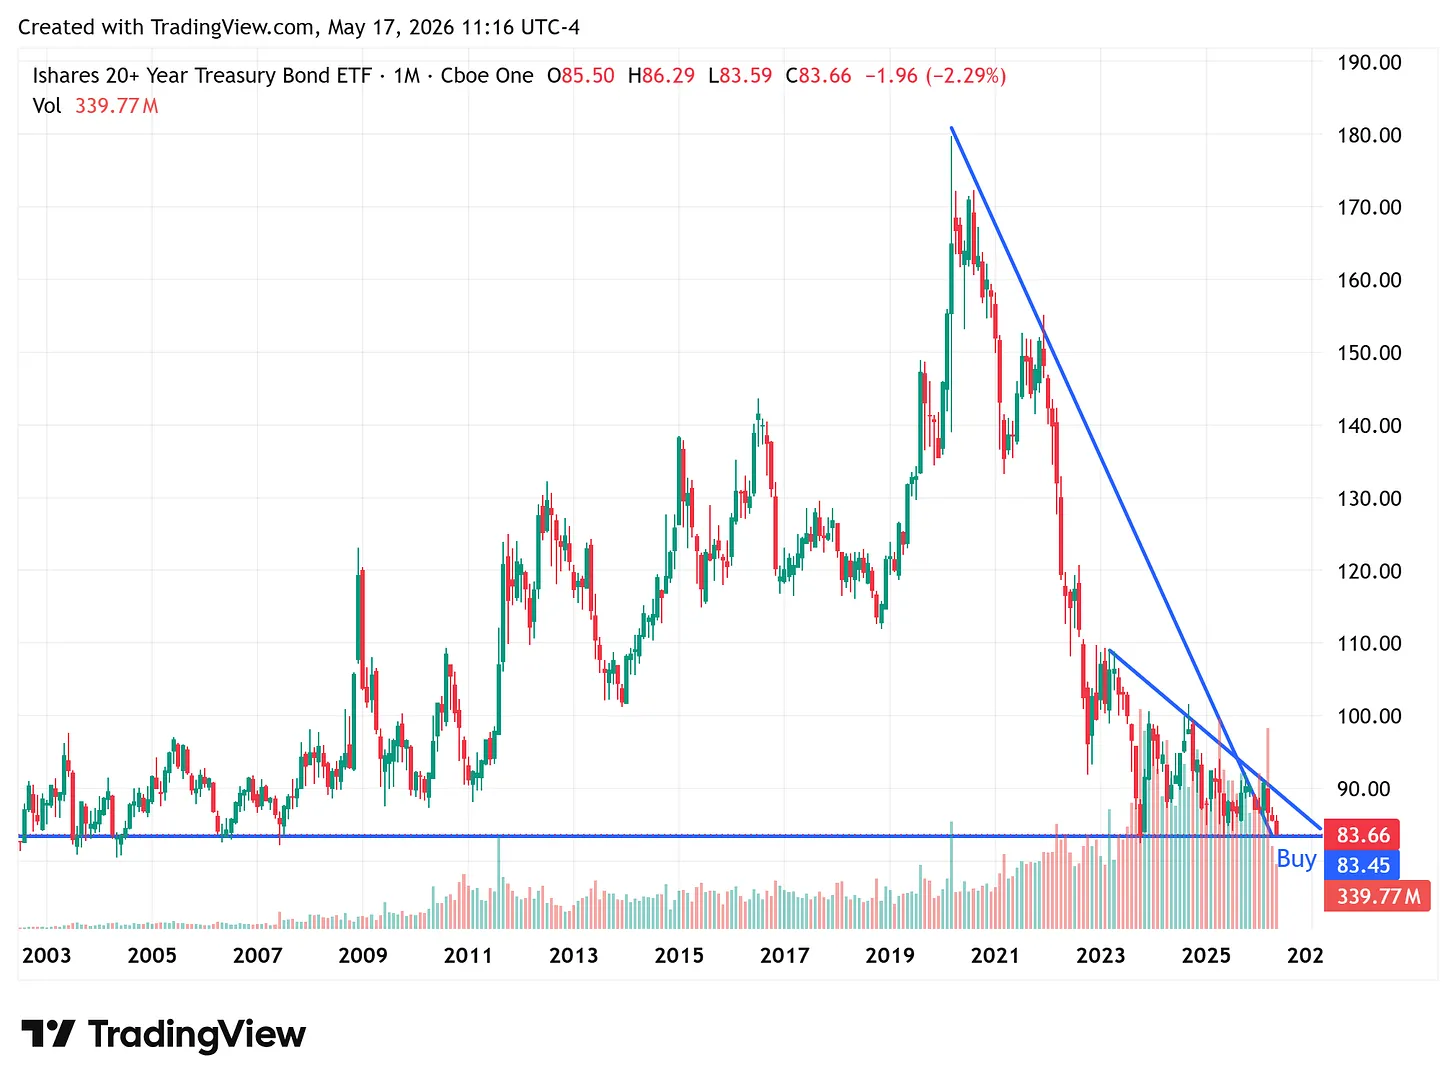
TLT closed Friday at $83.66 — sitting directly on a horizontal support that has held since 2003. Two descending trendlines, one from the 2020 peak at $180 and one from the 2023 peak at $110, converge into the same level. This is not a routine technical test.
The 10-year yield closed Wednesday near 4.49%, on the cusp of the 4.5% threshold that has historically marked the boundary between manageable and disruptive rates.
A weekly close below $83 in TLT, combined with a 10Y sustained above 4.5%, would be the cleanest single confirmation of Path B that the market has on offer.
What the Sectors Are Voting For
The S&P 500 sector dispersion is screaming something — but reading it carefully reveals what it is not saying.
Closelook Sector RS — short-term ranking, 21 trading days, as of 15 May 2026:
| Ticker | Sector | RS | 21d | 63d | 1y | Z | Quadrant |
|---|---|---|---|---|---|---|---|
| XLK | Technology | 119.0 | +10.6% | +17.7% | +24.2% | +2.19 | Leading |
| XLE | Energy | 113.1 | −0.3% | +1.4% | +16.7% | −0.57 | Weakening |
| XLP | Consumer Staples | 86.0 | −1.4% | −13.6% | −17.8% | −1.38 | Lagging |
| XLI | Industrials | 97.1 | −4.7% | −10.0% | −3.7% | −2.24 | Lagging |
| XLY | Consumer Discretionary | 85.4 | −6.3% | −8.2% | −18.5% | −3.01 | Lagging |
| XLV | Health Care | 90.1 | −6.4% | −16.3% | −12.5% | −1.68 | Lagging |
| XLRE | Real Estate | 86.3 | −6.7% | −8.7% | −17.4% | −3.10 | Lagging |
| XLF | Financials | 80.1 | −7.1% | −9.3% | −25.4% | −2.29 | Lagging |
| XLC | Communication Services | 91.7 | −7.7% | −7.1% | −10.5% | −2.07 | Lagging |
| XLB | Materials | 94.5 | −8.1% | −13.9% | −7.0% | −2.45 | Lagging |
| XLU | Utilities | 89.4 | −10.7% | −13.7% | −13.4% | −2.38 | Lagging |
XLK Technology is the only Leading sector. All ten remaining sectors sit in the Lagging or Weakening quadrants. Nine carry Z-scores below −2, with XLY Consumer Discretionary at −3.01, XLRE Real Estate at −3.10, and XLB Materials at −2.45. This is one of the narrowest tapes in the past three years.
What the picture does not show is the sector pattern of a confirmed inflation regime change. Energy is rolling over — XLE 21d −0.3% despite Brent at $107. Materials sits at Z −2.45. If the market truly believed the April prints signaled a structural inflation regime, XLE and XLB would be leading, not lagging hard. They are not.
What it does show is something closer to a demand-destruction scare. The deepest Z-scores cluster in Discretionary and in the rate-sensitive duration plays (XLRE, XLU). The consumer is being sold, not the inflation hedge being bought.
The Sharpest Single Lead: XHB Breaks $100
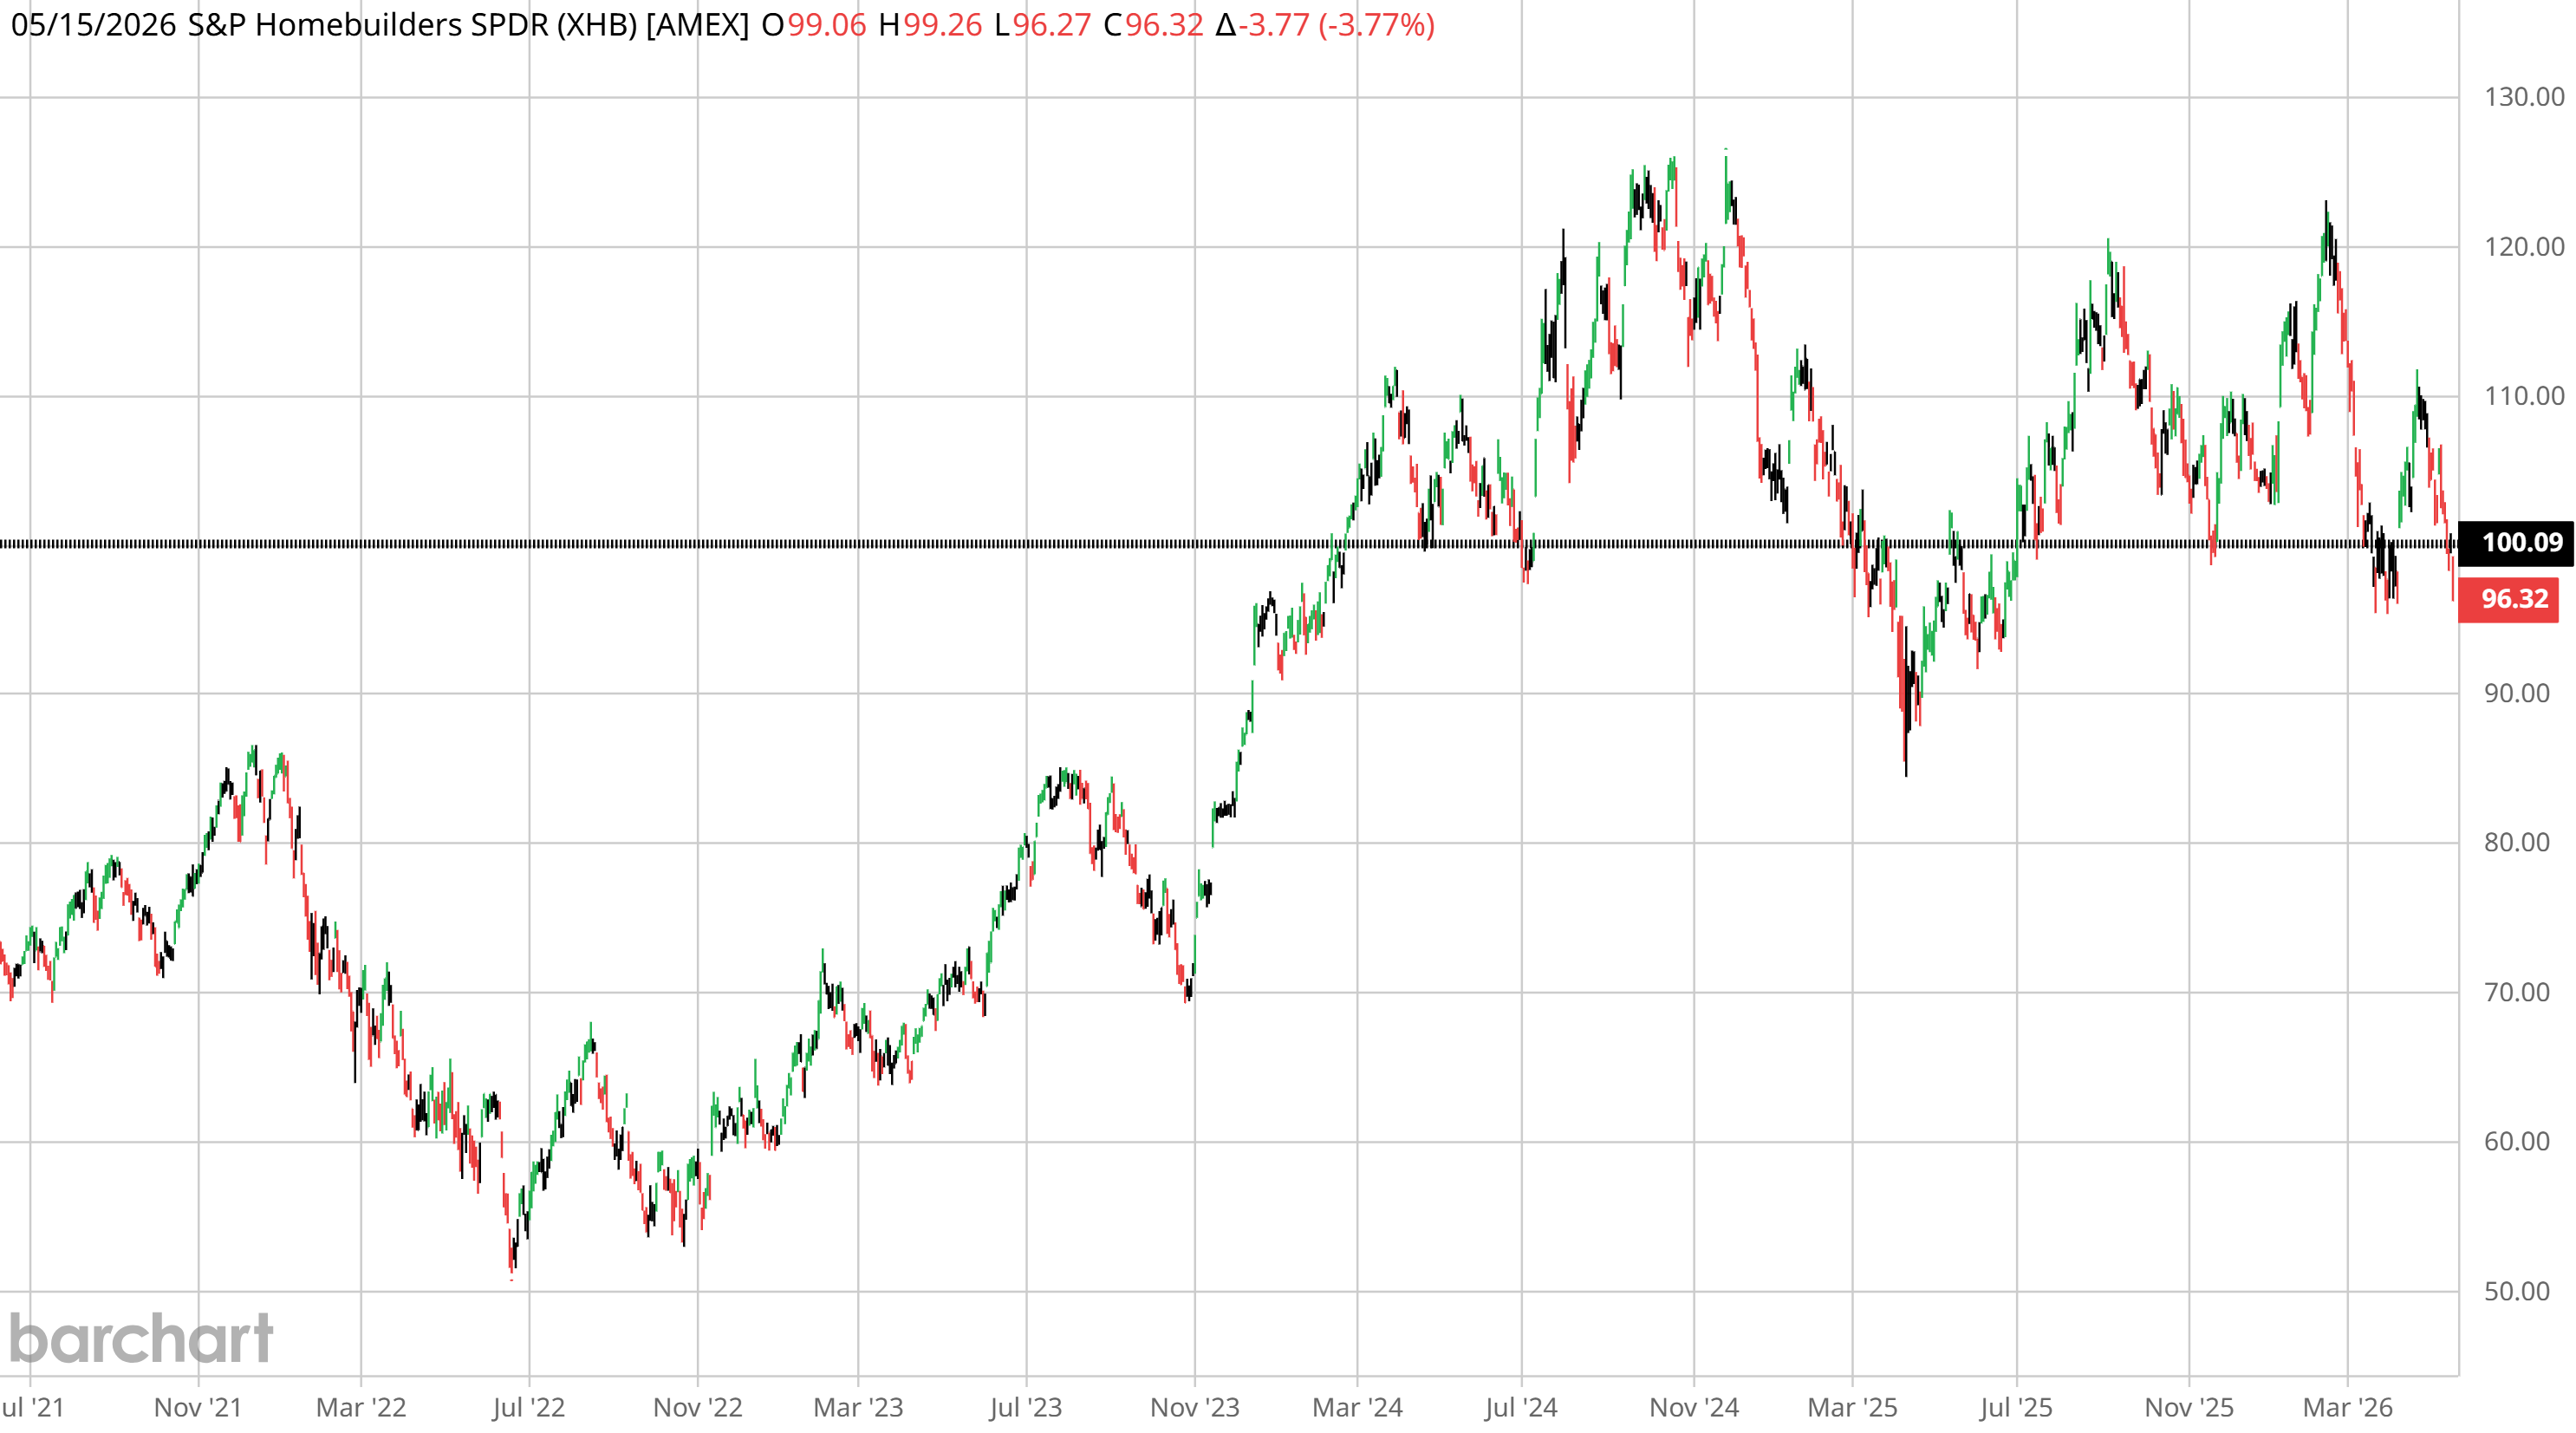
Among the leading-indicator basket — KRE, XHB, IGV, XBI, IWM — the homebuilders ETF delivered the sharpest single message of the week. XHB closed Friday at $96.32, down 3.77% on the day, breaking decisively below the $100.09 horizontal support that has held since Q1 2024.
Homebuilders are the purest forward read on mortgage-rate expectations crossed with consumer affordability. When XHB breaks, the market is voting that one of two things is now in play:
- Reading (a): mortgage rates stay elevated or rise further → bearish TLT (Path B)
- Reading (b): the consumer is finally cracking under cumulative affordability stress → bullish TLT (Path A via Fed-cut pressure)
Cross-confirmation tilts the verdict. Energy and Materials are not confirming inflation, which argues against (a). The deep negative Z-scores in Discretionary and Real Estate argue for (b). The most likely current reading: XHB is breaking on demand destruction, not on rate-spike fear — which makes the XHB break, counter-intuitively, consistent with the TLT support thesis, provided the inflation prints normalize.
What to Watch
Five Triggers · Ordered by How Quickly They Settle the Regime Question
- TLT weekly close vs. $83.00. Below = Path B confirmed structurally.
- 10Y Treasury vs. 4.50%. Sustained above = breakout of the 2024–2026 range.
- XLE 21d return back to positive + XLB joining. If both fire, inflation regime confirmed; if neither does, the April prints were the Iran-shock peak.
- XHB weekly close vs. $100. Reclaim = Path A still alive; sustained below = consumer crack confirmed.
- June 17 FOMC dot plot + dissent count. Fewer than April’s four = Warsh asserting committee discipline; more = institutional Fed credibility issue.
The June 11 PPI release and the June 17 FOMC meeting will likely resolve which path the next eighteen months take.
For now: the bull market is intact, TLT is holding, but the asymmetry of the setup has flipped. Six weeks ago, the bond market was a sleepy assumption inside the bull case. Today it is the variable that decides whether the bull case survives at all.
Composite Scoring · TLT Regime Reading
| Lvl | # | Dimension | Weight | Reading | Score |
|---|---|---|---|---|---|
| L1 | 1 | Macro Regime · 200WMA + slope | 20% | Below 200WMA, negative slope, but at 22-year horizontal support | 30 |
| L1 | 2 | Liquidity / Macro · real yields + Fed + inflation expectations | 15% | Real yields elevated, Fed hawkish (no cuts 2026), hikes pricing in for 2027 | 25 |
| L2 | 3 | Primary Trend · SuperTrend weekly | 15% | Short, no flip yet | 25 |
| L3 | 4 | Participation · A/D on TLT | 15% | Mixed — heavy volume into support test | 35 |
| L3 | 5 | Breadth · IEF / LQD / HYG / TIP / curve | 10% | Complex broadly weak, curve flat-to-inverted | 30 |
| L3 | 6 | Volatility · MOVE Index | 10% | Elevated (CPI/PPI shock days) | 30 |
| L3 | 7 | Sentiment · COT Treasury specs net | 10% | Specs net short at multi-year extreme → contrarian bullish | 65 |
| L5 | 9 | Momentum · Stochastic (14,3,3) | 5% | Oversold, potential RSI divergence at support | 55 |
| Weighted Composite | 34 / 100 · 🔴 RED | ||||