Daily Pulse · · 08:30 CET · market · XLK

The message from sector rotation is becoming harder to ignore: Technology is still the strongest sector on a one-year view, but it is no longer leading on a short-term basis. That distinction matters.
On the long-term table, XLK still ranks first. The sector remains up strongly over one year (+22.7%) and still has the highest relative-strength reading (118.7) among the major SPDR sector ETFs. But the shorter windows now tell a very different story. Over 21 trading days, XLK is down more than 7%, making it the weakest sector in the short-term table. Over 63 trading days it still looks strong, but the quadrant has already shifted to Weakening.
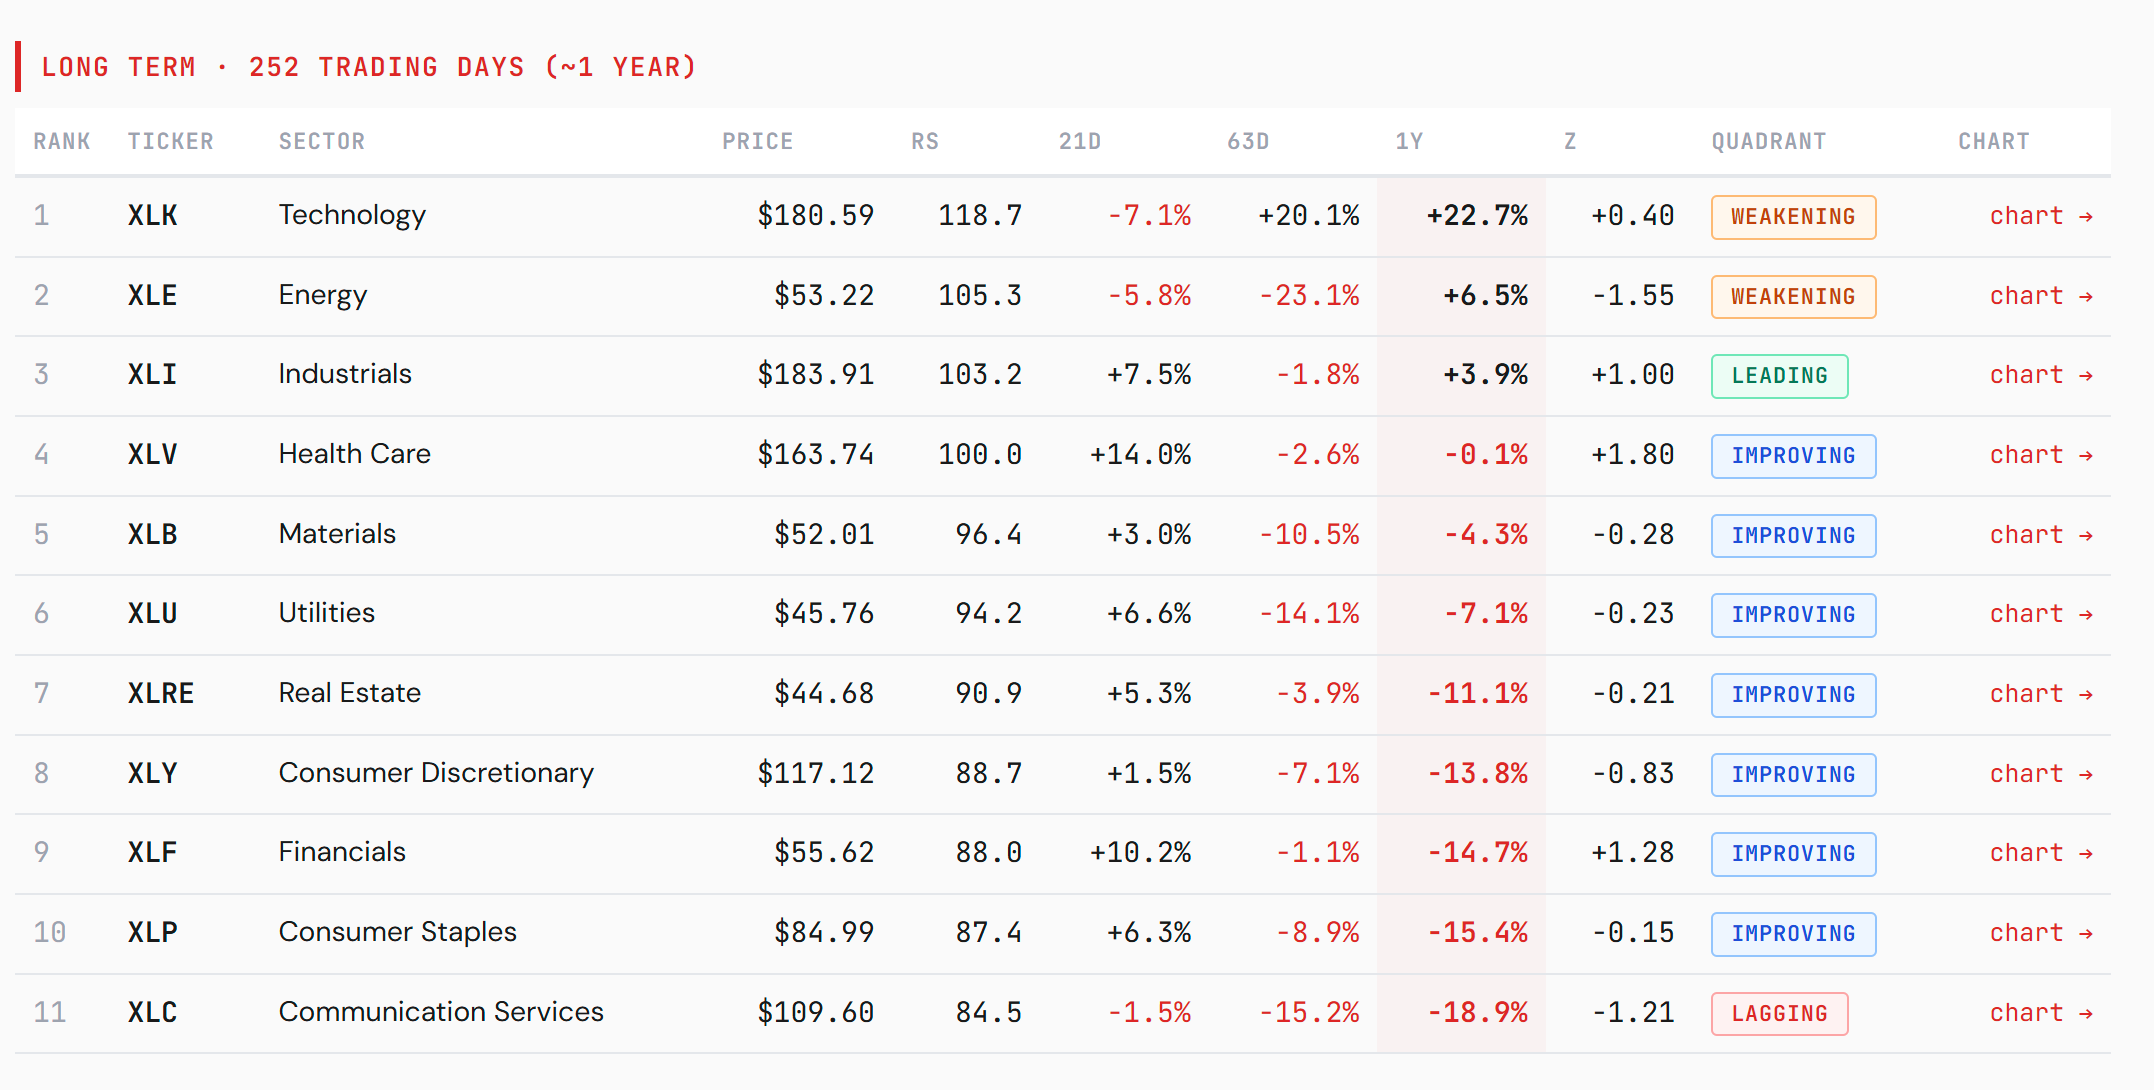
That is usually how leadership deterioration begins. Not with an immediate collapse in the long-term ranking, but with a change in direction first.
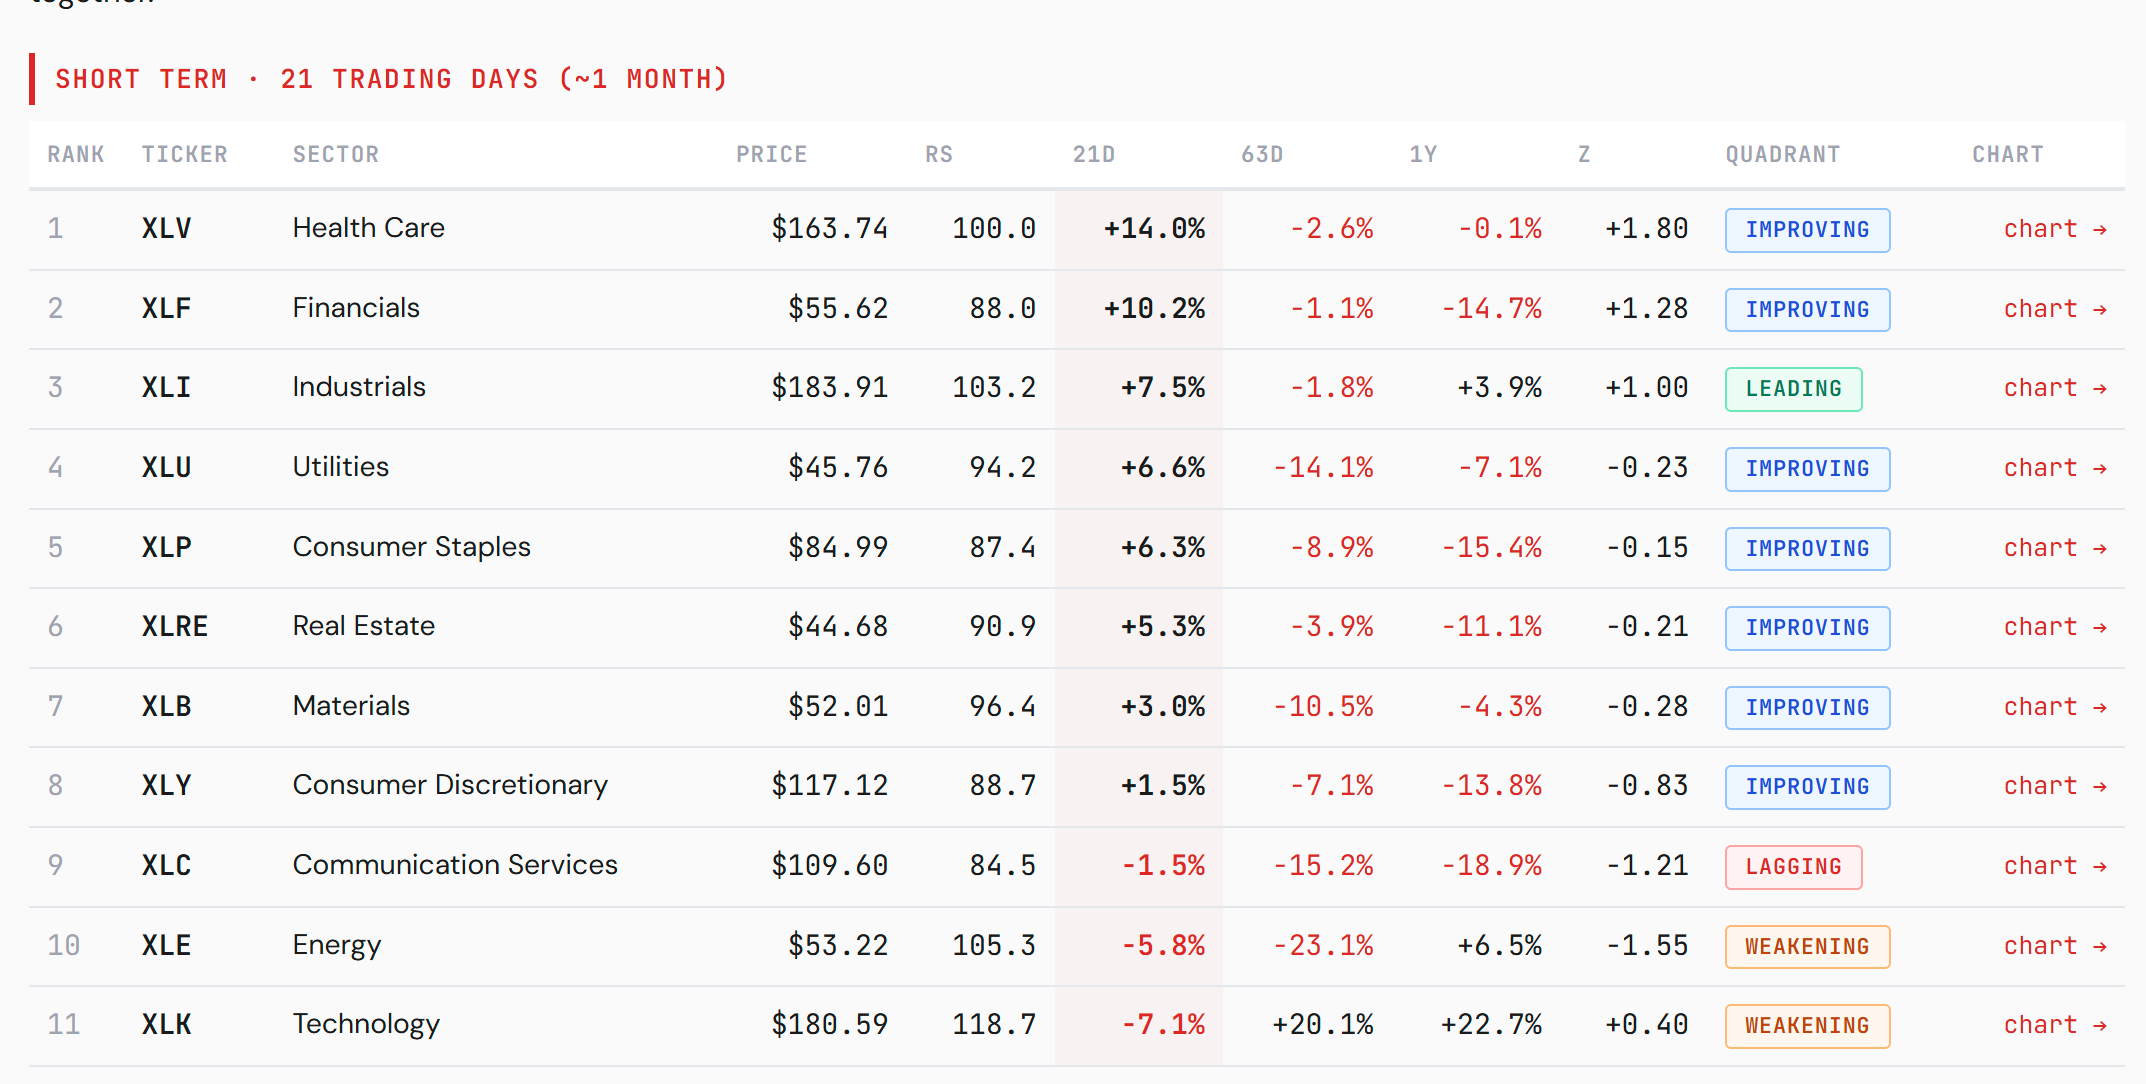
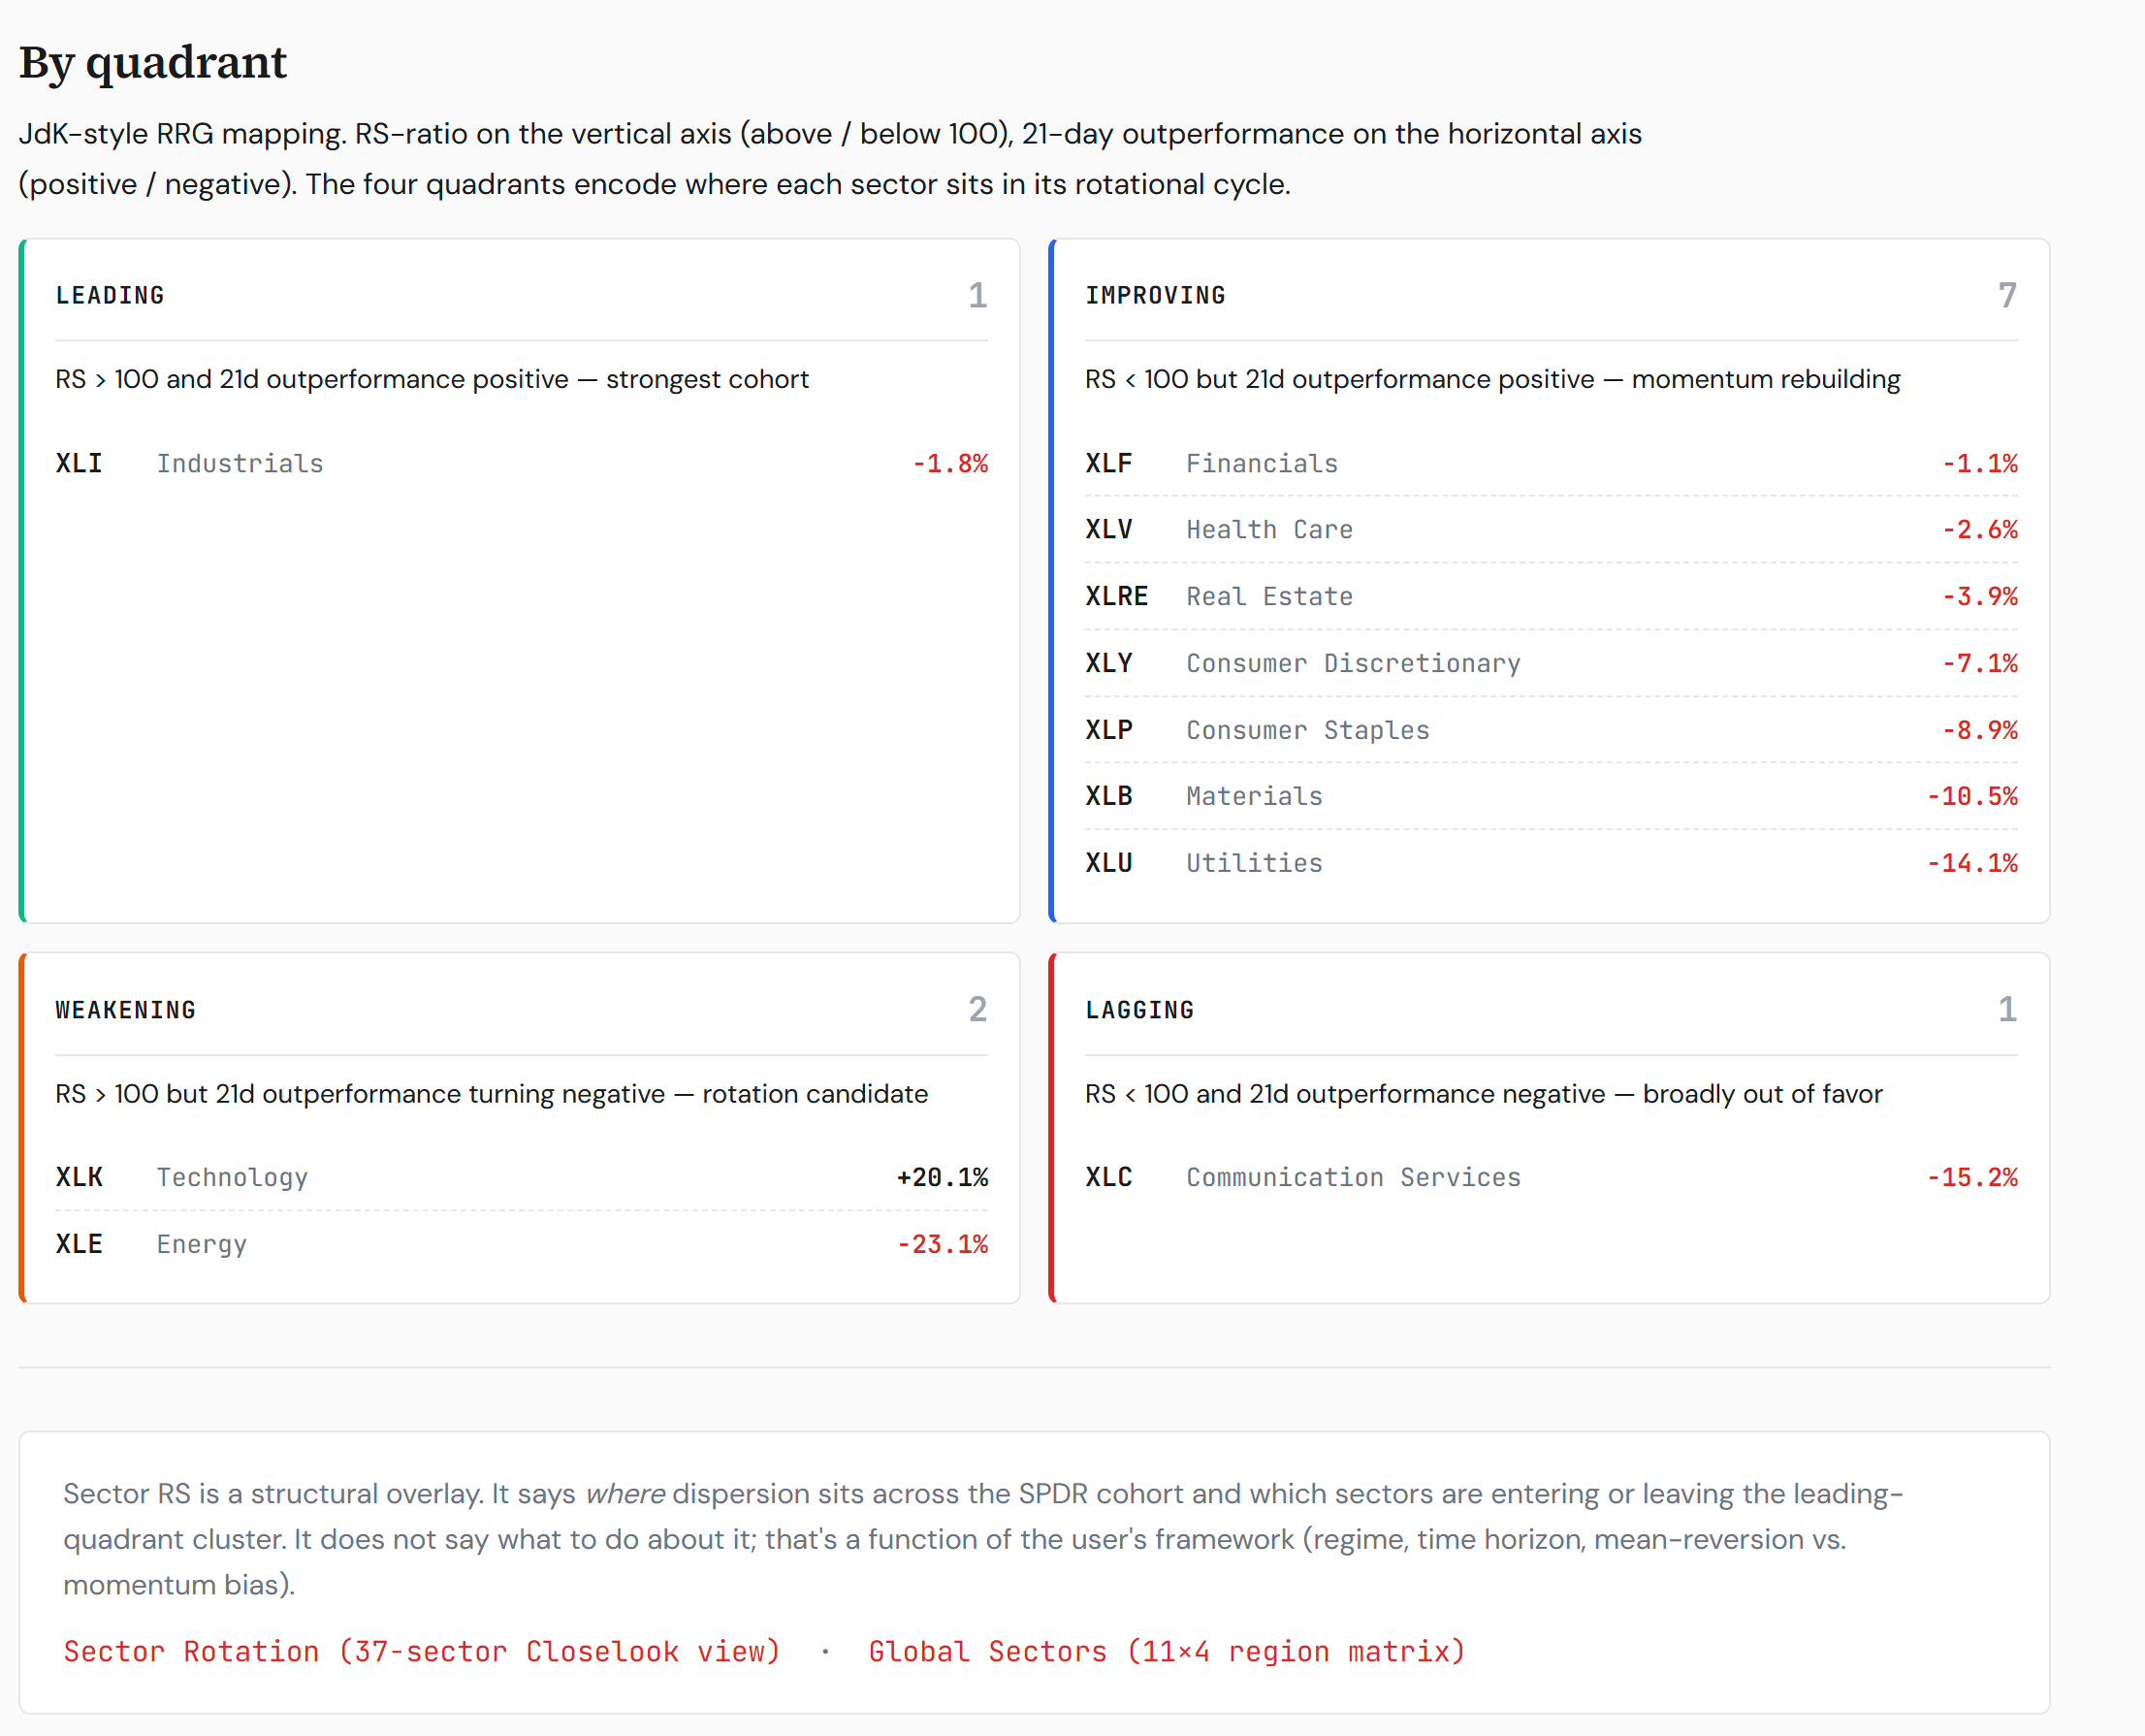
The sector map now looks like this: Industrials is the one sector genuinely leading — relative strength above the benchmark and positive over the short window. Behind it, a broad improving cohort is rebuilding momentum — Health Care (the strongest 21-day mover at +14%), Financials, Utilities, Consumer Staples, Real Estate, Consumer Discretionary and Materials — all positive on the short-term view while still carrying below-benchmark relative strength. Technology and Energy sit in the weakening quadrant, and Communication Services remains lagging. In other words, the market is no longer simply rewarding the old AI-led mega-cap growth trade. It is starting to broaden, rotate, and test alternatives.
This fits the pattern we have seen several times this year. When the AI trade dominates, capital crowds into the same capex- and platform-sensitive technology exposures. When that trade cools, the market does not necessarily go risk-off immediately. Instead, it searches for areas where earnings power, growth and pricing are less dependent on the AI capex cycle.
That is exactly where the HALO 100 becomes interesting again.
HALO is designed as a basket of AI-neutral growth compounders — companies and sectors where the growth thesis is not primarily driven by the AI factory build-out. The index worked well at the beginning of the year, when the AI trade was under pressure. It then weakened during the strongest phase of the AI boom, as capital moved back into semis, infrastructure and AI-linked technology. But over the past few weeks, HALO has started to recover again.
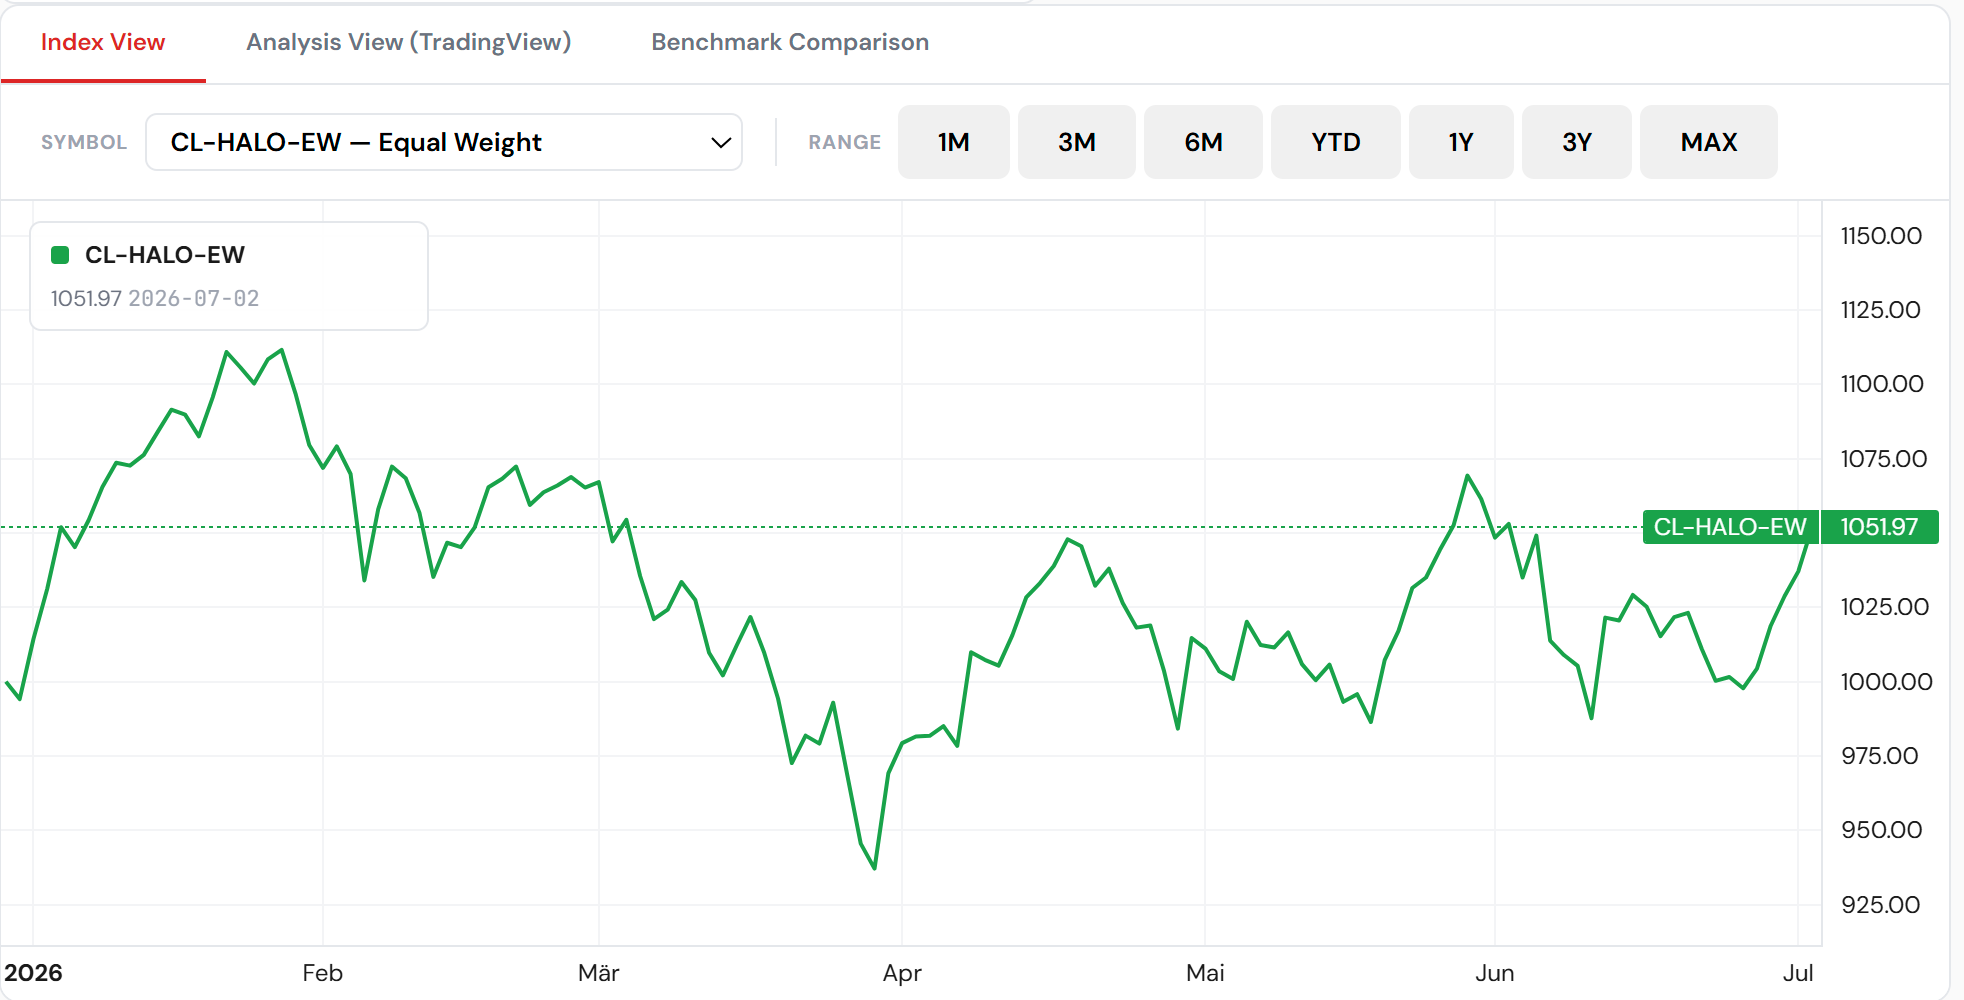
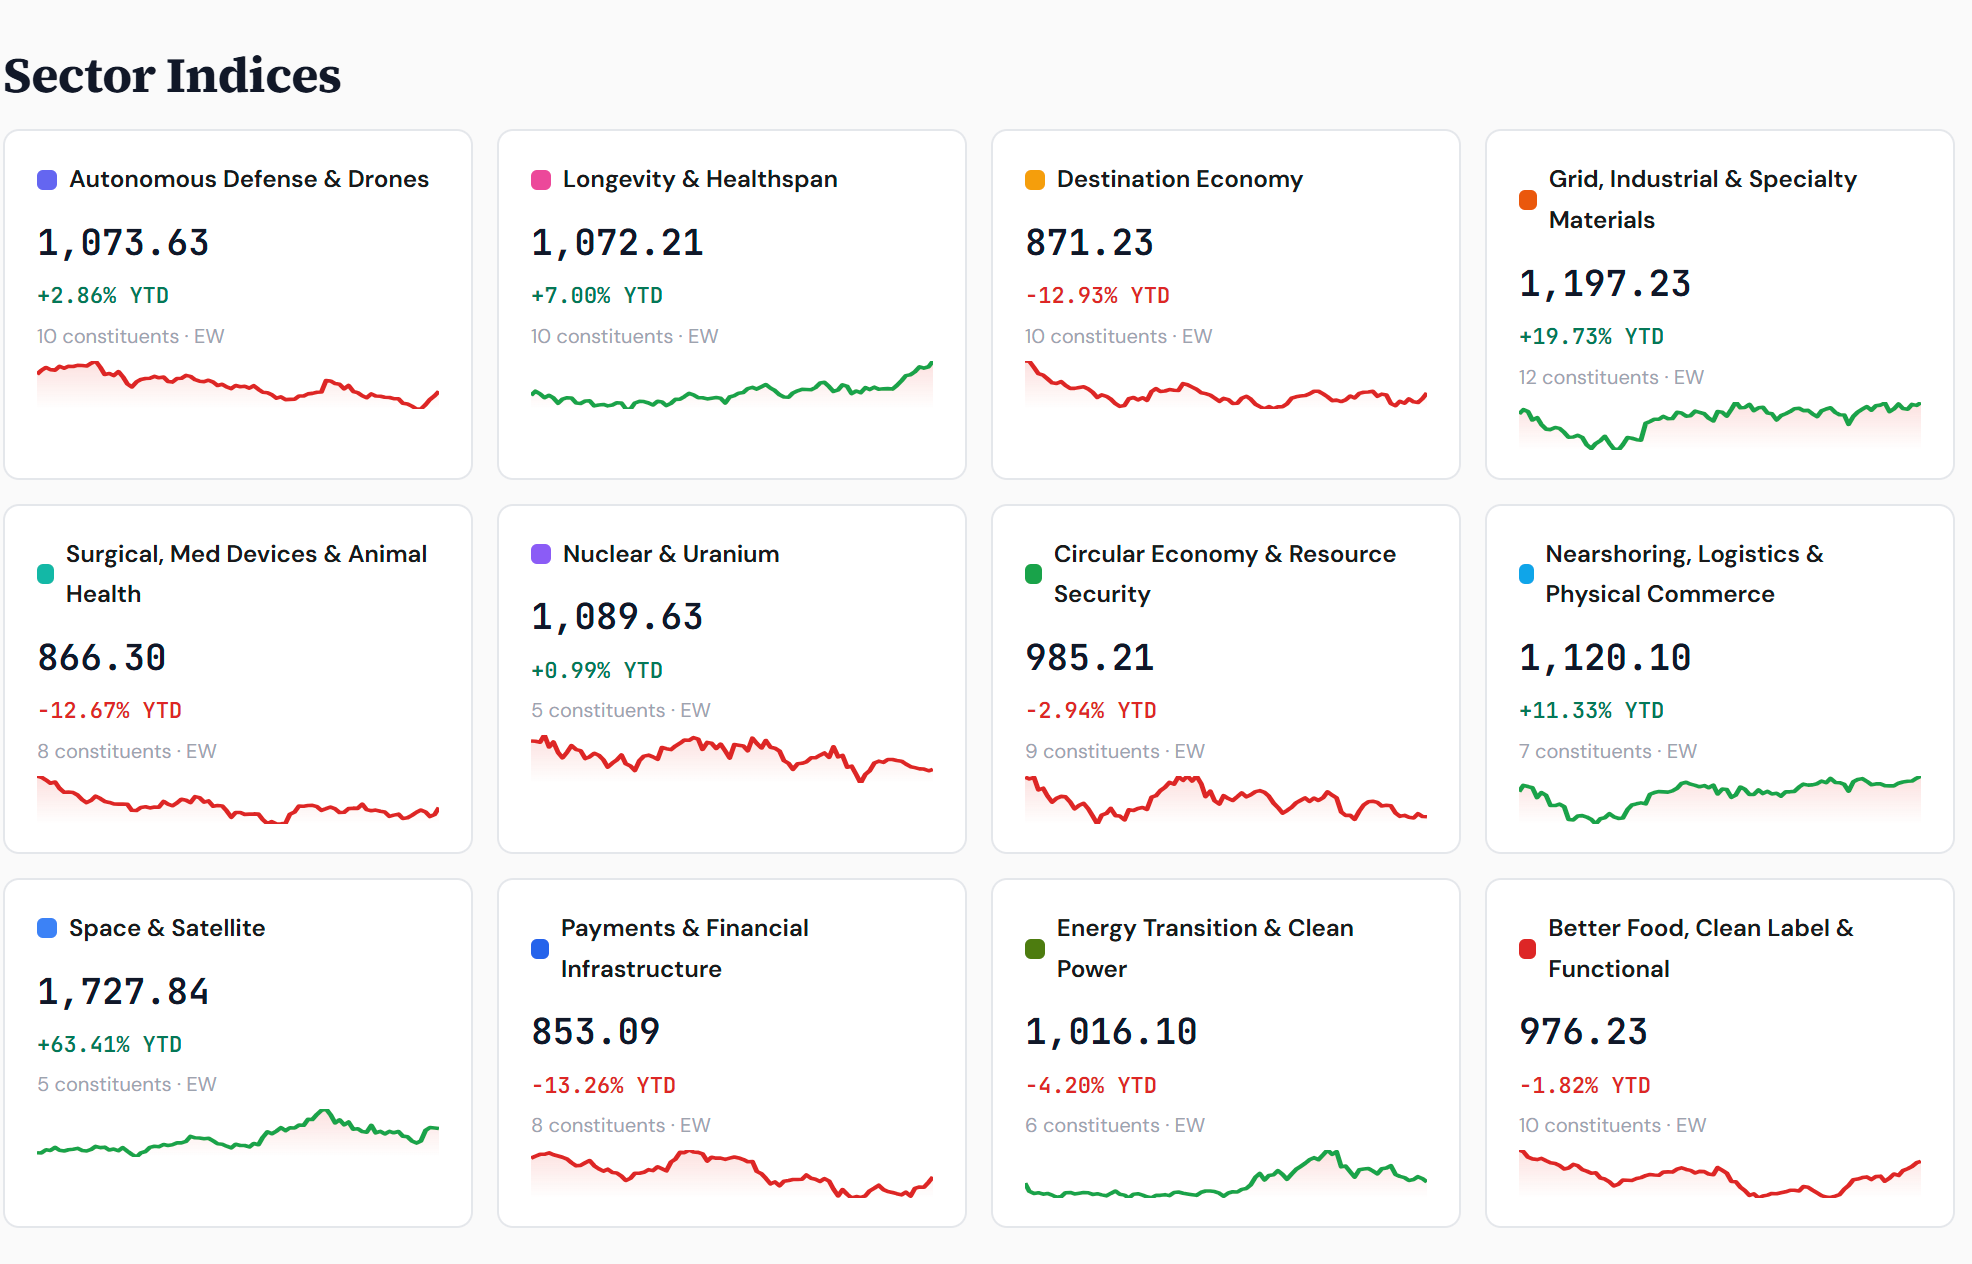
The index is now back above 1,050 and has turned positive year-to-date. Several sub-sectors are already showing clear positive leadership. Space & Satellite remains the standout, Grid, Industrial & Specialty Materials continues to compound, and Nearshoring, Logistics & Physical Commerce is also firmly positive. Longevity & Healthspan has started to improve again as well.
The signal is not that Technology is “finished.” That would be too simple. The signal is that Technology's relative leadership is weakening at the same time as AI-neutral growth is regaining traction.
That matters for portfolio construction. In a market where AI capex has been the dominant gravitational force, the next rotation does not need to be anti-growth. It may simply be less AI-capex-dependent growth.
For now, the tape says: the AI trade is cooling internally, XLK is no longer leading short-term, and HALO is starting to behave like it did during the last phase when the market wanted growth outside the obvious AI winners.
Stay close. Look closer.