Daily Pulse · · macro · GLD
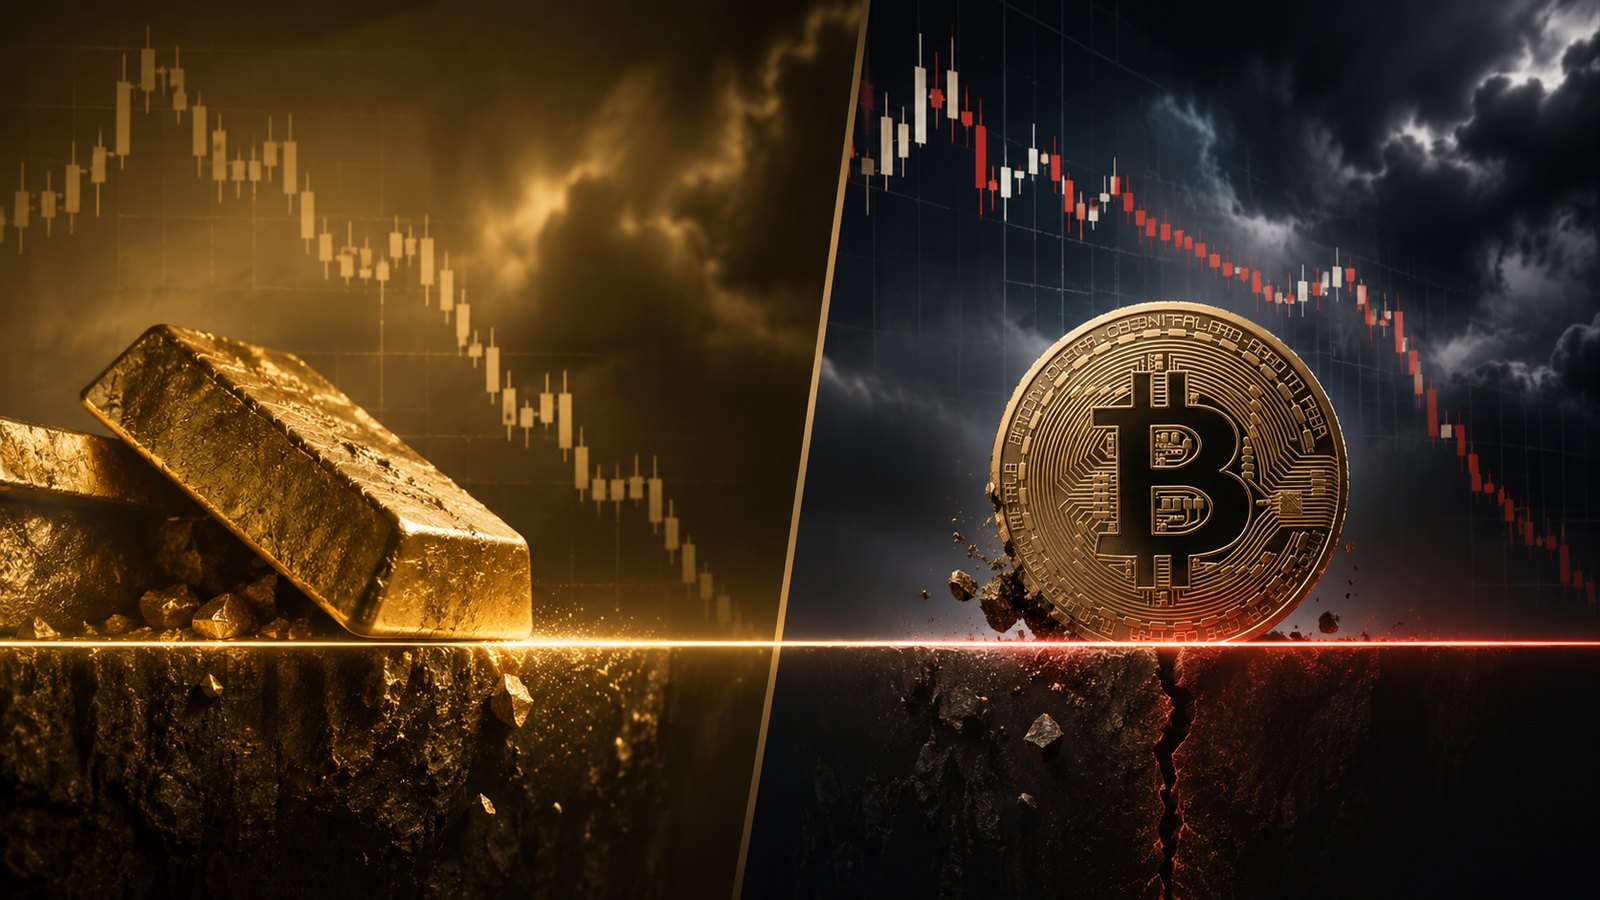
Gold and Bitcoin have reached the point where the chart matters more than the story — and they reached it together. The question is no longer whether they hold. It is what a joint break would actually mean.
For months, holders have carried both as intact structural bulls — and as something more than trades. Gold, the monetary hedge. Bitcoin, the liquidity hedge. But underneath, both are insurance on the same policy: a hedge against the system itself — fiat debasement, the great crisis, the black swan, financial armageddon. Over a secular horizon that thesis may hold. But markets don't move on secular stories. They move when positioning, trend, and psychology collide. That collision isn't approaching. It's here.
Two lines, and they are simple:
- GLD — the 365 shelf. Not “around 360” anymore. Price opened the session on the 365.39 support that held earlier in the advance, with 360 the round-number floor just beneath. The prior rising structure is already broken. Gold is sitting on the shelf, not above it.
- Bitcoin — the 57,500-60,000 band. Having lost 62,140, BTC is now trading inside the zone it has to hold, near 58,800. This band is the last technical floor before the structure opens up.
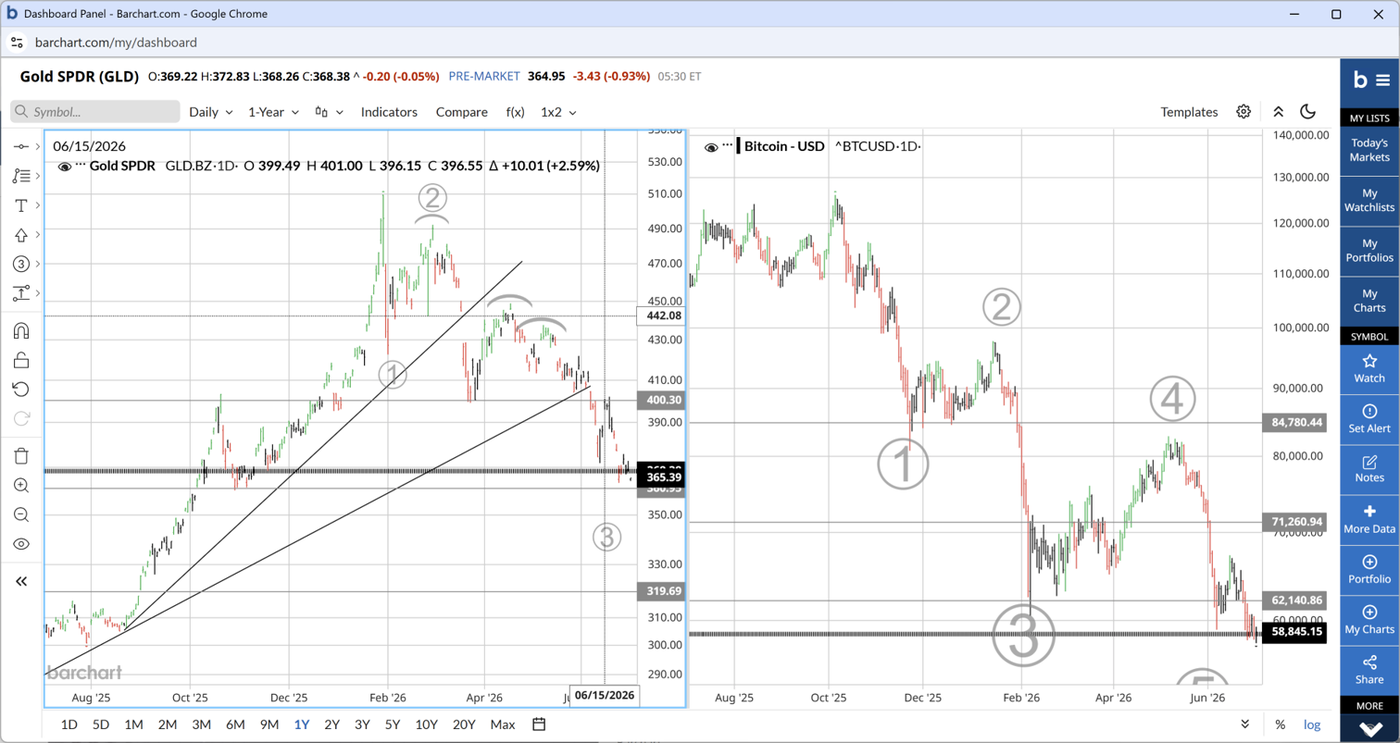
These are not just technical levels. They are belief levels — the price at which the market decides which story it is telling. Above them, both assets can still argue they are correcting inside a larger bull. Below them, the burden of proof flips.
One break, two opposite meanings
Here is the part that matters more than either chart. Gold and Bitcoin have opposite narratives but the same job: both are insurance against systemic failure. So when they break the same line at the same time, there are exactly two ways to read it — and they point in opposite directions.
Read one — the dangerous one. The hedges are being liquidated for cash because the system is under real stress. Correlation goes to one; the monetary hedge and the liquidity hedge fail together. That is the fingerprint of forced de-grossing — the crisis the insurance was bought for is the very thing now selling the insurance.
Read two — the constructive one. The market is de-rating the apocalypse. Capital that sat in debasement insurance is being reallocated into productive, compounding assets — the AI build-out, rising corporate earnings, the real economy's growth engine. The hedges aren't failing; they are being sold on purpose, because the thing they protect against is being priced as less likely relative to what real growth now offers.
Same tape, opposite meaning. The discriminator is simple: follow the proceeds. If equities — and the AI-cycle names in particular — are bid while gold and bitcoin bleed, this is rotation, not ruin. If cash and the dollar are the only bid and everything else is red, it is forced de-risking. One is a green light wearing a red mask; the other is the real thing. (Our Money Temperature read is the cleanest tell on which regime is bidding; whether correlation actually goes to one shows up in cointegration.)
If read one wins
If the proceeds go to cash rather than to growth, the selling comes in three waves:
- Technical — stops and trend-followers, mechanical.
- Emotional — holders who assumed consolidation, now confronting a cyclical bear inside the secular one.
- Structural — the slowest and heaviest: investors who bought the long-term story and never priced a cyclical bear market inside it.
Only the first wave is on the chart today. The other two are latent. This is the scenario the level is guarding — a conditional risk, not a forecast.
But the tape is arguing for read two
Set the doomsday prophets aside for a moment. The more useful interpretation of hedges bleeding into a live AI build-out is not that the system is ending — it is that investors are done paying a premium for the end of the world and would rather own the thing that compounds. That is not a doom signal. It is capital choosing the real economy. And it is the same flow that shows up one layer over as the opex handover: the money leaving apocalypse insurance has a destination, and the destination is the build-out and the earnings it is starting to throw off.
The line cuts both ways
Discipline beats narrative here. A support this clean is exactly where bull markets reload. A hold — better, an intraday break that reclaims by the close — is where the bull case re-enters with the tightest stop of the last six months: wrong cheaply, at the line, not on a story. The same level that arms the bear thesis on a break is what gives a bull the cleanest defined-risk entry of the cycle. One line, two setups.
The read
- Above the lines — 🟡 benefit of the doubt to the bull structure. A correction inside a trend. Nothing to reclassify.
- Below and holding, cash the only bid — 🔴 forced de-risking. The chart's downside opens: gold toward the ~320 area it last based from, Bitcoin into open air beneath the band.
- Below and holding, the AI cycle bid — 🟢 rotation, not ruin. Insurance being sold into the real economy. The break is a feature, not a warning.
For now, neither is broken. But both are close enough that the next move may matter more than the last six months of narrative combined — and the tell will not be in gold or bitcoin. It will be in what gets bought when they break. Watch the lines, then watch the proceeds, not the prophets.
Stay close. Look closer.
Positioning language is reference-portfolio logic, not a recommendation to the reader; publishing and money management remain separate. Levels as marked on the accompanying daily charts (GLD / BTCUSD, 1-year).