Daily Pulse · · macro · GLD

Gold fell about 25% to around $4,000, and the easy read is that gold broke. It didn’t. The plumbing did. Three of the four pillars that held the market up have cracked this year — the fourth, the one nobody trades on the Fed, is the only reason a correction hasn’t become a rout — and the chart now poses a sharp forward question the structure can’t fully settle.
Back in late May we flagged gold’s first wave down — a textbook correction off the early-year top, GLD pinned to the lower rail of a tight channel. That wave has now extended into a full structural reset. GLD — which holds bullion and tracks roughly a tenth of the spot price — closed at 369.46, down 11.4% on the month and about 28% off its wave-(3) peak near $510.
Three pillars cracked
The four pillars that built the bull have split cleanly into three that reversed and one that held. The contrast is the whole story.
| Pillar | 2023–24 build-up | Mid-2026 reality |
|---|---|---|
| Indian physical | A steady floor under baseline global demand. | Reversed. A May import-duty hike from 6% to 15% to defend the rupee; the World Gold Council reads it as removing roughly 10% of annual demand. |
| Chinese retail | Heavy buying; Shanghai traded at a premium to London. | Reversed. Physical demand is exhausted; by June the premium had compressed into a discount. |
| Western hot money | Accumulating ahead of anticipated Fed cuts. | Reversed. After the hawkish Warsh pivot, global gold ETFs bled about $2 billion in May. |
| Central banks | Record, price-insensitive buying. | Intact. 244 tonnes in Q1; the PBOC added 10 more in May, a 19-month streak. |
India, China and the Western ETF complex were the price-sensitive marginal buyers — the ones who chase the trend up and abandon it on the way down. Losing all three at once is what left the metal with no demand cushion underneath the move.
The pillar that held
Only the central banks didn’t flinch. 244 tonnes in the first quarter, another 10 from the People’s Bank of China in May, a nineteenth straight month of accumulation — and crucially, bought without reference to price. That is the distinction that matters. Emerging-market reserve managers aren’t trading the Fed’s rate cycle; they are trading the long-term geopolitical architecture — reserve diversification away from a single currency, a decision measured in decades, not in basis points.
Their bid is the floor under the floor. Had they reversed alongside the others, gold wouldn’t have corrected to $4,000 — it would have kept going under the weight of positive real yields. The structural buyer is the reason this reads as a drawdown and not a regime break.
Why it fell — and why it didn’t collapse
The trigger sits in the rates complex, not in gold itself. The hawkish Warsh pivot repriced the path of policy and pushed real yields above 2% — and gold, which pays no coupon, competes directly with the real return on cash and Treasuries. When real rates were falling, the three price-sensitive pillars masked that sensitivity. Once they reversed, the metal was marked straight to the real-rate line.
That is the asymmetry worth holding in mind: the price-sensitive pillars decide the amplitude of the move, but the central-bank pillar decides whether there’s a floor at all. Three cracked, one held — a correction, not a collapse.
Two wave counts, one chart
Step back to the monthly structure (Figure 2) and the move resolves into a clean five-wave advance off the 2005 base: wave (1) into the 2011 high, the long (2) correction into 2016, the powerful (3) into early 2026, and the current pullback as (4). From here the same chart supports two readings, and they could hardly be further apart.
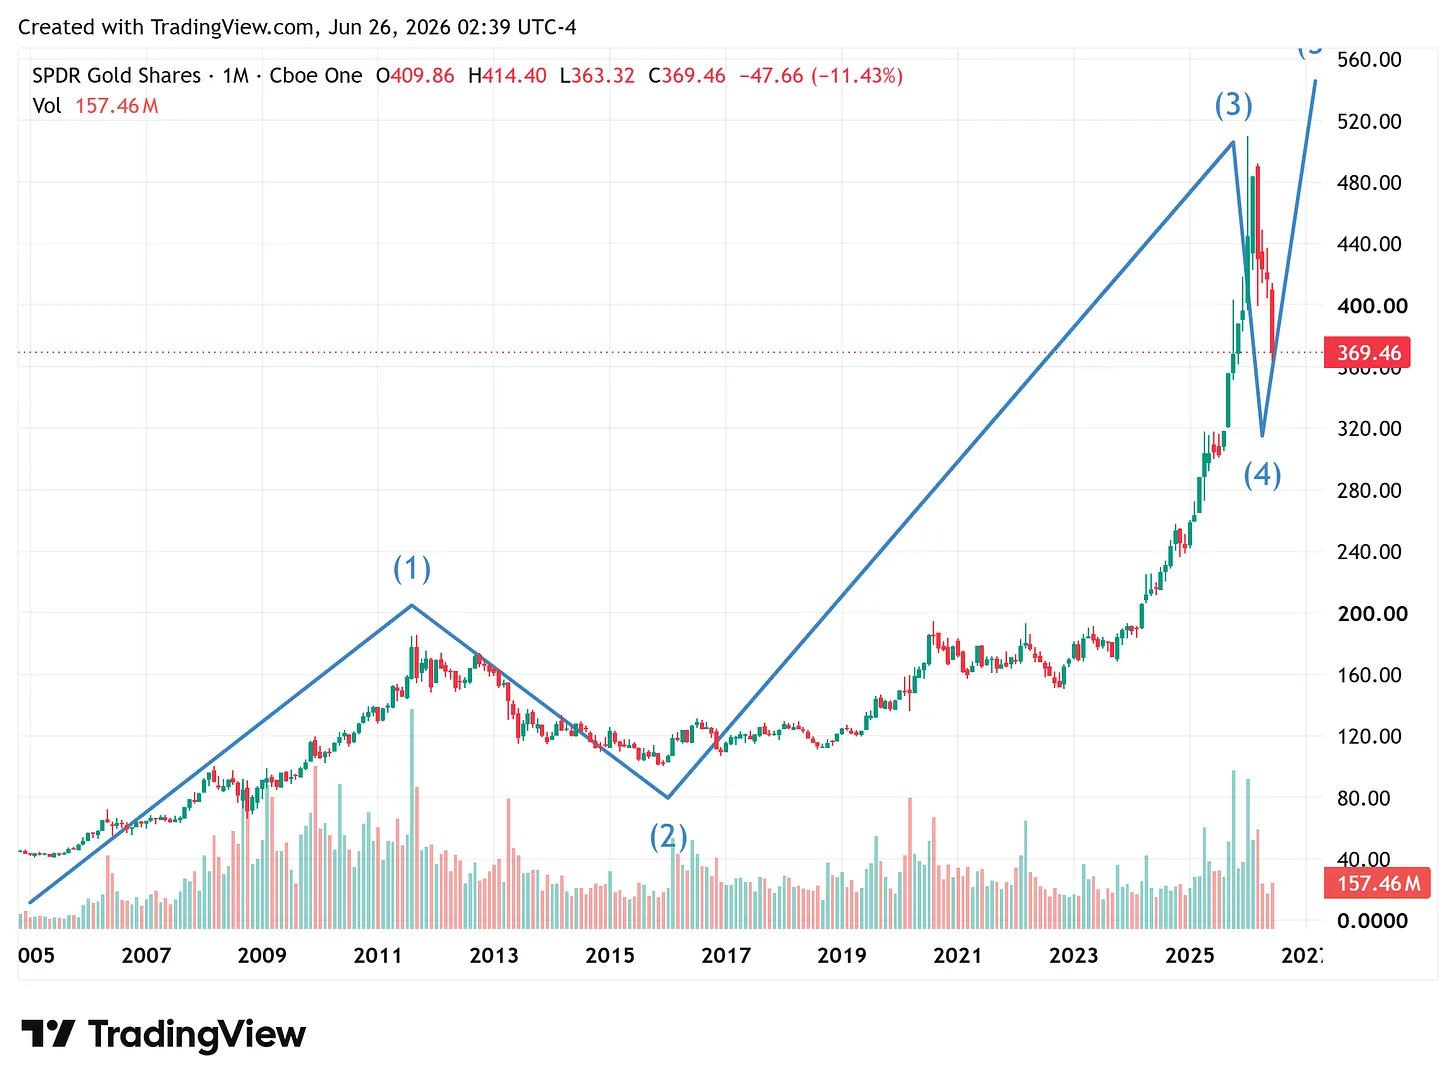
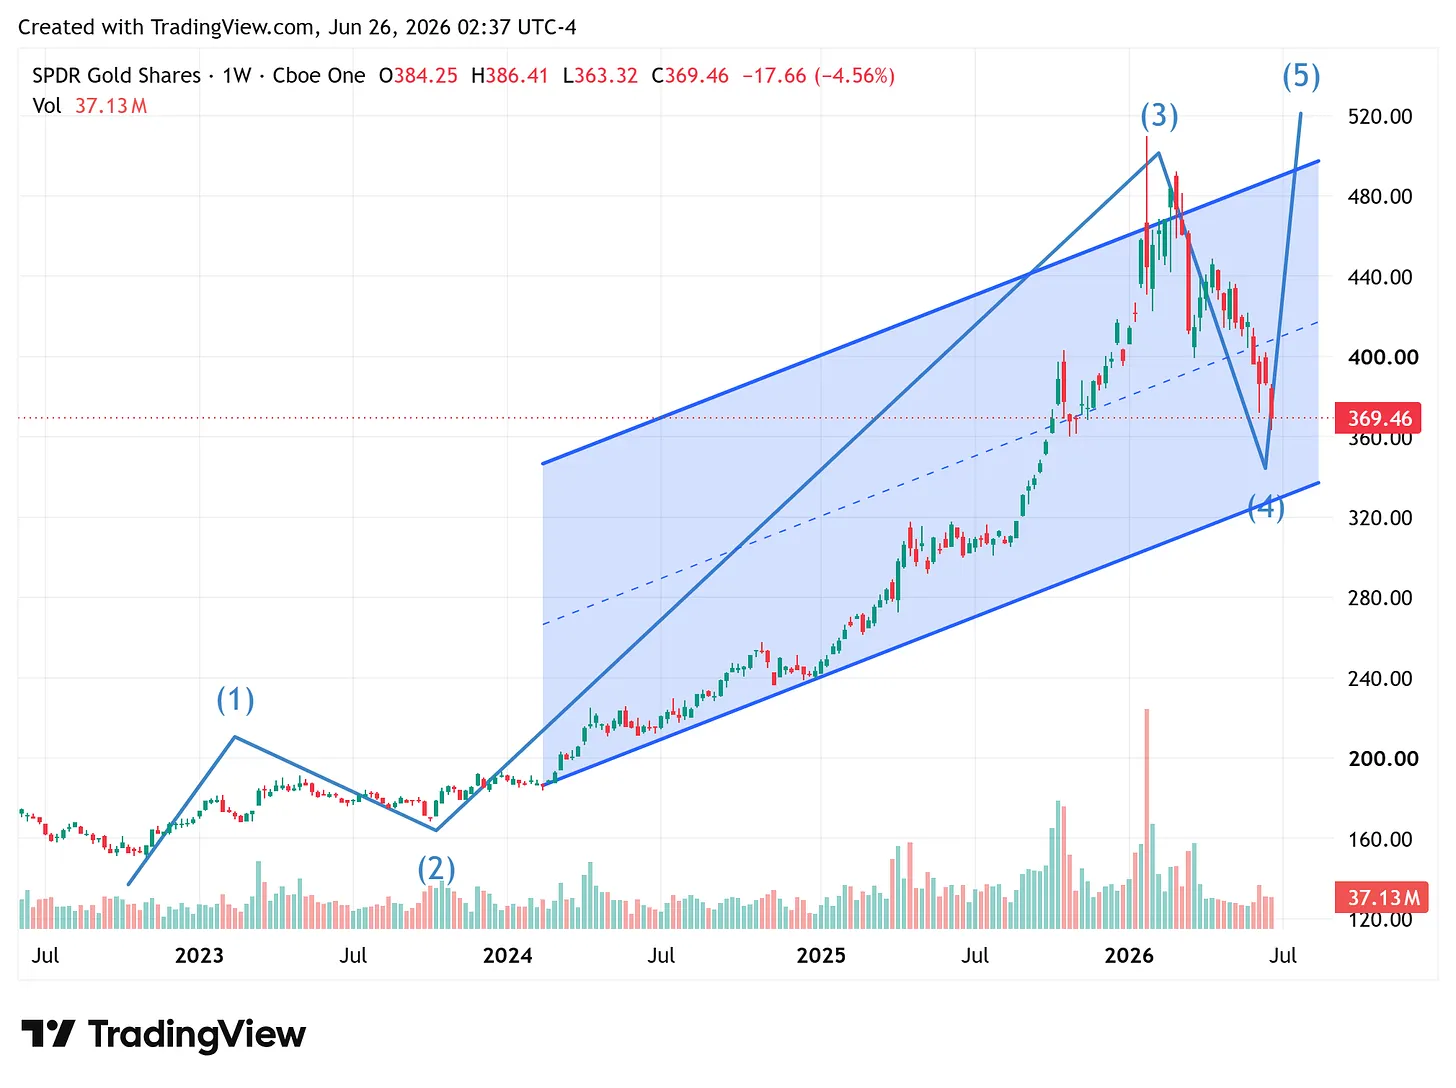
The bull count. Wave (4) is an ordinary multi-month correction inside an impulse that is still running. A fifth wave up follows, and the bull market that began in 2022 is not over. The weekly view (Figure 3) backs it: price is still inside its 2022 ascending channel and the (4) low has held the lower rail near 345–360. Targets sit back toward and through the (3) high.
The bear count. The entire 2022–2026 advance was itself a completed five-wave sequence, and what looks like a small wave (4) is the opening of a wave 4 of a much higher degree — a correction one full order larger, the kind that runs for years rather than months. The precedent is on the same chart: the last same-degree correction, wave (2), took roughly four to five years (2011 to 2016) to play out.
The two pillars of this note lean toward the bull count without settling it. The intact central-bank bid is the fundamental analogue of “wave (4), not a secular top” — a structural floor under the correction. But the bear count doesn’t need that floor to break: a higher-degree wave 4 can grind sideways-to-lower for years even while official-sector buying continues, exactly as gold chopped from 2011 to 2016 while the long bull stayed intact underneath. Same chart, same floor, two timelines. This is a map of the possibilities, not a call on which one prints.
Which of the two unfolds isn’t, in the end, a chart question — it’s a macro-regime one. The variable that decides it is the path of real rates, and that turns on how sticky inflation proves to be. If the inflation impulse behind the Warsh pivot is transitory, the real-rate pressure that did the damage eases and the bull count — wave (4) into a fifth wave up — comes back into play. If inflation is sticky, higher-for-longer real rates feed the bear count and its multi-year, higher-degree correction. Our preferred scenario is the transitory one — but that remains to be seen, and the diary holds both counts until the regime declares itself.