C+

Daily Pulse · · 09:00 CET · signal · XSD

A semiconductor chip on a glowing red circuit board, with a red descending candlestick chart and a downward arrow sweeping across a dark world map — illustrating a semiconductor-led, global risk-off session

Semis Crack, AI Weakens, Risk Assets Slip Together

Semiconductors stopped leading and started warning. The 10 June US session was a synchronised de-risking day — semis, AI and global tech lower together, and the usual diversifiers offered little shelter. The line in the sand is XSD 577–580.

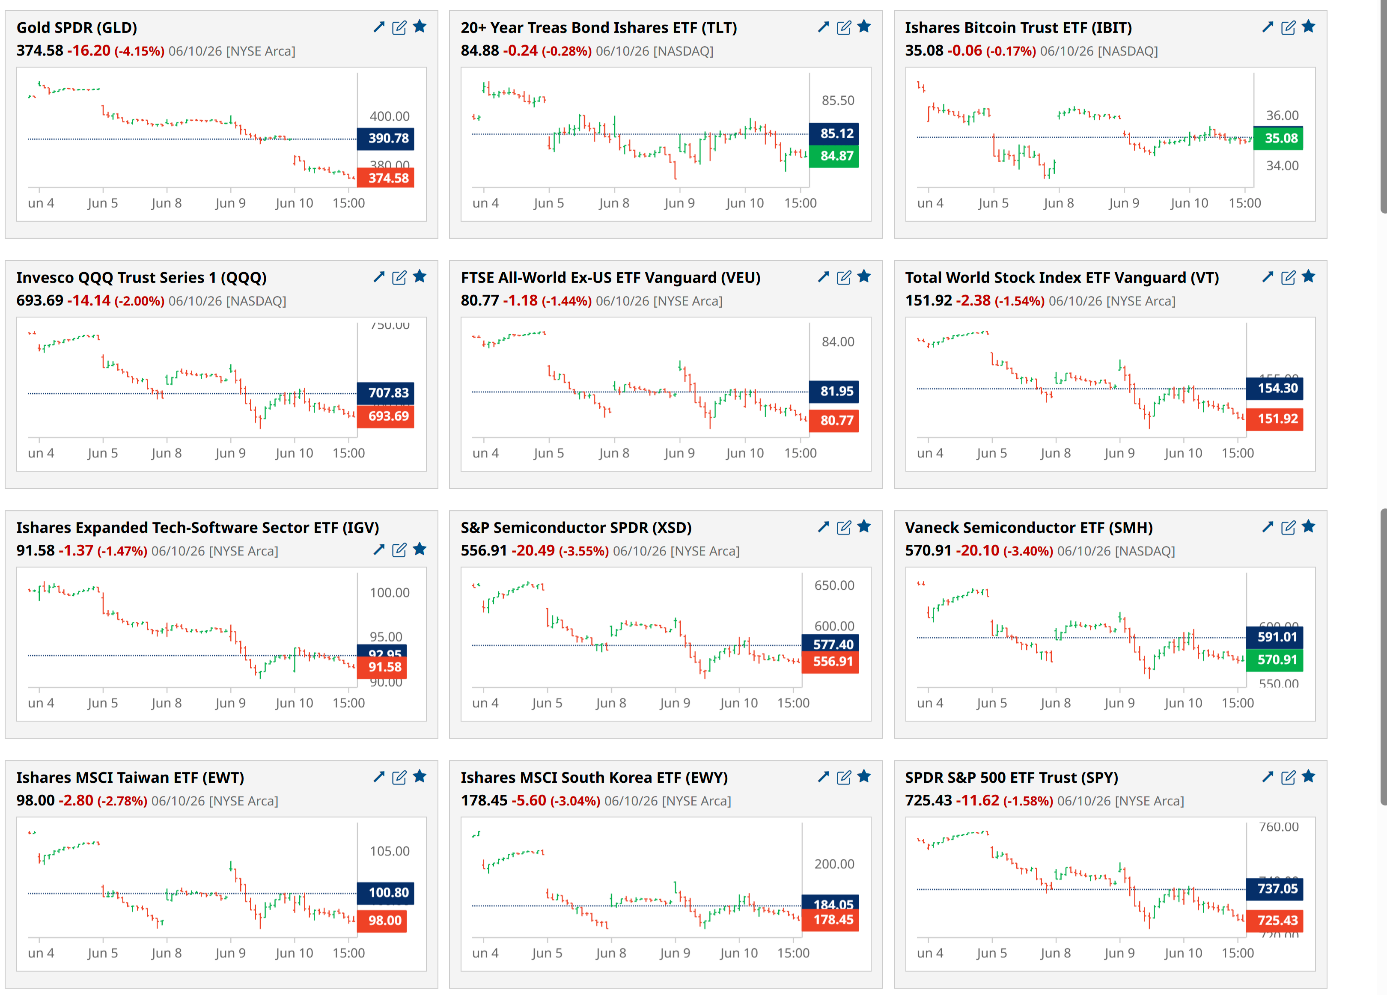
The session read risk-off, led by semiconductors and AI. The watchlist closed broadly red, with the heaviest pressure in semis, AI/tech, gold, Korea, Taiwan and the Nasdaq. This looked less like isolated weakness and more like a synchronised de-risk across growth, global equities and the prior leaders.

A grid of ETF mini-charts into the 10 June 2026 close, nearly all red: Gold (GLD) -4.15 percent, 20-plus year Treasuries (TLT) -0.28 percent, Bitcoin (IBIT) -0.17 percent, Nasdaq (QQQ) -2.00 percent, Total World (VT) -1.54 percent, S and P 500 (SPY) -1.58 percent, Semiconductors (SMH) -3.40 percent, Taiwan (EWT) -2.78 percent and Korea (EWY) -3.04 percent — a broadly red watchlist showing synchronised de-risking
Figure 1. The watchlist into the 10 June close — broadly red, with semis, Asia tech, gold and the Nasdaq all lower together. Source: Barchart.

Semiconductors: leadership under pressure

The semiconductor complex — the engine of the AI build-out — is where the pressure was heaviest. XSD closed at 556.91, down 3.55%. The daily chart shows a sharp failure from the recent high near 650–670, with price now sitting below the key horizontal level around 577.40.

Daily candlestick chart of the S and P Semiconductor SPDR (XSD) into 10 June 2026, last 556.91 down 3.55 percent: a long uptrend from mid-2025 that has failed sharply from the 650-670 high, price now below the 577.40 horizontal level with support marked near 524 and 500; the lower-panel Slow Stochastic (14,3,3) has rolled down from overbought to the mid-zone near 36
Figure 2. XSD failed from the 650–670 high and now sits below 577.40; the Slow Stochastic has rolled over but is not yet washed out. Source: Barchart.

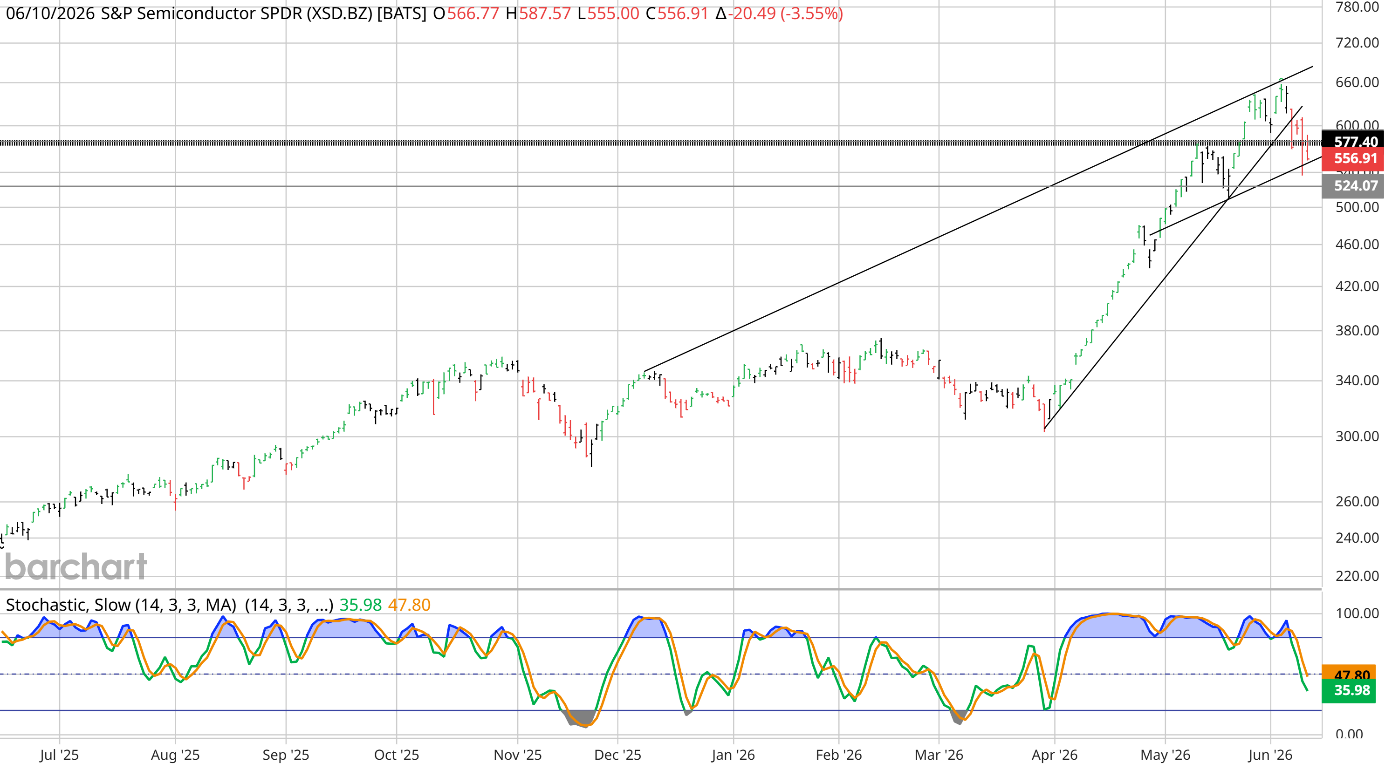
That 577 level now matters:

  • Below 577: momentum has shifted defensive.
  • Next support zone: roughly 540–524.
  • A clean loss of 524 would suggest the April–June advance is undergoing a deeper reset.
  • Back above 577–580 would be the first sign the breakdown is being repaired.

The slow stochastic has rolled down from overbought and now sits in the mid/lower zone, but is not yet washed out — the sector is weaker, but not yet deeply oversold. The read-through: semiconductors are no longer acting as clean leadership. They are now the key risk barometer.

Cross-asset: broad selling, little shelter

The rest of the watchlist confirmed a broad risk-off session:

AreaETFMoveMessage
SemiconductorsXSD−3.55%Sector breakdown pressure
SemiconductorsSMH−3.40%Mega-cap semis also weak
AI / TechAIQ−2.85%AI theme under pressure
KoreaEWY−3.04%Semis / export beta weak
TaiwanEWT−2.78%Asia tech supply chain hit
NasdaqQQQ−2.00%Growth de-risking
S&P 500SPY−1.58%Broad market selling
World equitiesVT−1.54%Global weakness
GoldGLD−4.15%No safe-haven bid today
BondsTLT−0.28%Mild weakness, not a risk-off hedge
BitcoinIBIT−0.17%Relatively resilient

The notable point: gold sold off harder than equities, and TLT did not rally. So this does not look like a classic flight to safety. It looks more like liquidity pressure, a positioning unwind and a broad asset repricing — with Bitcoin, notably, among the more resilient.

Three intraday charts into 10 June 2026 — Russell 2000 (IWM) -1.04 percent, iShares Europe 350 (IEV) -1.23 percent, and GX Artificial Intelligence and Tech (AIQ) -2.85 percent — small caps, European large caps and the AI theme all sliding into the close
Figure 3. Small caps (IWM), European large caps (IEV) and the AI theme (AIQ) all slid into the close — the weakness was broad, not just mega-cap semis. Source: Barchart.

The tactical read

Bias: defensive until XSD reclaims 577–580. For now, the pulse says risk appetite is deteriorating: semiconductors and AI are leading lower, global tech proxies are confirming, and the traditional diversifiers are not giving strong protection. Our market-structure read has flagged the same short-term cracks under an otherwise still-intact bull.

The key line in the sand is XSD 577–580. As long as XSD stays below that area, rallies read as repair attempts — not confirmed trend resumption.

What we’re watching next:

  • XSD 540–524 — the support test zone.
  • XSD 577–580 — the reclaim level.
  • SMH 591 — the matching mega-cap semis reclaim level.
  • QQQ 707–708 — the broken reference area.
  • EWT / EWY — whether Asia semis stabilise or keep leading lower.