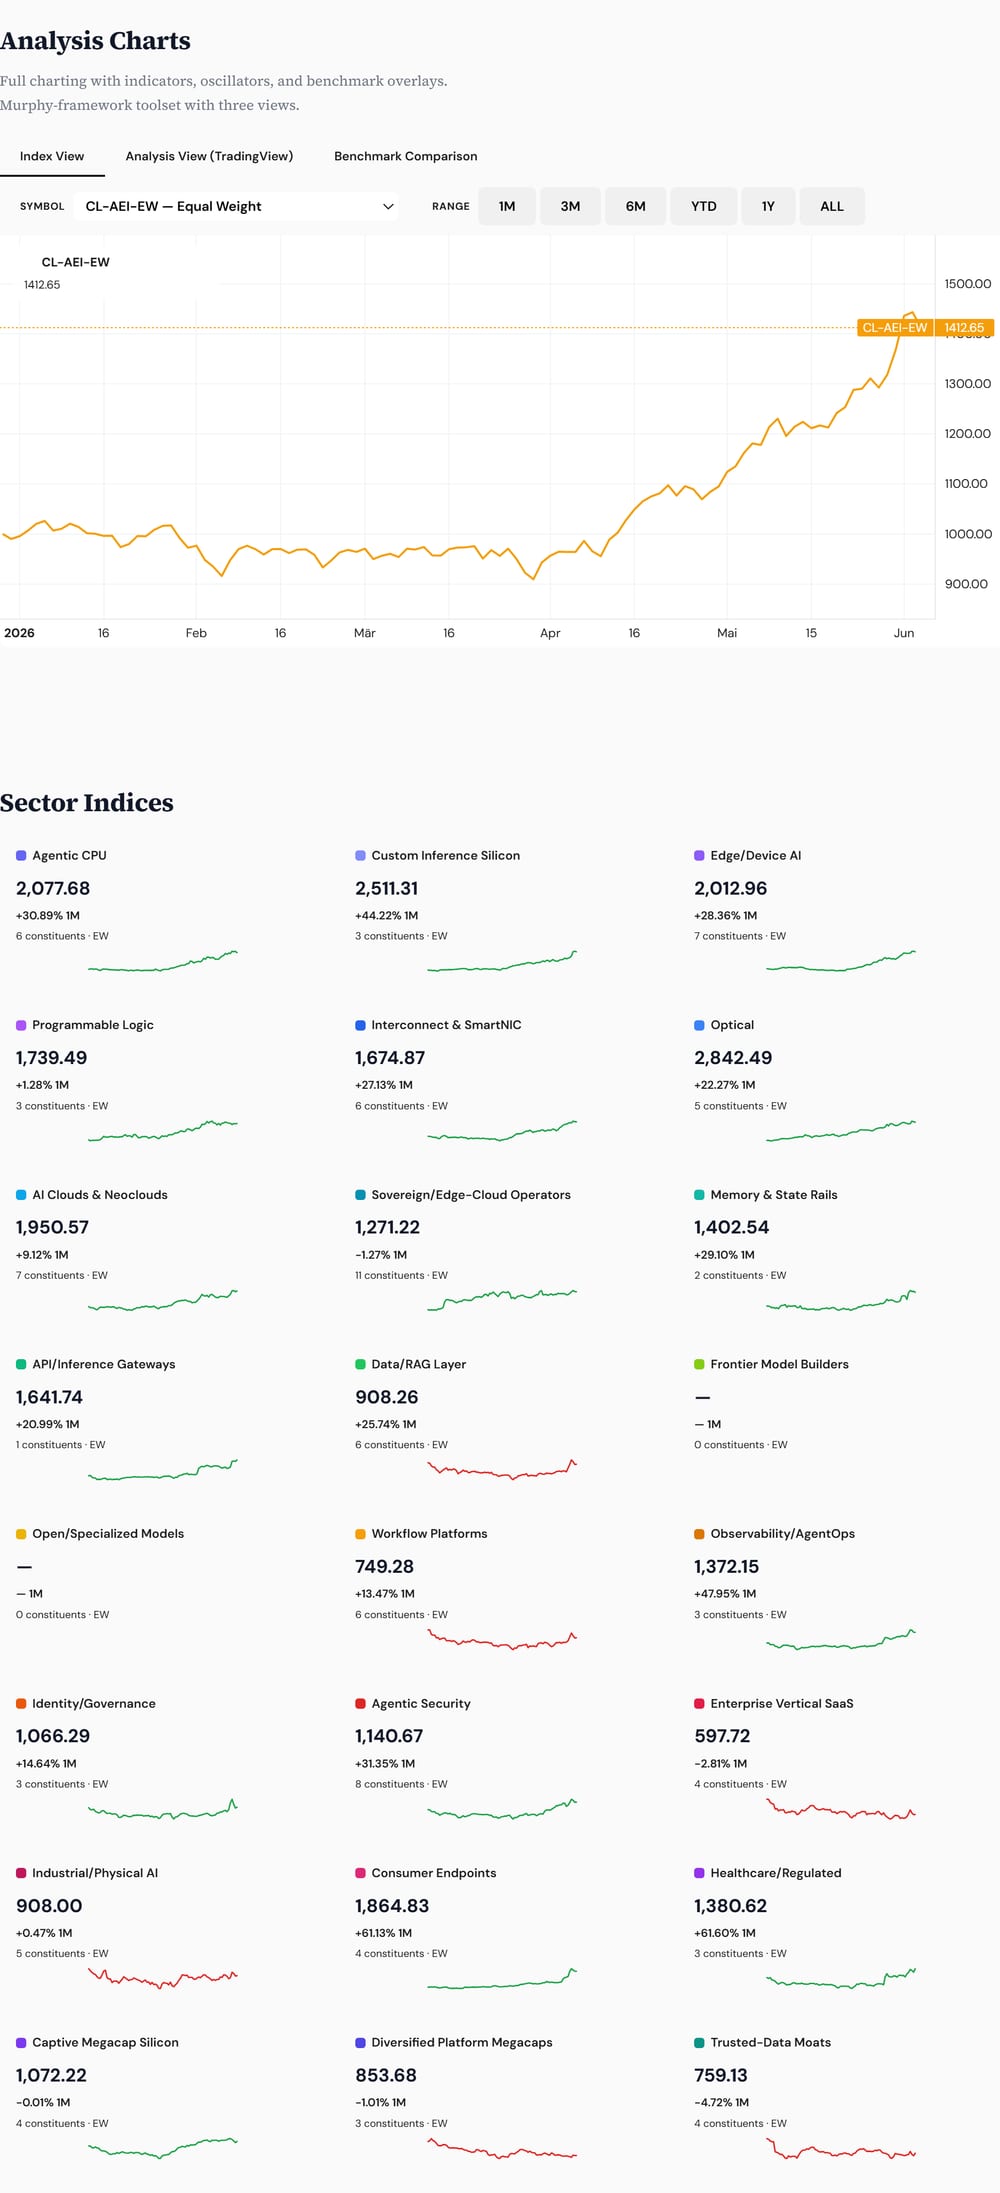
Daily Pulse · · 20:00 CET · market · XSD

The breadth warning has become price confirmation. This leg of the semiconductor bull is over — not the structural story, the parabola.
On Tuesday, 02 June I wrote that the troops were leaving before the generals — arguing for a short-term top in semiconductors. The signal was XSD, the equal-weight semiconductor ETF, which had stopped confirming the mega-cap-led advance while SMH kept climbing.
That warning has now turned into price confirmation.
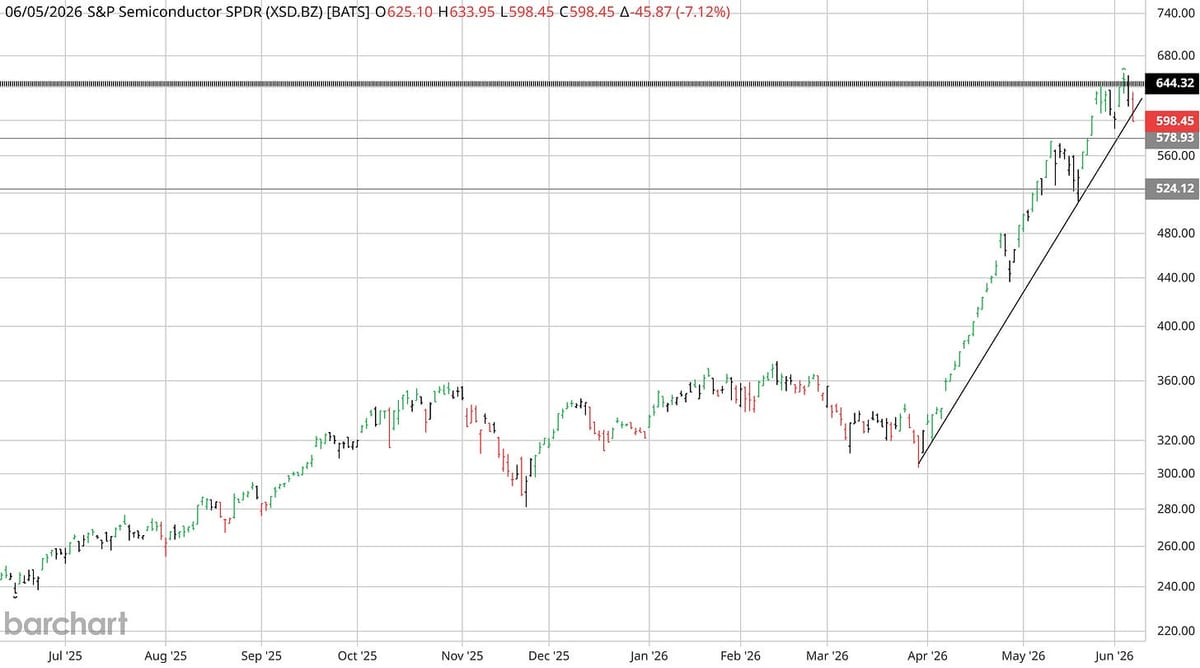
The channel has broken
XSD is breaking down hard today, testing — likely breaking — the steep upward channel in place since the late-March low. Last 598.45, down −7.12% on the session. If that break holds into the close, the April–June leg of the second-tier semiconductor bull should be treated as over.
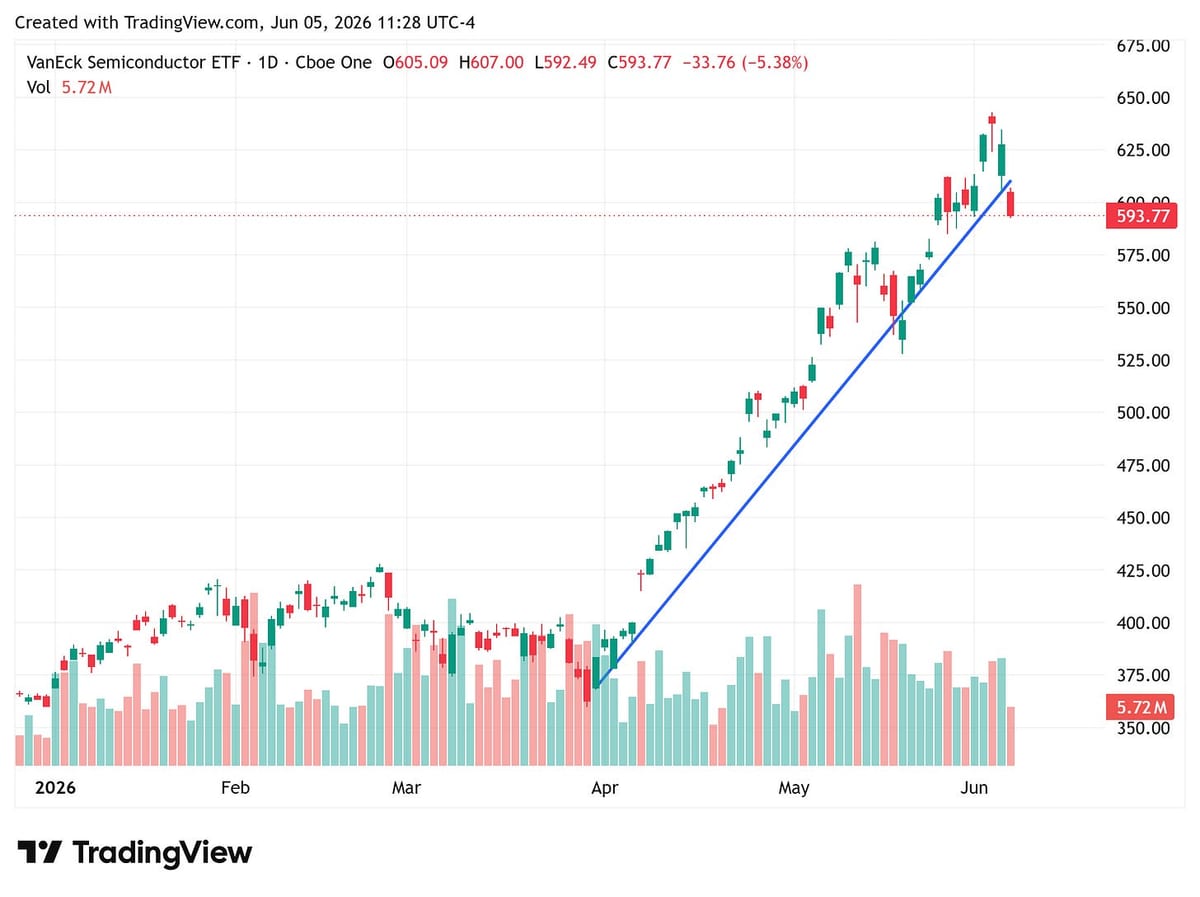
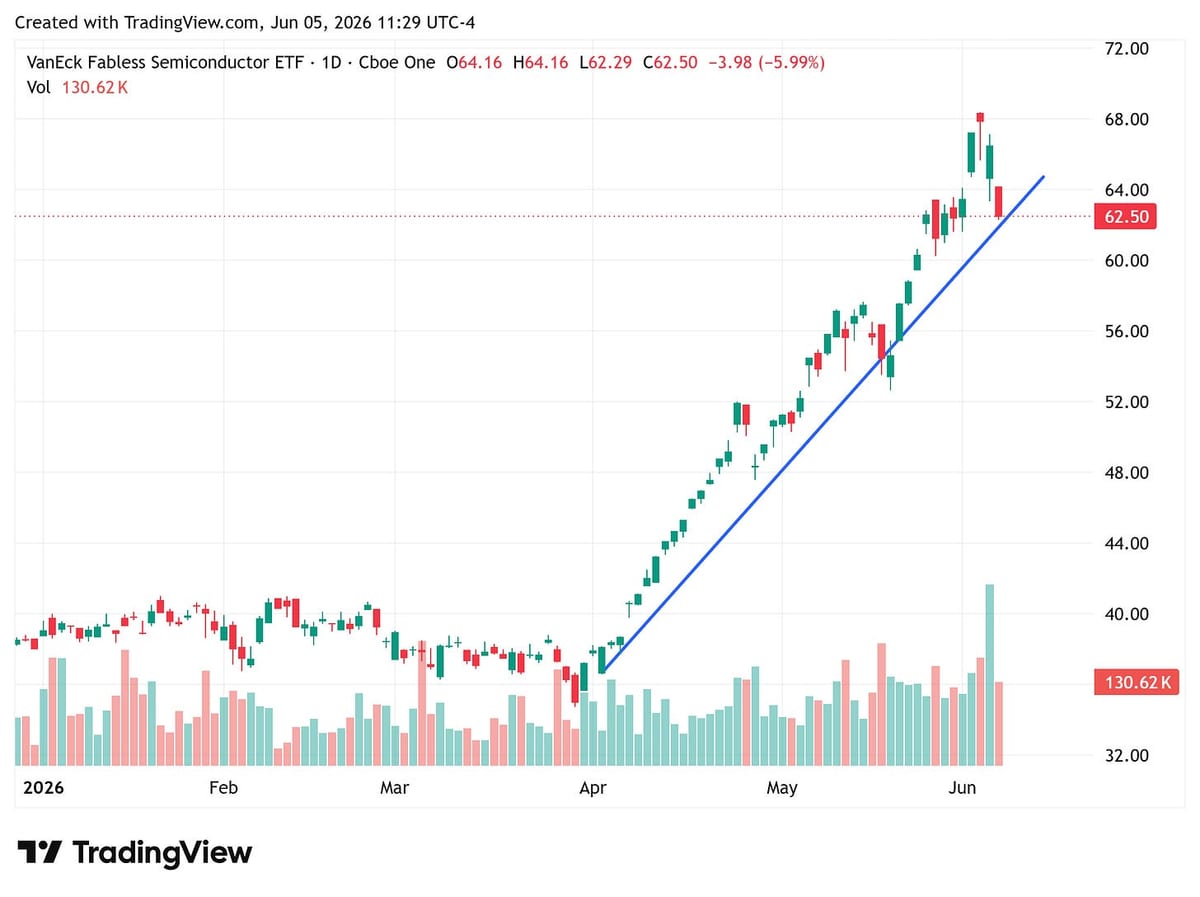
And the generals are no longer holding the line. SMH — the cap-weighted complex carried by the mega-caps — is down −5.38%, now testing its own April-low trendline. SMHX, the fabless basket, −5.99%. The Tier-1 names that carried the advance have started to follow the second tier down.
The parabola breaking, not the story ending
To be precise about what this is and is not: this is not the end of the structural semiconductor story. It is the end of the parabolic leg in the weaker, broader — and potentially the mega-cap — part of the complex.
The next support is around 580. Below that, the larger support zone sits near 520. Those are the levels that matter now.
A bounce next week would be normal after a move like this — but the character of that bounce is what matters. I would not expect a clean new all-time high from here. The more likely path is a failed rally below the prior high, then a second leg lower: a classic A–B–C corrective structure — first break, relief bounce, then another decline.
The market may give semis another attempt. But unless XSD quickly recaptures the broken channel and breadth improves, that attempt should be treated as a retest, not a restart.
The generals looked fine a little longer than the troops. The troops have now confirmed the retreat — and the generals have followed.
Where I’ll buy the weakness
Downside beta instability will be my key indicator for selecting where to buy into the weakness — which names expand their downside participation least when the selloff comes. That toolbox is now live on closelook.net: upside and downside beta for every name we cover. And I expect the agentic-winner narrative to provide the most immediate upside on the other side of this correction.