Weekly Chart Pick · 2026-11-13
IT Services — the consultant AI was meant to replace doubles from its June low and breaks its downtrend
Between February 2025 and June 2026 this stock lost 69% on one fear: that AI agents would do the work its several hundred thousand consultants bill for. Since the low it has doubled, crossed the line that capped every rally for twenty months and now stands at the floor it held in 2022 and 2023. The chip stocks went the other way.
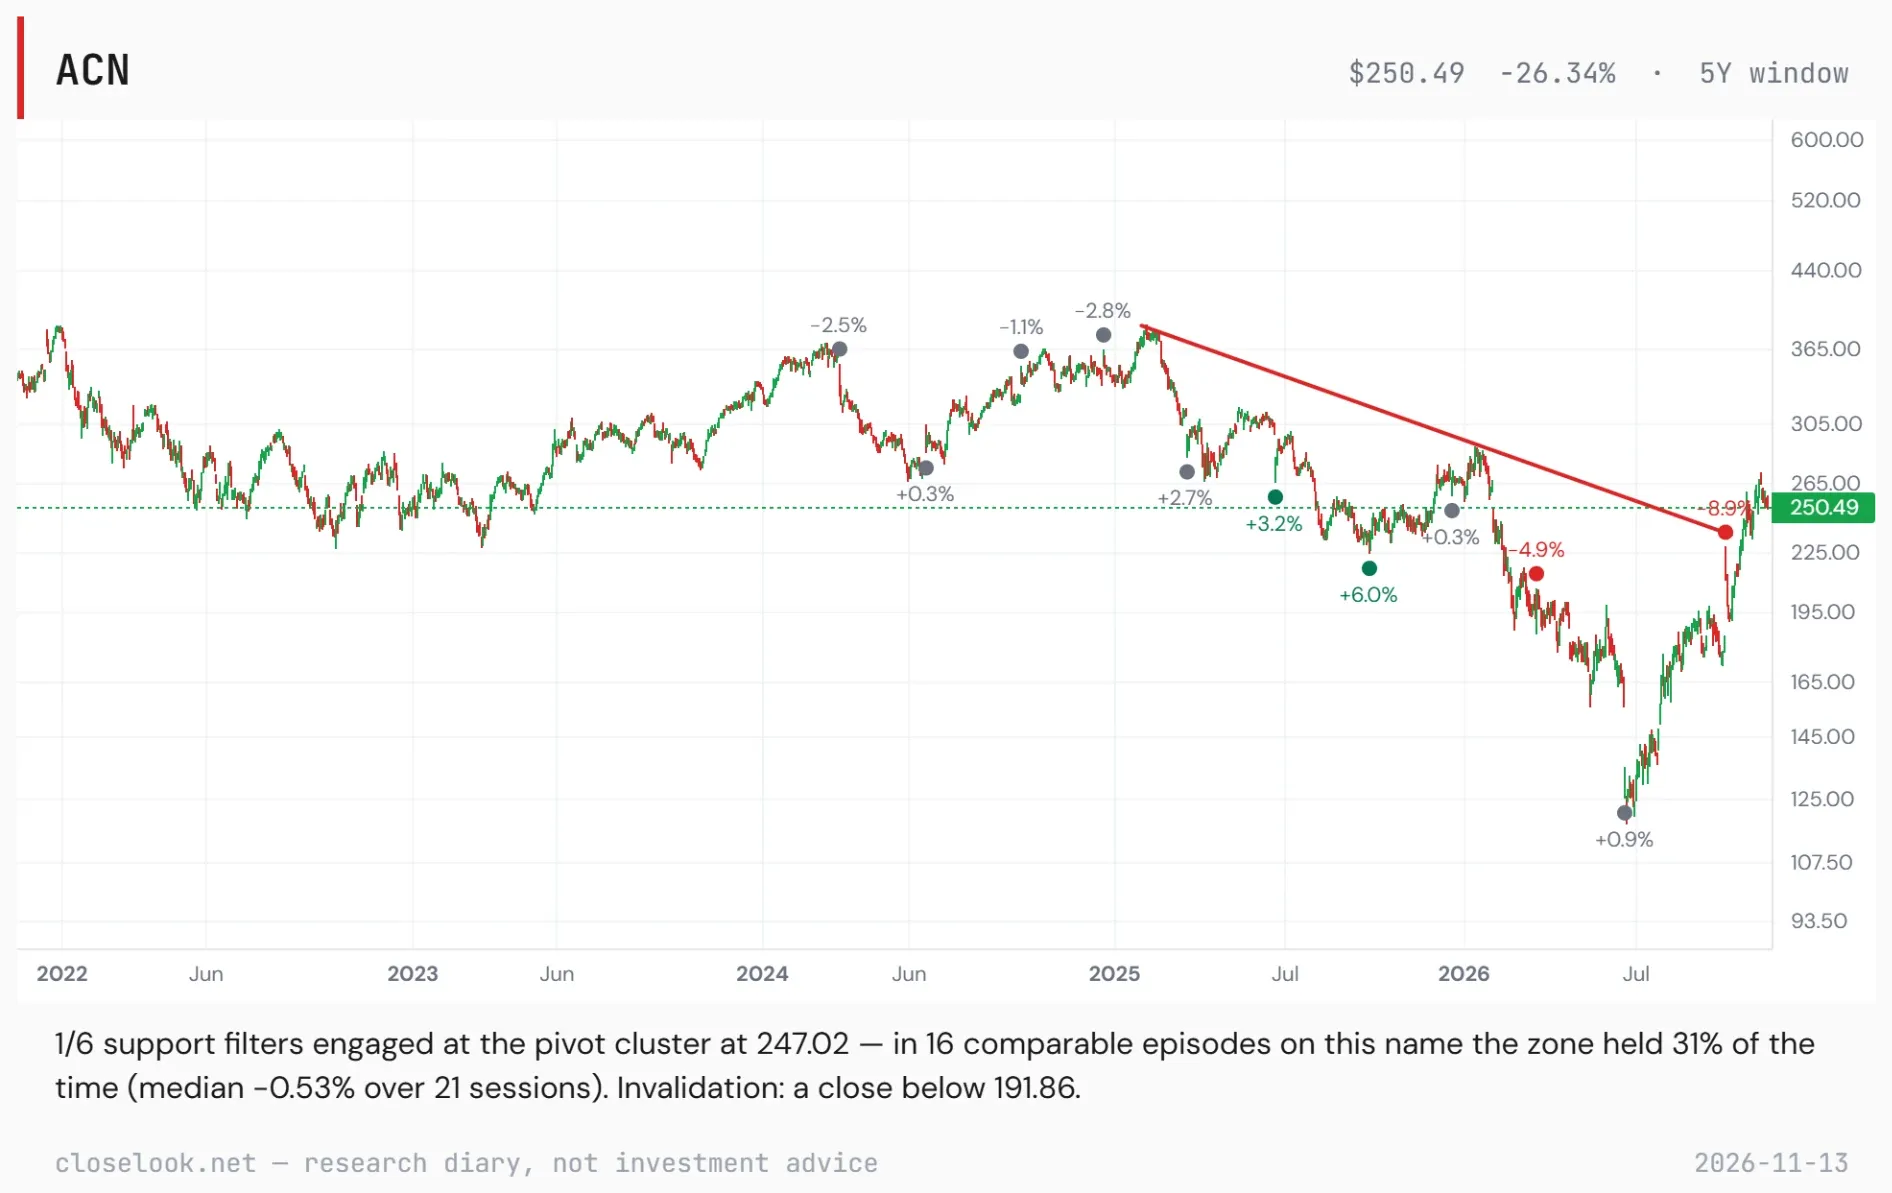
- Downtrend broken: the line from the February 2025 high over the January 2026 high capped every rally for twenty months. The stock closed above it in mid-October and has stayed above it for four weeks.
- Doubled from the low: the lowest close was $124.44 on 30 June; Friday's close of $250.49 is 101% above it and still 37% under the 2025 high of $398.25.
- Two reports turned it: on 18 June falling new orders and a lower forecast cost 18% in one day; on 1 October revenue above the company's own range and record orders for the year brought +15.8% in one day.
- At an old floor, in the middle of its channel: $246 to $250 is where the stock bottomed in 2022 and 2023, and it is the middle line of the rising channel the stock has followed since June. The high of the move is $265.16 on 5 November.
- The sector moved with it and the chip stocks against it: since 30 June EPAM is up 106%, Cognizant 63% and Capgemini 45%, while the chip fund SOXX is down 30%. The group is now pausing after that move; we read it as a consolidation and expect it to continue higher.
- An AI user, not an AI builder: the company is in our AI Users index, among the firms that install AI at their customers. It trades at about 17 times the earnings it forecasts for this fiscal year.
ACN Accenture last close 249.95 (2026-11-12)
The Setup
The claim: the market priced this company as a victim of AI, and since June it has been taking that back. From February 2025 to June 2026 the stock lost 69%. The fear was simple: the company sells the working hours of about 800,000 people, and AI agents can do part of that work. In June the fear looked confirmed, when new orders fell and the company stopped reporting its AI orders separately.
What changed. In October the company reported record orders for the year, forecast growth of 3% to 6% and told investors that AI adds more work than it removes. Someone has to install the agents, connect them to old systems and answer for the result. That is the diary's reading of the numbers, and it is why the name sits in our AI Users index and not on a list of AI losers.
The chart says the same. A downtrend that held for twenty months is broken, and the stock has doubled from its low. The damage is not repaired: the stock is 37% under its 2025 high and 13% under its January high. A doubling in four and a half months also leaves room for a setback, which is why the levels matter more than the direction.
The other side of the same trade. Since 30 June the chip fund SOXX has lost 30%, while this stock gained 101% and its peers between 17% and 106%. Money left the companies that build AI capacity and went to the companies that put it to work. On Friday the chip fund fell 3.7% and this stock rose 0.2%. On the week it is 3.8% lower and still above the line it broke.
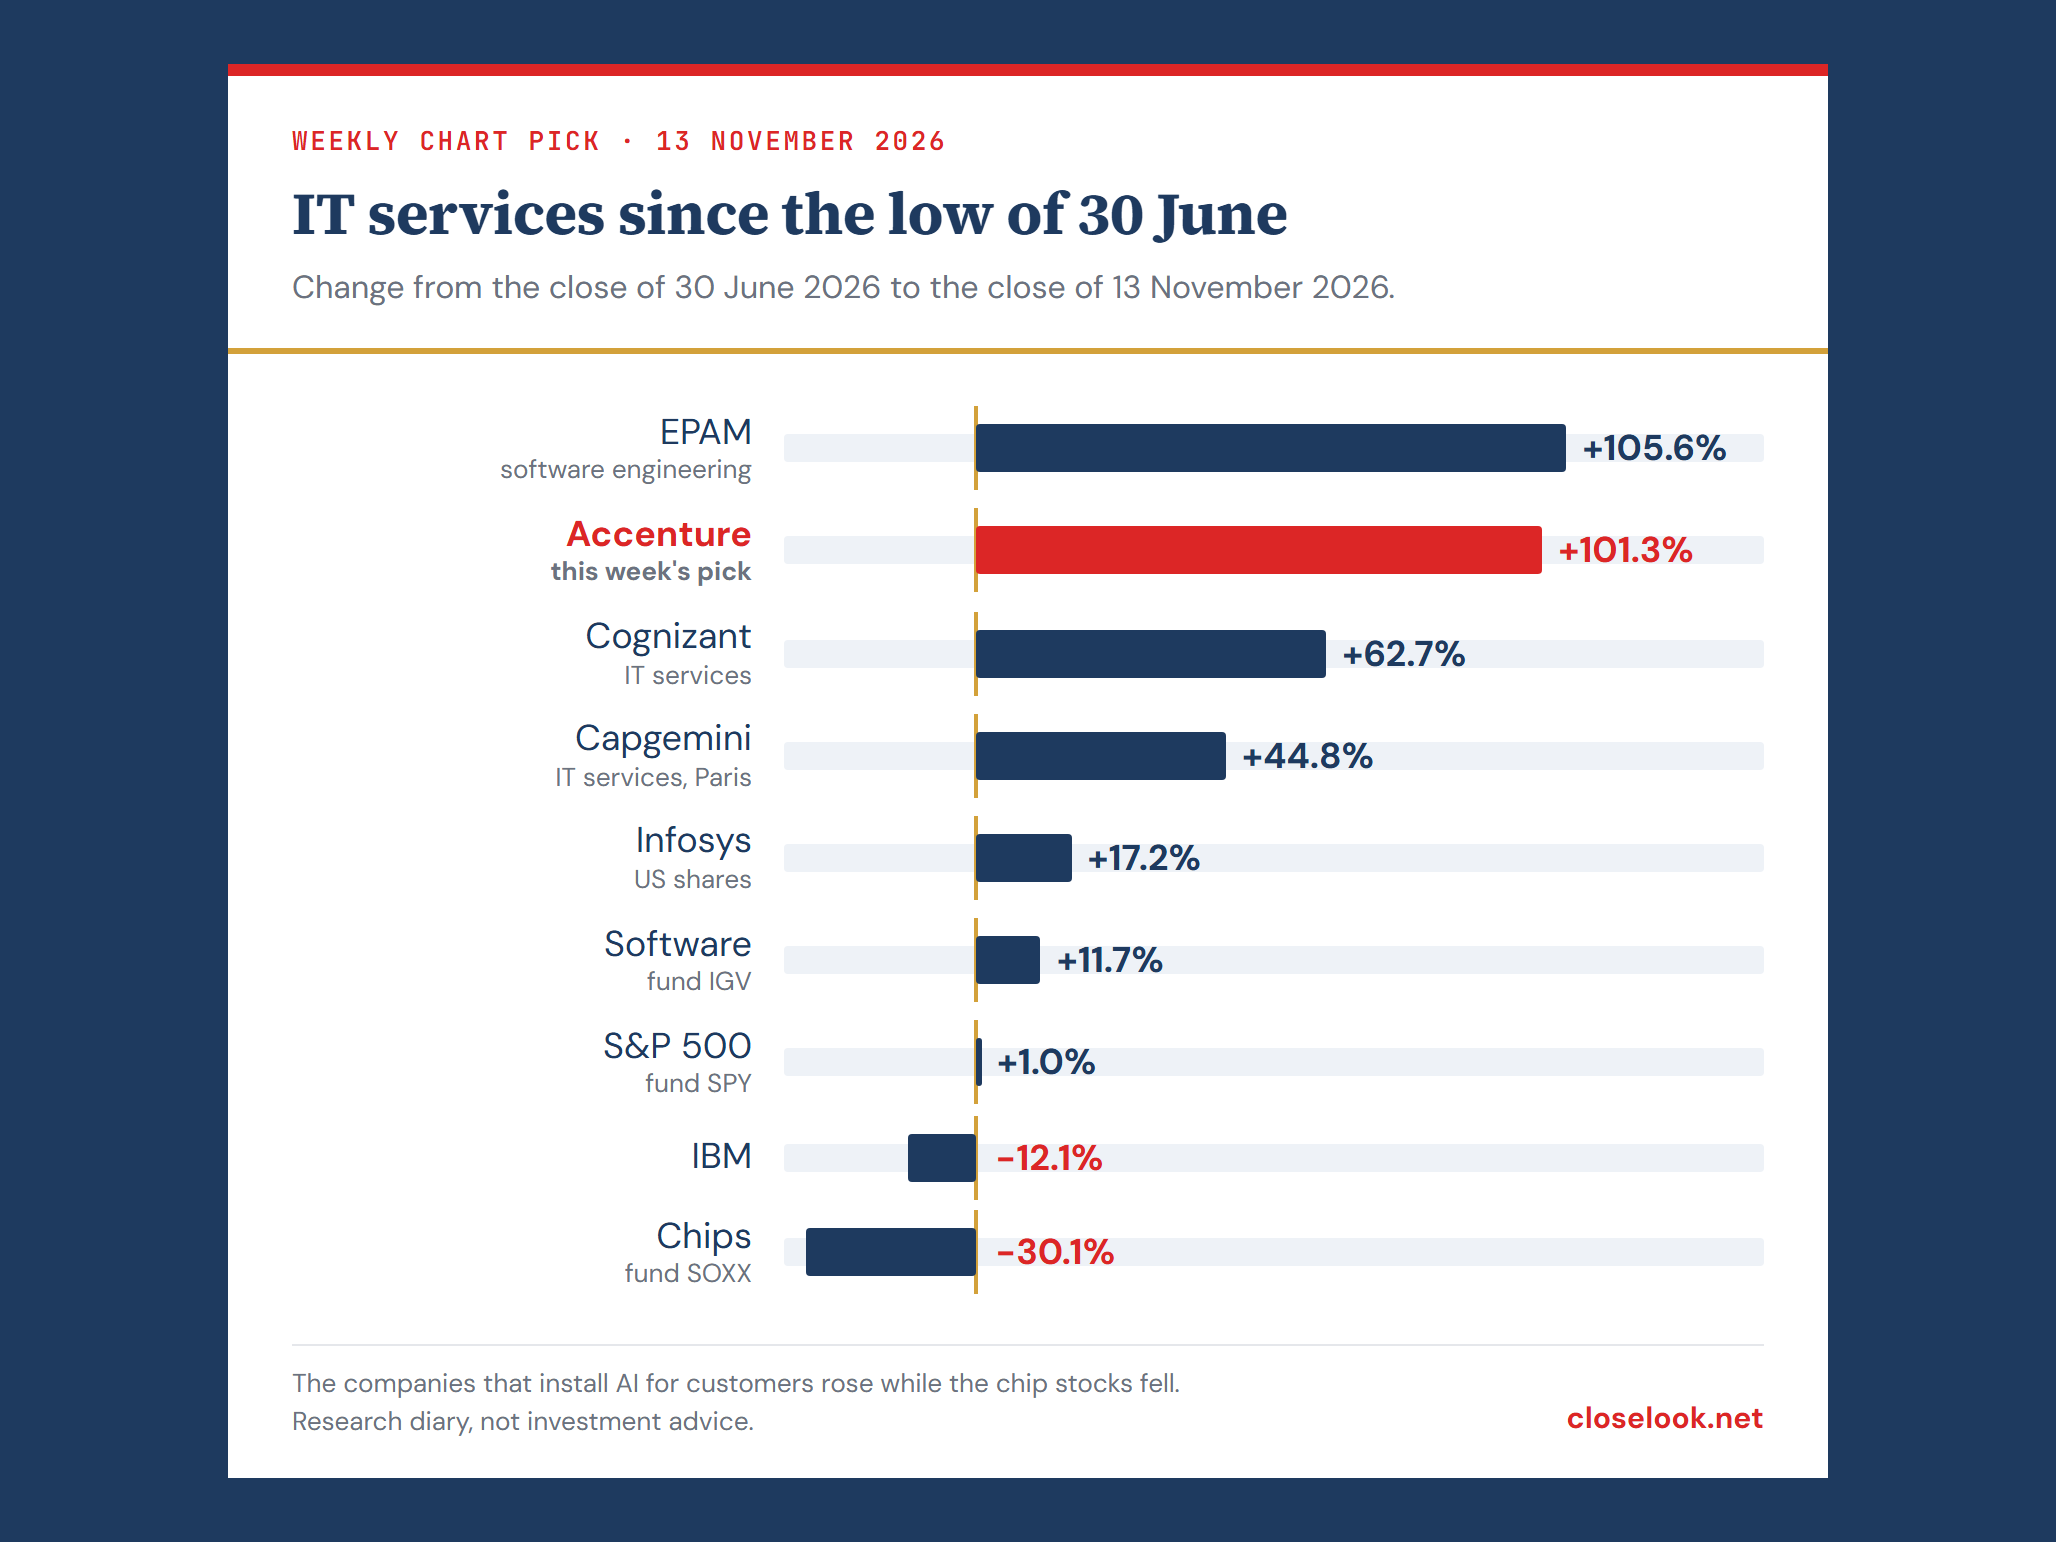
A group in a pause. After the move since June the group is consolidating. This stock is 5.5% under its close of 5 November, Cognizant 5.3% and Capgemini 2.4%. The editor reads that as a rest after a large move, not as its end, and expects the group to continue higher.
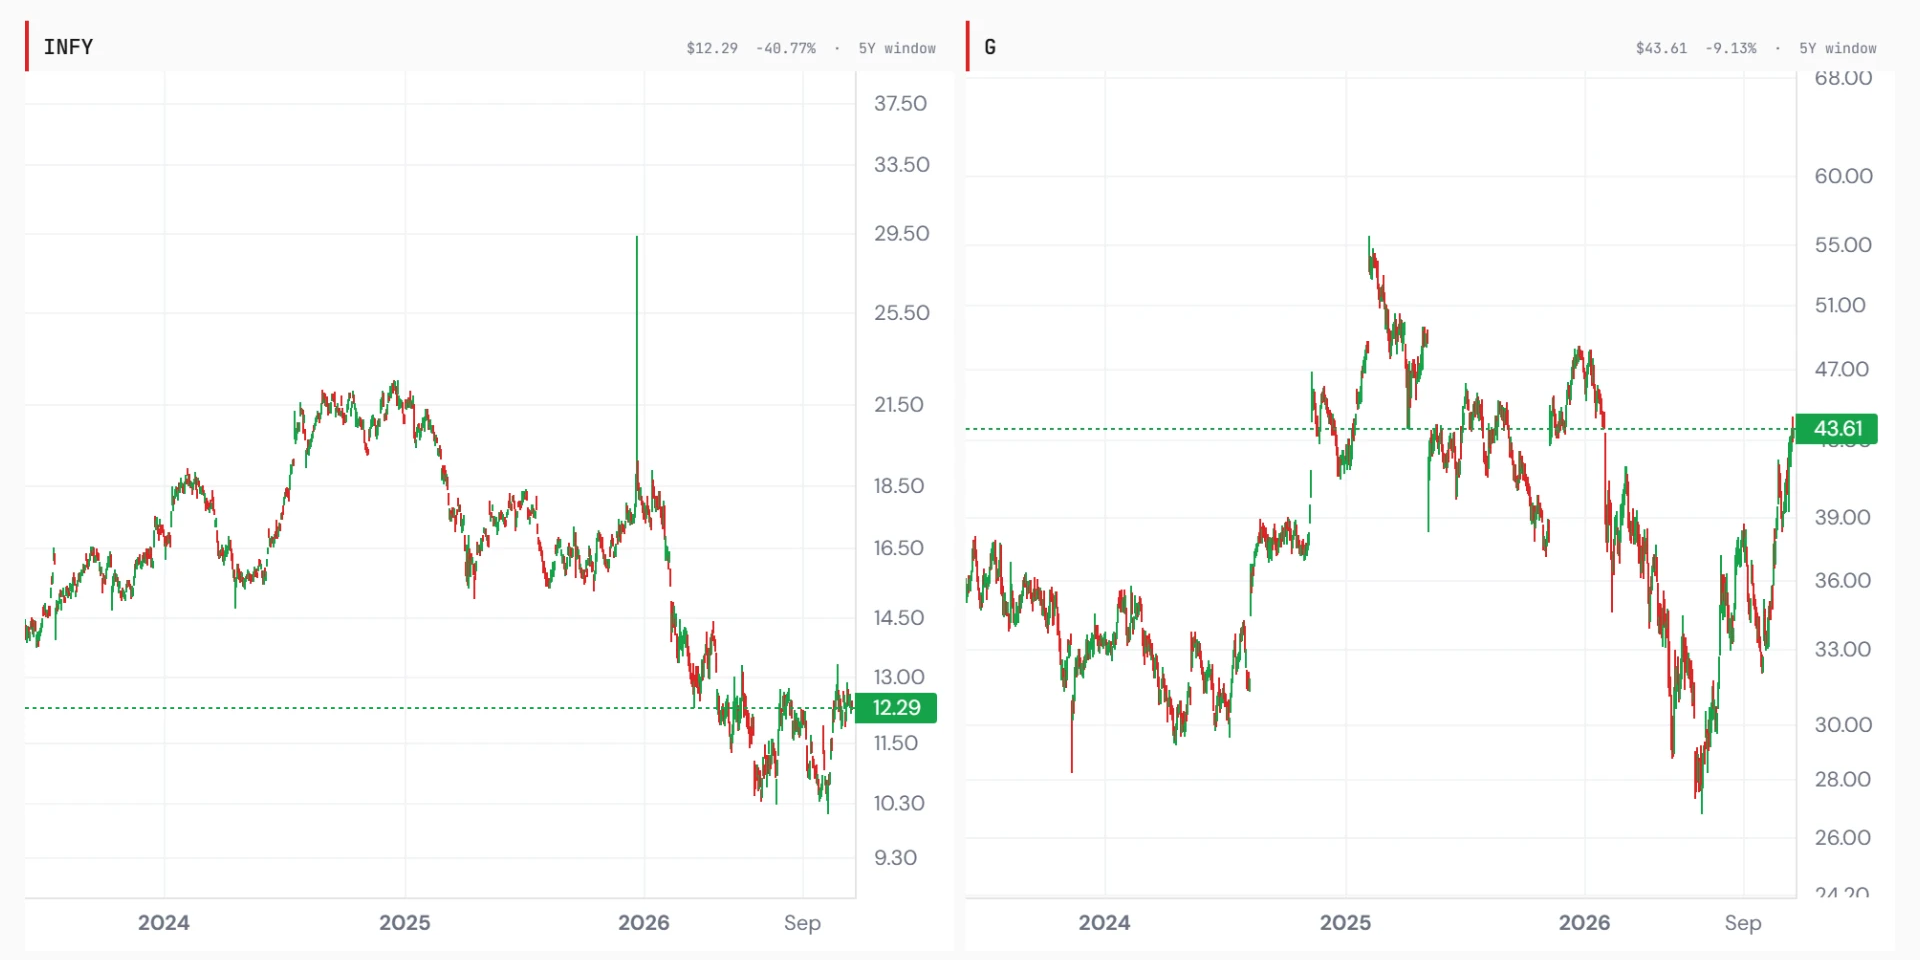
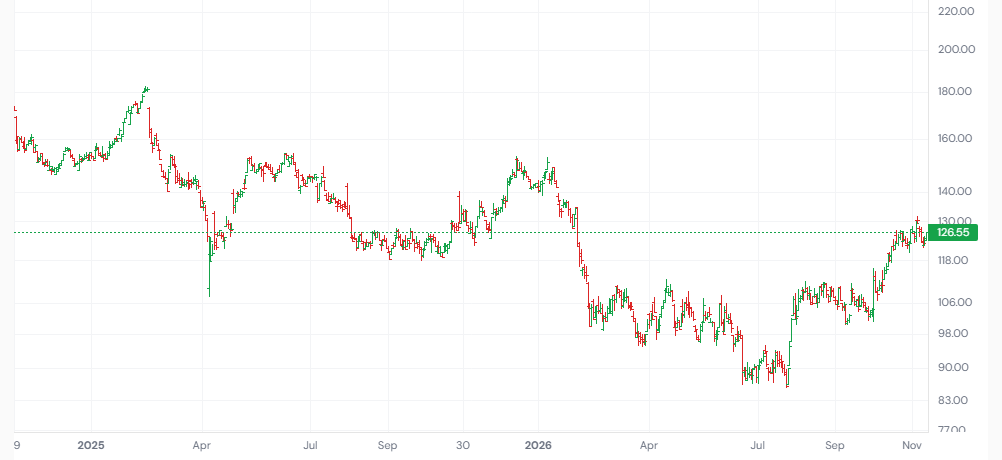
Not the whole sector. The recovery is uneven. Genpact, which runs business processes for large companies, closed Friday at $43.61, its highest close since the low and 59% above its close of 30 June. Capgemini in Paris stands at €127.40, 48% above its low of 23 July and 2.4% under its high of 5 November. Infosys is the other case: its US shares made a new low as late as 8 October, at $10.12, and stand at $12.29, 17% above the June close and 31% lower on the year. The split inside the sector is almost as wide as the one between the sector and the chip stocks.
In the Closelooknet readings
Said plainly: this is Accenture (NYSE: ACN), the consulting and IT services company with about 800,000 employees that advises large companies and public bodies, builds their systems and runs parts of their operations. It is a member of our AI Users index, in the section Implementation & Service Delivery: companies that put AI to work for customers rather than selling the chips or the models.
52-week range (closes): 124.44 – 288.54
The latest print
Last report — published Thursday 1 October before the open. Fourth-quarter revenue of $18.68 billion against about $18.03 billion expected, above the company's own range of $17.75 to $18.40 billion, and earnings of $3.29 a share against $3.18. New orders were $22.17 billion in the quarter and a record $84.54 billion for the fiscal year. For fiscal 2027 the company forecasts revenue growth of 3% to 6% in local currency and earnings of $14.39 to $14.81 a share (company release). The stock rose 15.8% that day to $212.30 and then gave back 8.9% in three sessions.
The report before — 18 June. Earnings beat ($3.80 against $3.70), but new orders fell 2% to $19.32 billion, the growth forecast for the year was cut to 3% to 4%, and the company said it would stop reporting its AI orders separately (company release, Yahoo Finance). The stock fell 18.0% in one day, from $156.01 to $127.98, and made its low two sessions later at $118.15.
In between — the investor day of 14 October. It was the first in four years. The targets: at least mid-single-digit revenue growth in fiscal 2027 and 2028, more from 2029, and a slightly wider margin each year. Chief executive Julie Sweet said the company expects AI to create more demand than it removes (Business Standard, MarketBeat). By our measure the stock first closed above the downtrend line a day later, at $224.92.
Next report — 17 December. Estimates stand at $3.95 a share on about $19.4 billion (data vendor).
The fundamentals
At $250.49 the company is valued at about $148 billion. It trades at about 18 times the earnings of the last twelve months and 17 times the middle of its own forecast for fiscal 2027, and at 2.0 times revenue. The operating margin is about 16% and the dividend yield 2.6% (data vendor, company forecast). The company plans to return at least $9.5 billion to shareholders this fiscal year. That is the price of a steady business with a doubt attached, not of a growth stock.
The chart, read by hand
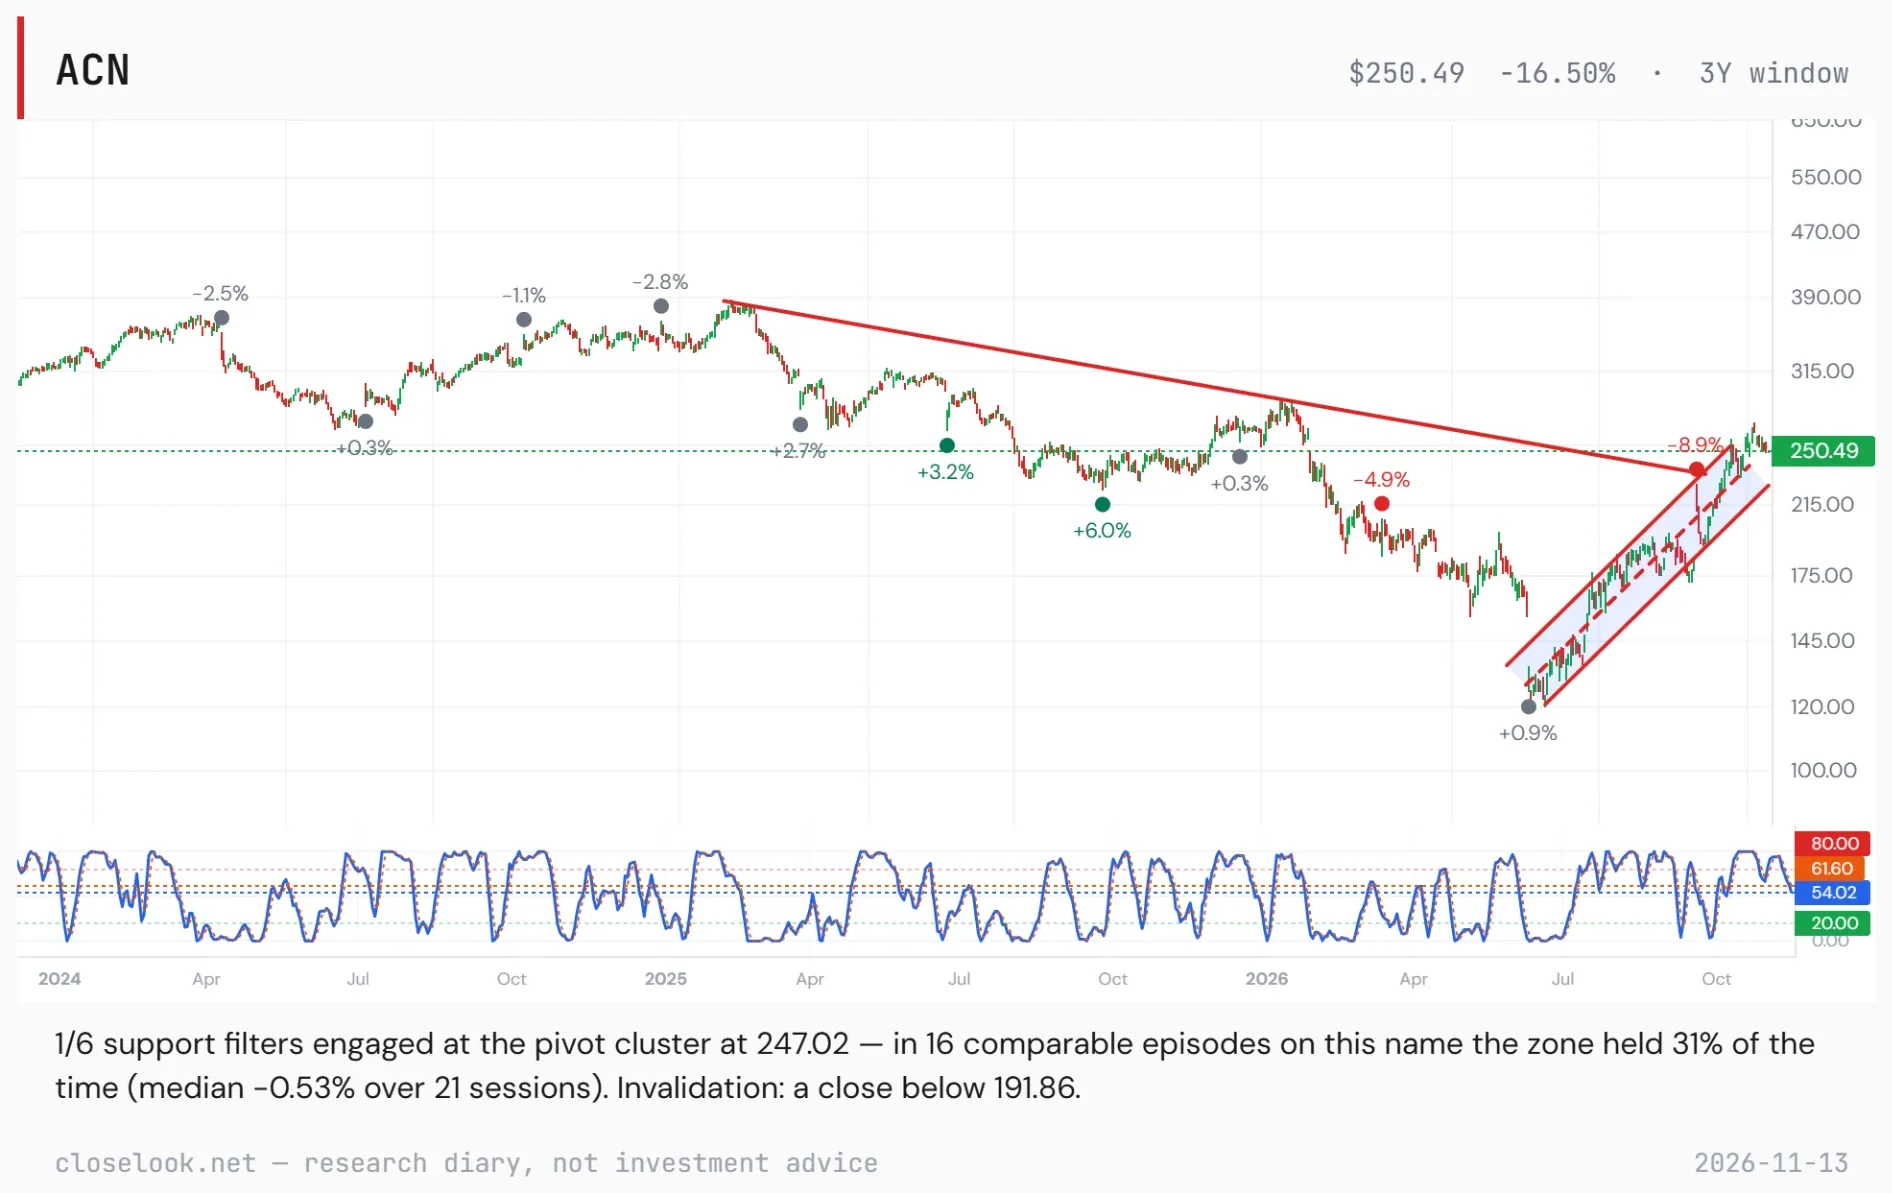
Trend: Five-year view: a top at $398 in February 2025, a lower high at $289 in January 2026, and a line through both that capped every rally for twenty months. From the January high the stock fell 57% to its June low. The three-year view shows what followed: a rising channel from that low. The stock climbed along it through July and August, jumped on the October report, and in the second half of October went through the downtrend line, with a gap on 22 October from $240.26 to $258.74. The editor's read in two words: break out. Price now pauses at $250, on the middle line of the channel and in the zone that was the floor in 2022 and 2023. The editor reads this pause as a consolidation after a large move, in the stock and in its group, and expects the move up to continue.
Oscillators: On the editor's chart the stochastic reads 54.0 with its signal line at 61.6, down from above 80 at the start of November: the overbought reading has worked off while the price lost only 5.5% from its high. The editor expects a buy signal from it soon: the stochastic turning up and crossing back above its signal line. The machine layer, as of Thursday, shows a momentum score of 85 and a quality score of 65. The stock is about 16% above its 50-day average and 32% above its 200-day, and the 200-day average is only now starting to turn up. The pattern engine reads the flow as accelerating upward.
Elliott Wave count: No wave count drawn for this edition — the read rests on the broken downtrend line, the rising channel since June and the old floor near $250.
Key levels: About $275 — the upper line of the rising channel, read off the chart; the 5 November high of $271.76 came close to it · $265.16 — the closing high of 5 November; a close above it continues the breakout · $247 to $250 — the pivot zone on the chart, the middle line of the channel and the floor of 2022–2023 (lowest close then: $246.17 on 15 March 2023); the stock sits on it · $240.26 — the close before the gap of 22 October; closing that gap would be the first test of the broken line · About $227 — the lower line of the rising channel, read off the chart; a close below it ends the channel · $191.86 — the invalidation level on the chart, next to the 200-day average at $190.33; a close below ends this read
What the machines say
Technical snapshot (as of 2026-11-12) — vs 20d -0.2% · vs 50d +16.1% · vs 200d +31.7% · off 52w-high -13.4% · stochastic K 44.3 / D 58.5 · Bullish stack, 200-day still turning
Pattern engine (scan 2026-11-12) — directional-flow 6/100, neutral, accelerating up (5d +9.8%, 21d +42.9%)
Closelooknet scores (as of 2026-11-12) — composite 62/100 · momentum 85/100
Machine blocks render only where our engines actually cover the name — nothing is padded.
The risks, equal billing
What would prove us wrong. A close back under the gap at $240, then under the lower channel line near $227 and the broken downtrend line, would make October a false break, as every rally in this stock was for twenty months. A report on 17 December with falling orders would repeat June, when one day cost 18%. The deeper risk is the one the market priced until June: that AI lowers the price of consulting and outsourcing work faster than it creates new projects. The company's own targets assume it can absorb that. The machine reading on the chart is cautious too: in 16 comparable episodes the $247 zone held 31% of the time. The consolidation read fails earlier: if the pause turns into a close under the lower channel line near $227, it was a top and not a rest. A close under $191.86 ends this read.
Our forecasts
Next 2–4 weeks: The editor reads the stock and its group as consolidating after a large move up, and we expect the move up to continue once the pause is done. The stock stands at $250, on the middle line of its channel and 5.5% under its high. A test of the pivot zone near $247 or of the gap at $240.26 would fit a consolidation; holding inside the channel, above about $227, keeps that read intact. A stochastic buy signal, which the editor expects soon, would mark the end of the pause.
The report on 17 December: Estimates stand at $3.95 a share on about $19.4 billion. On our earnings record this stock ended inside ±3% seven times in eleven; the two large moves of 2026 came on the report day itself, −18% in June and +15.8% in October. New orders decide it again.
12 months: If orders keep growing while clients pay to have AI installed, the break of the downtrend is the start of a repair toward the January high of $288.54. If AI lowers what clients pay per project faster than it adds projects, the stock falls back under the line and June's fear was right. We read it the first way until a close under $191.86 says otherwise.
Diary views, not advice — held publicly alongside the scored record.
Why publish this name? Because our Directional Flow readings are what let us say it: stocks with this or a similar setup have often — historically — done well over the following twelve months. That is the engine's backtested observation about the past, not a forecast; past performance may not be an indication of future performance. Which is exactly why every pick is scored publicly against the tape from today, at one week, one month, three, six and twelve. 12-month view, written 13 November 2026 from the close of 13 November ($250.49). Diary, not investment advice.
Closelooknet publishes an investment research diary, not investment advice. Every pick is scored publicly against the tape at 1w/1m/3m/6m/12m from publication — the record, not the single call, is the product.
Open the live ACN terminal → All picks & the running record →
A note from the editor: the Weekly Chart Pick is free. Its price is one click — add Closelooknet as a preferred source on Google, and you support this work in Google Discover and Search every time you read.
Google opened in a new tab. Add Closelooknet there, then come back to this tab — the Chart Pick unlocks the moment you return.
The preferred-source setting lives in your Google account — if Google asks you to sign in first, you will land on the selection page right after. Google does not tell us whether you saved the selection. Clicking “Done” unlocks the Weekly Chart Pick on this device for 12 months.