Weekly Chart Pick · 2026-10-23
Software — the program that watches the AI programs tests its three-year ceiling
A monitoring-software company has roughly doubled from its April low and now presses against the $63 line that capped it in 2024 and 2025. The rise is orderly — a rising channel since the spring report — but the slow oscillator stands at the same extreme as the 2024 top. Next report: 3 November.
- Three-year ceiling under test: the line near $63 stopped the 2024 and early-2025 highs; the stock closed at $63.37 on 22 October after a spike to about $65 was sold back.
- Doubled from the low: about +96% from the April low near $32, +52% in three months, +85% in six — orderly, inside a rising channel since the spring report.
- The spring report set the move: a +14.7% reaction in May started the channel; the August report drew a quiet −0.6%.
- AI as the customer's problem: as more software is written and run by AI, this company sells the answers when it breaks — log-data use nearly doubled in two quarters.
- The warning light: the slow oscillator reads 82.75, the same extreme as early 2024, after which the stock fell by about a quarter.
- Sector support: the cloud-software fund already trades at a three-year high and the larger monitoring rival is up 99% this year — this name is the one still at its ceiling, with its report due 3 November.
DT Dynatrace last close 63.37 (2026-10-22)
The Setup
The claim: this is one of the cleanest ways AI shows up in a software company's numbers without the company building AI. When applications, cloud systems and now AI agents break, someone has to find out why — fast, at the scale of millions of events a second. Dynatrace sells that answer. The more software is written and run by AI, the more there is to watch, and the less any human can watch it alone.
The numbers support the story so far: recurring revenue grew 17% to $2.14 billion in the last quarter, and log-data consumption — the raw material of AI-era monitoring — nearly doubled in two quarters to a $200 million run rate. The chart agrees: after a two-year sideways range, the stock has doubled since April in an orderly channel and is now testing the line that defined the range's top.
The group is already moving — this name is the one still at its ceiling. Put next to its closest listed rivals and the cloud-software fund, the picture is one of sector support, not a lone runner. Datadog, the larger monitoring rival, is up 99% this year at $270.72 and has traded around $270 since June, every push above it so far sold back. Elastic, whose search and log tools compete for the same data, has more than doubled from its spring low near $45 and is back at $100, a level it last held in early 2025. The WisdomTree Cloud Computing Fund (WCLD) has already done what this stock has not: at $46.07 it trades above its 2024 and 2025 highs, a three-year high, inside a rising channel from the April low near $24.
Read together: the fund has broken out, the two rivals are pressing levels that held them back, and Dynatrace is the last of the four still pinned under a three-year line. If the sector bid holds, that is catch-up room; if the fund falls back under its old highs, the ceiling here is likely to hold too.
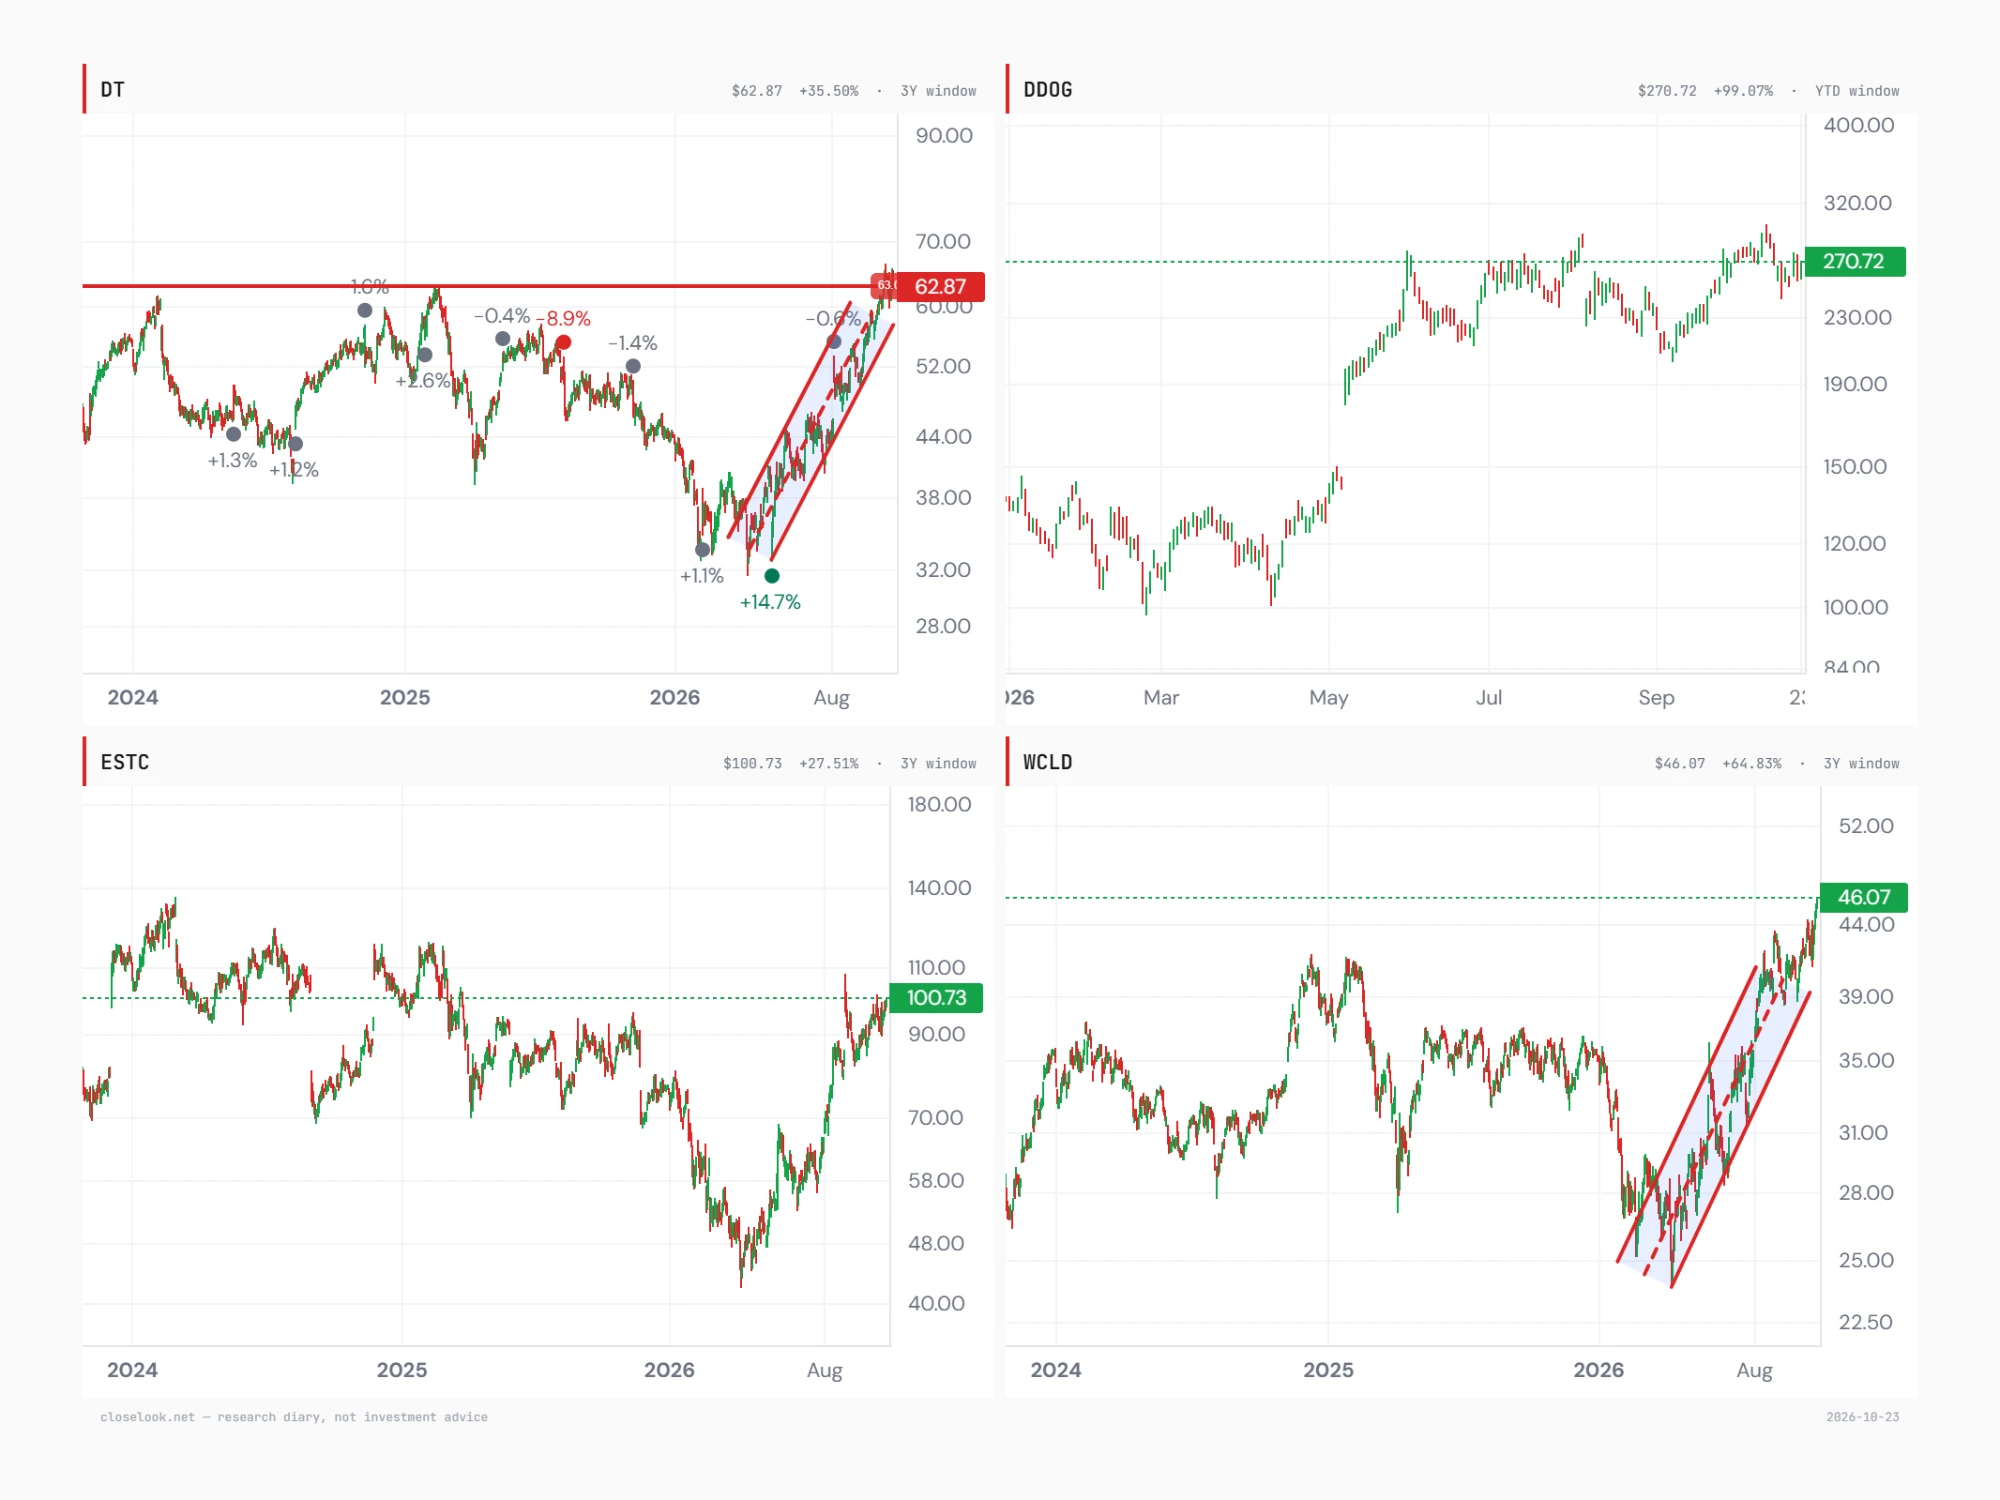
What has to happen next: a close above about $63 that holds, ideally on the 3 November report. The May report started the move with a +14.7% reaction; the market will grade the November one against a much higher bar.
In the Closelooknet readings
Said plainly: this is Dynatrace (NYSE: DT), the software that watches other software — it monitors applications, cloud infrastructure and, increasingly, AI workloads, and tells engineers what broke and why. It is a member of our Agentic Ecosystem index, the layer that earns from running AI rather than building it.
52-week range (closes): 32.36 – 65.25
The latest print
Last report — quarter to 30 June, published 5 August. Revenue rose 16% to $555 million (15% at constant currency); annual recurring revenue reached $2.14 billion, up 17%. Adjusted earnings per share were $0.48, up from $0.42. The standout line: log-data consumption nearly doubled in two quarters to a $200 million annual run rate, growing well over 100% year on year.
Guidance: the full-year earnings-per-share range went up to $1.97–1.99; the dollar ranges for recurring revenue and revenue came down by about $23 million and $13 million at the midpoint — almost entirely a currency effect, with constant-currency revenue growth guided higher. Next report: 3 November, before the US open (company announcement, 20 October). The chief financial officer retires by the end of March 2027; a search is under way.
The fundamentals
At $63.37 (close of 22 October) the stock trades at about 32 times the midpoint of this year's guided earnings ($1.97–1.99) — a growth-software multiple for mid-teens revenue growth, an operating margin near 29% and a cash conversion that is the business's strength: adjusted free cash flow of $309 million in the quarter, a 56% margin of revenue (seasonally high; the full-year guide is 26.5%).
The chart, read by hand
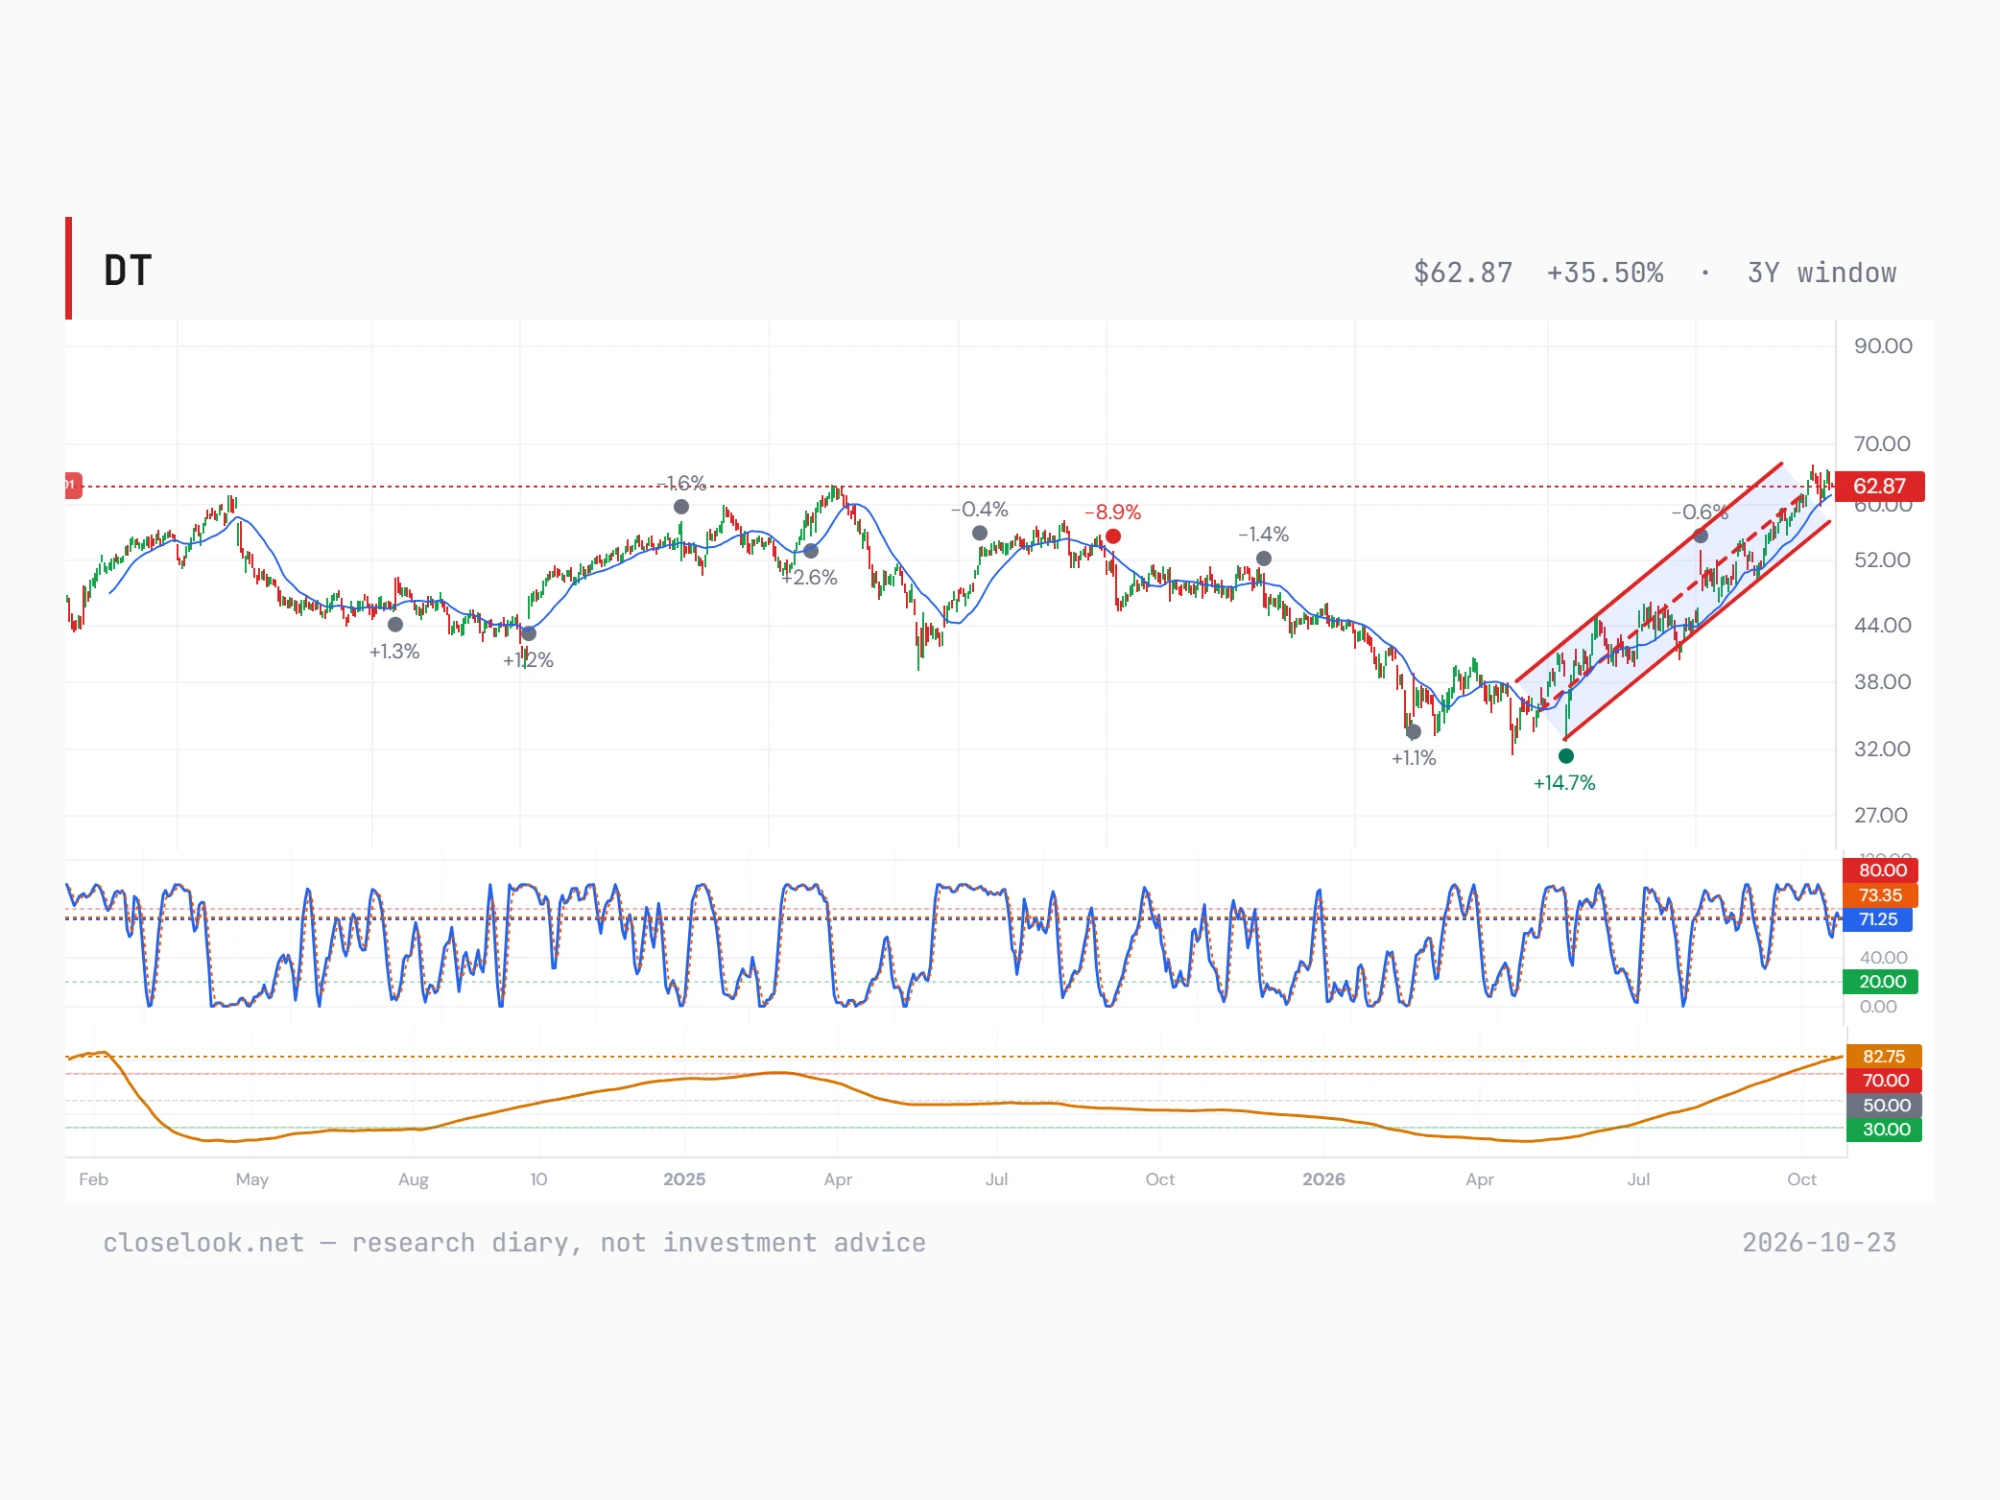
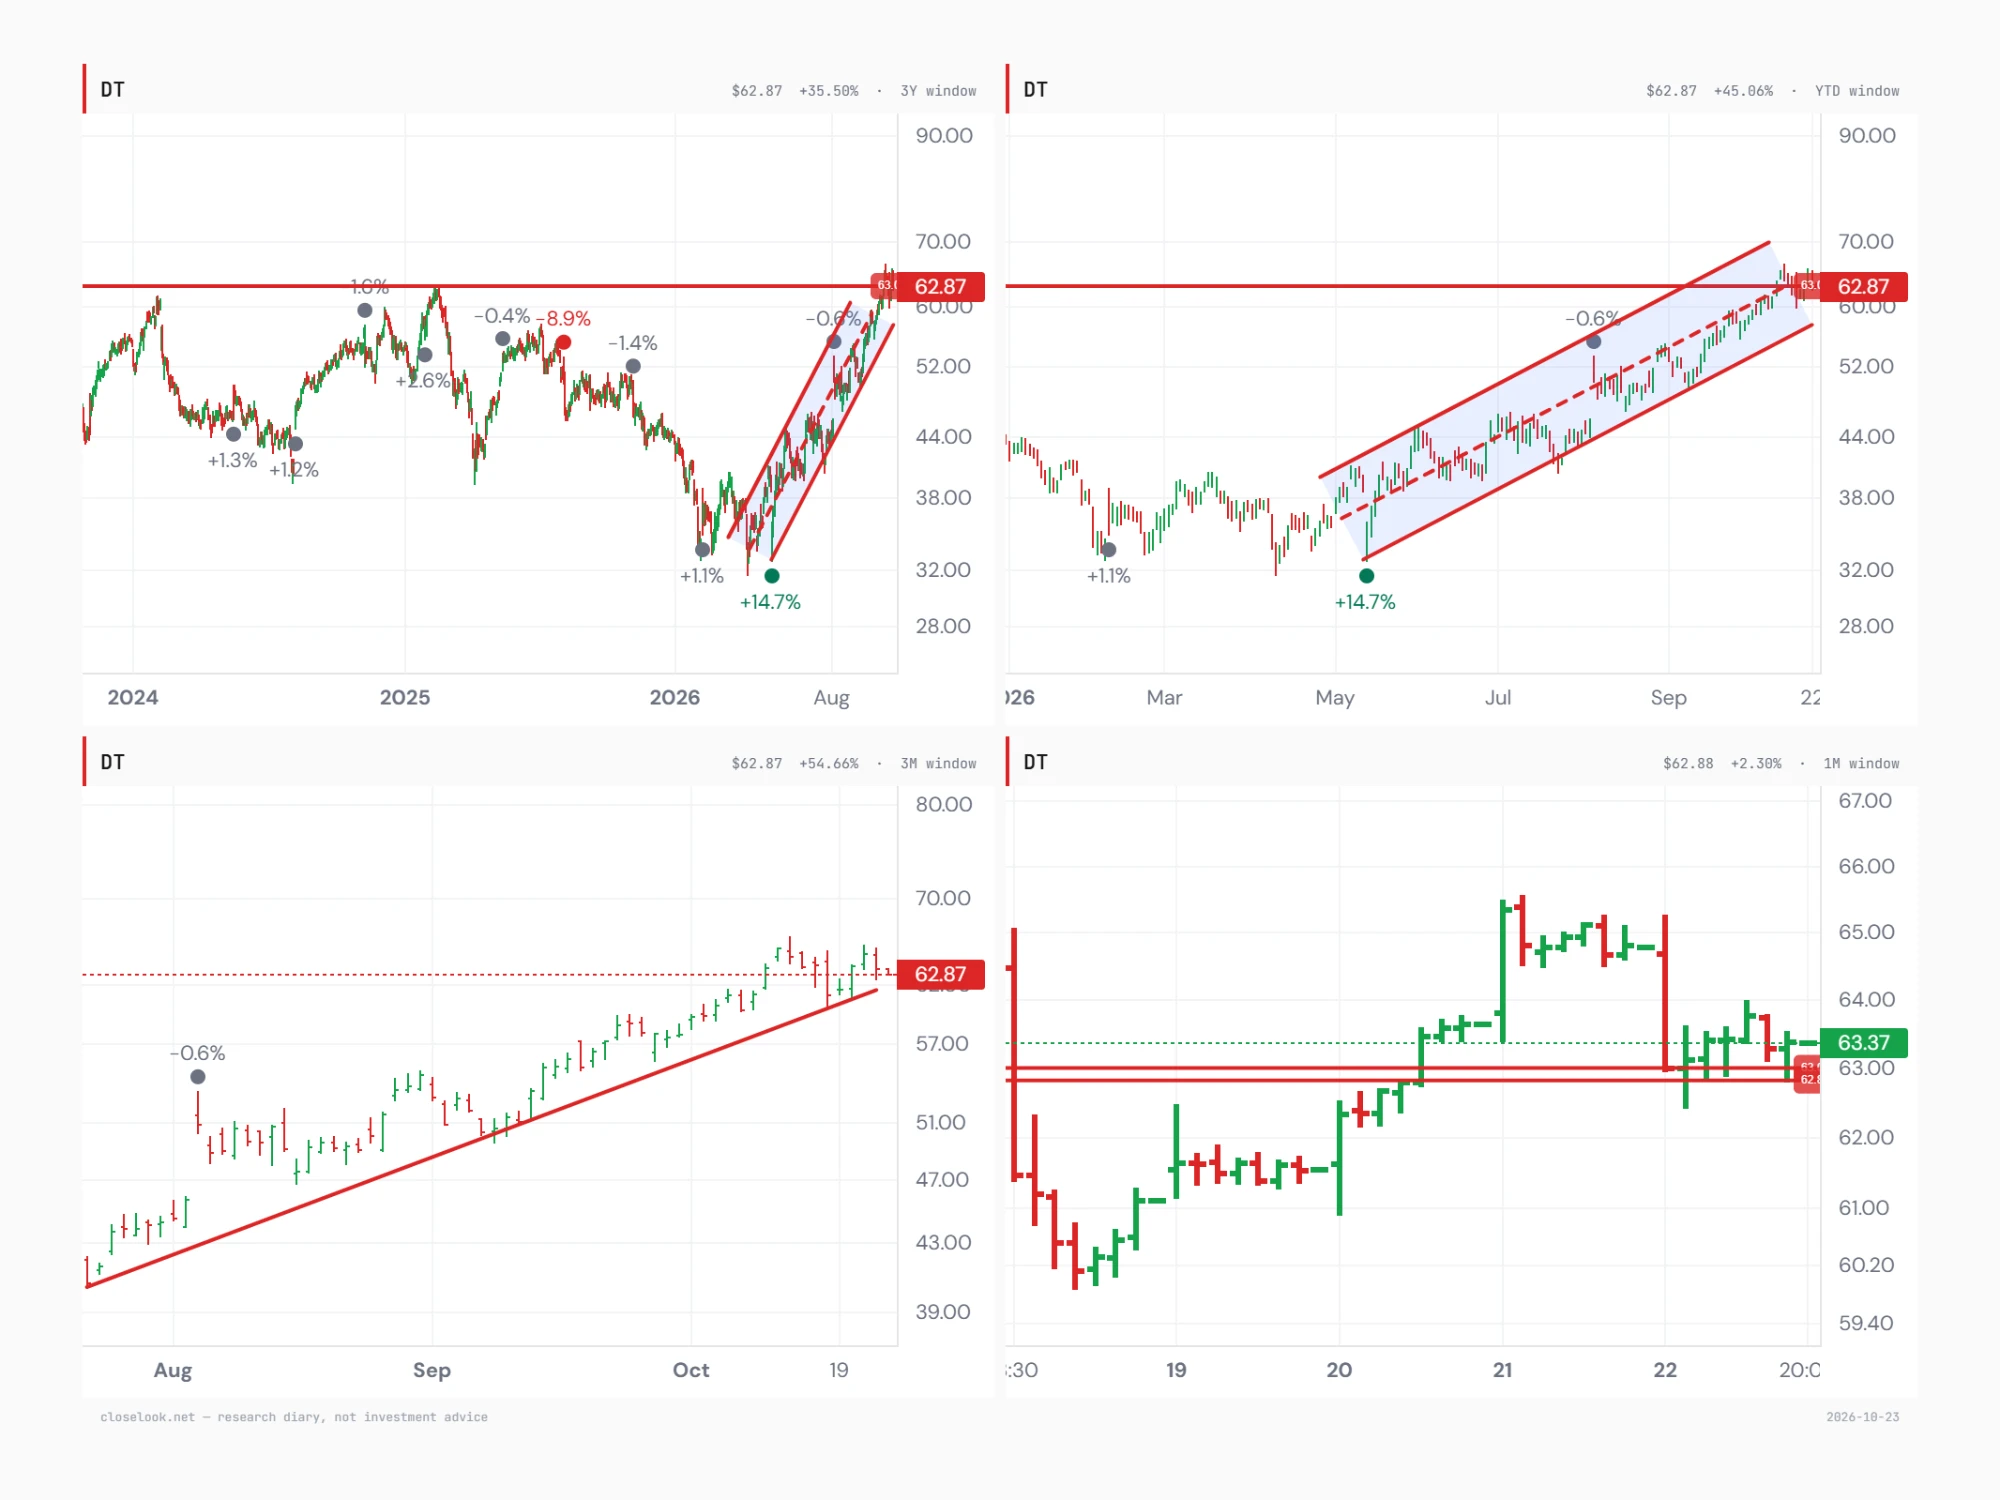
Trend: Three-year view: a sideways range between about $40 and $63 since 2024, broken to the downside into the April 2026 low near $32. From there a steep rising channel — started by the +14.7% reaction to the May report — has carried the stock back to the top of the old range. The horizontal line near $62.9 capped the 2024 and early-2025 highs; the stock now sits on it. Year to date and over three months the structure is intact: the channel midline and the rising support line from late July are both below the price. One month: a spike to about $65 on 21 October was sold back on 22 October to the $62.9–63.0 zone, which held into the close.
Oscillators: The fast stochastic sits around 71–73, below its overbought band — room to move. The slow oscillator reads 82.75, its highest since early 2024; the last time it stood there the stock topped near $61 and then fell by about a quarter. Momentum carries the trend, but the slow measure says the move is stretched in time.
Elliott Wave count: No wave count drawn for this edition — the chart read rests on the range, the channel and the oscillators.
Key levels: $62.9–63.0 — the three-year ceiling, now tested from below; a close above it on volume would break the range · $65.25 — the 52-week high (21 October spike) · about $59–60 — the rising support line from late July · about $57 — the lower edge of the channel from the April low · about $56 — the 50-day average · about $44 — the 200-day average · sector check: the cloud-software fund (WCLD) above about $43 — its 2024/25 highs — keeps the group's breakout intact
What the machines say
Technical snapshot (as of 2026-10-22) — vs 20d +2.7% · vs 50d +12.4% · vs 200d +43.5% · off 52w-high -5.0% · stochastic K 67.1 / D 61.1 · -2.8% at the close
Pattern engine (scan 2026-10-22) — directional-flow 62/100, hot, accelerating up (5d +5.9%, 21d +27.3%)
Closelooknet scores (as of 2026-10-22) — composite 58/100 · momentum 95/100
Machine blocks render only where our engines actually cover the name — nothing is padded.
The risks, equal billing
What would prove us wrong. A rejection at the three-year ceiling, confirmed by a close below about $57 — the lower edge of the channel — would turn the breakout attempt into a top inside the old range. The slow oscillator at 82.75 is the reason to take that seriously: the last reading this high, in early 2024, preceded a fall of about a quarter.
The sector risk: the support is shared, so is the downside — a slide of the cloud-software fund back under its old highs near $43 would take the tailwind away from all four charts at once.
The report risk: 3 November, before the open. At about 32 times guided earnings and after a doubling, a solid quarter may not be enough — this season has punished good numbers in stretched names. The currency-driven trim to the dollar guidance in August is the soft spot the market will look at first. The chief financial officer's retirement (by March 2027) adds a transition to watch.
Our forecasts
Next 2–4 weeks: Into the 3 November report the ceiling decides: holding above about $63 keeps the breakout attempt alive; a slip back toward $59–60 (the support line) is the normal pause inside the channel.
Into and after the report: A rewarded print plus a close above $65.25 would break the three-year range and open room toward the low $70s; a punished print sends the stock back to the channel floor near $57.
12 months: If the range breaks and the AI-monitoring demand keeps showing up in recurring revenue, the old range top becomes the new floor; if not, the overbought reading argues for another year inside $44–63.
Diary views, not advice — held publicly alongside the scored record.
Why publish this name? Because our Directional Flow readings are what let us say it: stocks with this or a similar setup have often — historically — done well over the following twelve months. That is the engine's backtested observation about the past, not a forecast; past performance may not be an indication of future performance. Which is exactly why every pick is scored publicly against the tape from today, at one week, one month, three, six and twelve. 12-month view, written 23 October 2026 from the close of 22 October ($63.37). Diary, not investment advice.
Closelooknet publishes an investment research diary, not investment advice. Every pick is scored publicly against the tape at 1w/1m/3m/6m/12m from publication — the record, not the single call, is the product.
Open the live DT terminal → All picks & the running record →
A note from the editor: the Weekly Chart Pick is free. Its price is one click — add Closelooknet as a preferred source on Google, and you support this work in Google Discover and Search every time you read.
Google opened in a new tab. Add Closelooknet there, then come back to this tab — the Chart Pick unlocks the moment you return.
The preferred-source setting lives in your Google account — if Google asks you to sign in first, you will land on the selection page right after. Google does not tell us whether you saved the selection. Clicking “Done” unlocks the Weekly Chart Pick on this device for 12 months.