The Distribution Phase
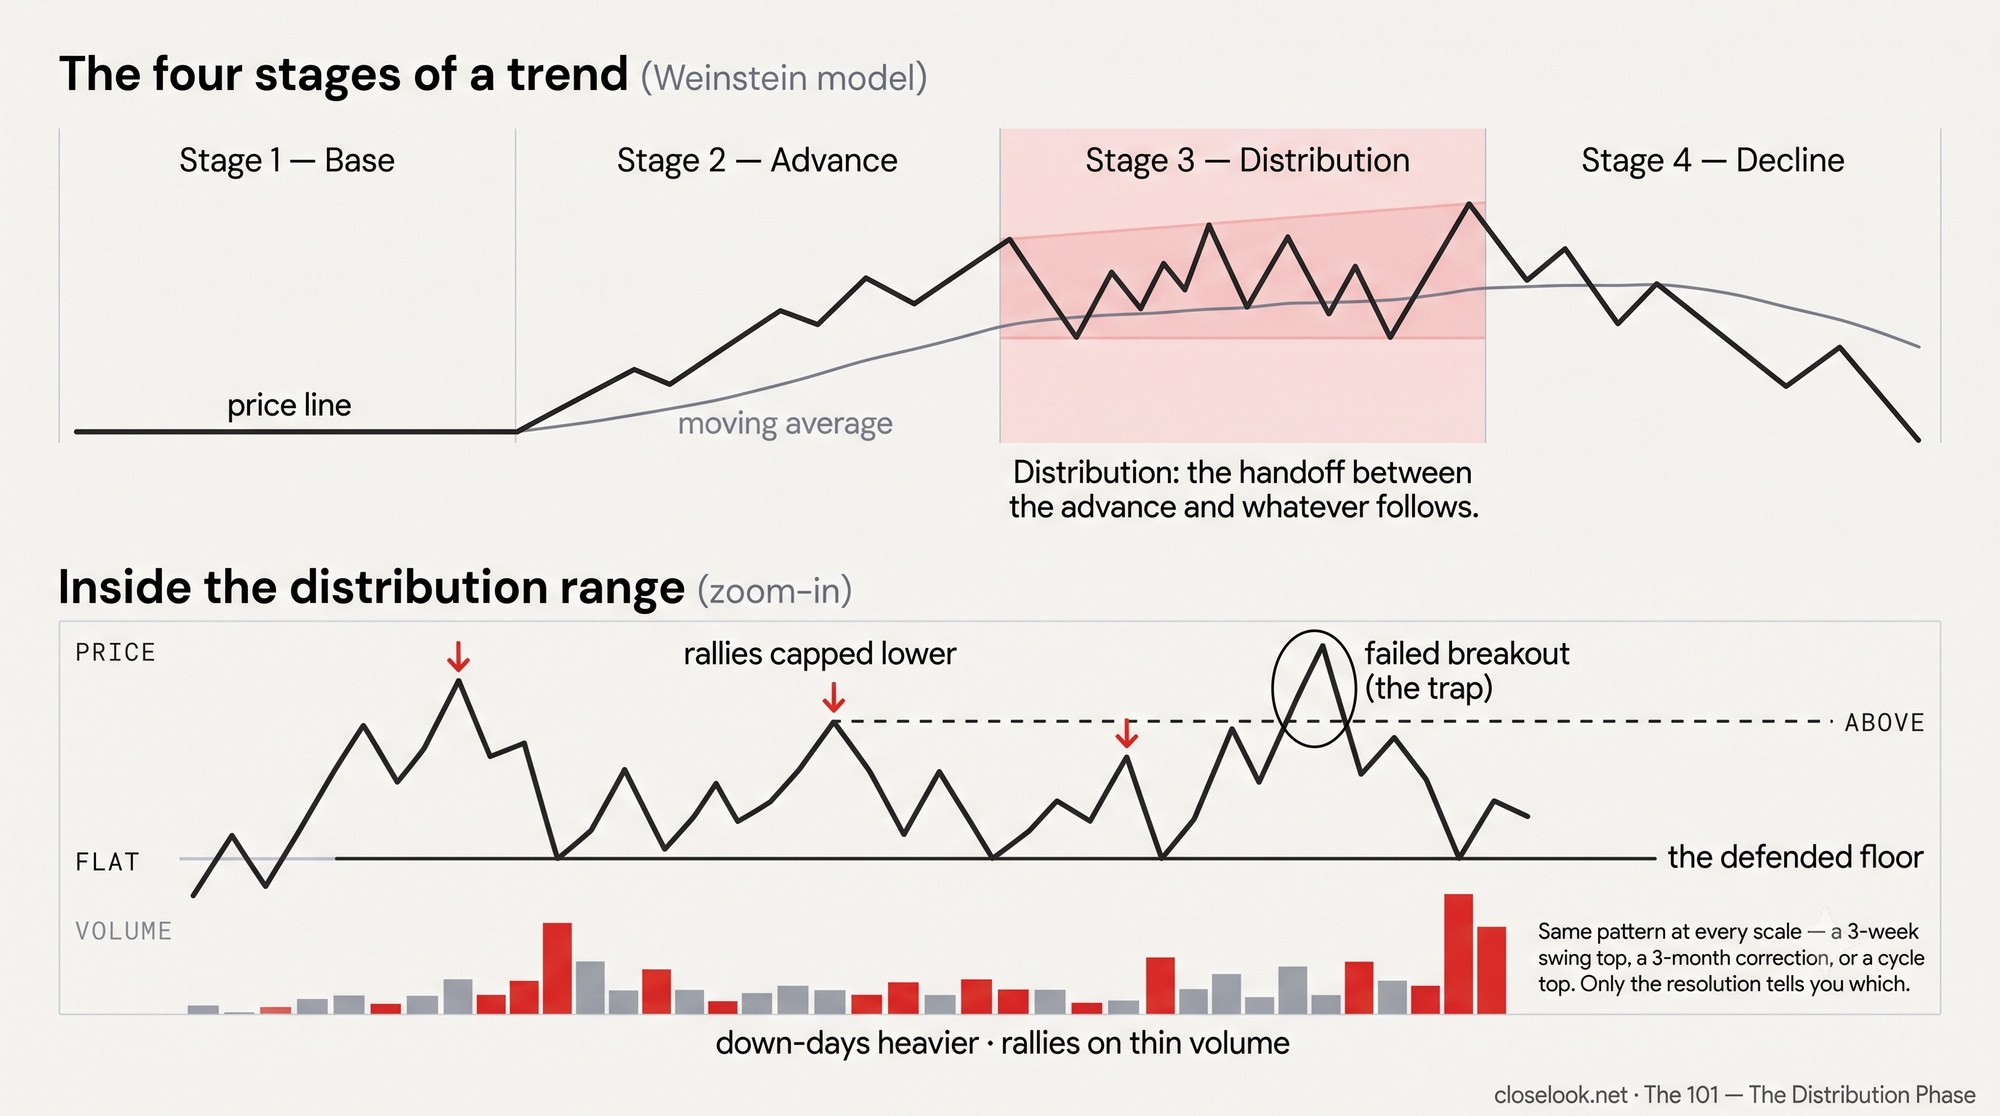
The distribution phase is the stretch of tape where an advance stops trending and starts churning — expanding volatility, rapid alternating whipsaws, rallies that fail at progressively lower highs over a floor that keeps getting defended. In Stan Weinstein's stage model it is Stage 3, the top formation between the advance and the decline; in the Wyckoff cycle it is the phase where institutional inventory transfers to late-arriving demand. The signature matters because it appears at tops of every degree — short-term swings, intermediate corrections and cycle ends alike — and the pattern itself never announces in advance which one it is building.
What it is
Both classical frameworks describe the same handoff. Weinstein's model divides every trend into four stages: a base (Stage 1), an advance (Stage 2), a top (Stage 3) and a decline (Stage 4). Wyckoff's cycle runs accumulation, markup, distribution, markdown. Distribution — Stage 3 — is the joint between the advance and whatever follows: the zone where holders who bought the trend early begin offloading inventory into the demand the trend itself created. Because that supply is too large to sell at once, it is worked off into strength — every rally gets met, every dip gets bought by newer hands — and the result is not a smooth reversal but a wide, violent, sideways range. The trend's moving averages flatten underneath it while price oscillates around them with growing amplitude.
The mechanics underneath
Three forces produce the signature. Volatility expansion: institutional supply capping rallies against late-stage demand pushing them creates sharply rising and falling swings — a high-velocity range rather than a trend. Churning: the sector alternates between sharp rallies and steep sell-offs without sustaining a directional move, because committed long-term capital has stopped arriving; what remains rotates rapidly to extract the last momentum, producing failed breakouts and immediate mean-reversion. Liquidity exhaustion: when there is no longer enough structural liquidity to lift the whole group uniformly, capital cannibalizes itself in rapid-fire relative-strength shifts — one name's rally funded by another's decline, a zero-sum tape that often marks a late-cycle macro environment for that group.
Distribution or accumulation — the two tells
Accumulation ranges are also choppy, so the shape alone does not separate a top from a base. Two tells do. Failed breakouts: in distribution, price repeatedly breaks above resistance — trapping late buyers at the highs — and aggressively reverses; Wyckoff called the terminal version an upthrust. In accumulation the traps run the other way: breaks below support that recover fast (springs). Volume divergence: in distribution the sharp down-moves carry the heavier volume while the alternating rallies come on lighter, lower-quality flow — supply weighs more than demand. In accumulation the ratio inverts. The context check is breadth: a genuine top thins out underneath, while a group churning inside an otherwise broadening market is arguing about ownership of the group, not about the market.
Tops come in degrees
The signature marks tops of every size, and this is the caveat the textbooks understate: a distribution range on a daily chart can be a three-week swing top, an intermediate correction that runs for months, or the start of a cycle-degree Stage 4 — and the pattern looks identical in real time. Degree is its own discipline, revealed by context and confirmed only by resolution. The size and duration of the preceding advance set the ceiling on what the top can mean; the timeframe of the flattening moving average says which trend is actually pausing; and a daily-chart Stage 3 frequently resolves as nothing more than a rest inside a weekly-chart Stage 2. Until the range breaks — down through the defended floor on weight, or up through the capped highs with volume returning — a distribution read is a hypothesis about supply, not a verdict about the cycle.
How to read it
A working checklist, all observable: swing highs stepping down while swing lows stay flat (rallies capped, floor defended); down-days running consistently heavier in volume than up-days, with the heaviest tapes of the stretch on the red days; breakouts to new highs that close back below the level within a session or two; realized volatility in the group expanding while implied volatility at the index level stays quiet — complacency funding the churn; and breadth inside the group deteriorating while the broader regime holds. The refutation is equally specific: a range that resolves upward on returning volume, with the group's laggards participating, retroactively reclassifies the whole structure as consolidation. Score the checklist, then let the resolution grade it.