Portfolio
Gold: Not What It Used to Be
A high-beta momentum asset with positive correlations with global equities

The structural relationship between gold and risk-on assets has undergone a profound shift since autumn 2025. Rather than serving as a clean, inversely correlated safe haven, gold has frequently behaved like a high-beta momentum asset, showing episodic, tightly positive correlations with global equities and growth themes.
This macro regime change is driven by a unique mix of cross-asset funding mechanics, institutional ownership changes, and structural macro variables.
1. The correlation regime: tracking the breakdown
Historically, the correlation between gold (LBMA) and global equities (MSCI ACWI or S&P 500) has hovered near zero or turned sharply negative during equity drawdowns. However, looking at the rolling data across recent periods highlights a massive shift:
| Period | Gold–equity correlation regime | Primary price driver |
|---|---|---|
| Historical average | Null to low positive (~0.10 to 0.15) | Inflation hedging, basic monetary demand |
| Jan – Summer 2025 | Intermittently positive | Structural central-bank diversification, tariff front-running |
| Autumn 2025 – Early 2026 | Strongly positive (up to 0.85–0.91) | Momentum chasing, retail/leveraged ETF flows |
| Spring 2026 (current) | Highly volatile / co-liquidation | Multi-asset funding squeezes, cross-market margin calls |
During the rapid equity expansion in September and October 2025, gold did not act as a diversifier; it surged alongside risk assets, breaching $4,000/oz in October. When equity volatility remained artificially suppressed through mid-autumn, gold behaved essentially as an early growth-momentum trade.
2. Structural drivers of the positive correlation
Two main macro-technical forces explain why gold has moved in tandem with risk-on assets since autumn 2025:
The “funding squeeze” & co-liquidation mechanics
As gold experienced a parabolic run — reaching massive heights earlier this year — it accumulated unprecedented embedded gains across institutional and retail macro portfolios.
When volatility spikes in risk-on sectors (such as semiconductor or AI growth clusters), multi-asset desks facing margin calls or strict VaR (value-at-risk) constraints look to liquidate their most liquid, highly profitable positions first to raise cash efficiently. Consequently, gold has been caught in a structural contagion loop: a sharp de-risking event in tech stocks triggers immediate, algorithmic gold selling.
Shifting institutional ownership & the fiat hedge
The buyer profile for gold changed permanently through late 2025. In Q4 2025 alone, retail and institutional ETF inflows experienced massive volume, sometimes eclipsing central-bank demand.
Instead of trading solely as a cyclical safety play, gold is being held as a core, permanent component of modern portfolio architecture to hedge against structural risks that threaten equities and fiat stability simultaneously:
- Erosion of Fed independence: persistent anxieties surrounding institutional fiscal dominance and tariff-policy cross-currents.
- Fiscal imbalances: sovereign debt expanding at a clip typically reserved for recessions, forcing capital into both scarce tech monopolies (earnings growth) and scarce monetary assets (gold).
3. The real-yield anomaly
The deterioration of gold’s traditional inverse correlation to US real yields has further solidified this risk-asset behavior.
Historically, with 10-year US Treasury real yields sitting around 2.0% (nominal yields near 4.3%), a non-yielding asset like gold faces a massive carry disadvantage. Under the old playbook, high real yields should have crushed gold prices.
Instead, the persistent threat of supply-side inflation shocks (driven by ongoing global tariff implementations and energy pressures, with WTI crude trading elevated) means the market is pricing in a structural “higher-for-longer” inflation floor. Investors are treating both premium equities (with pricing power) and gold as matching instruments to outrun this fiscal reality.
Portfolio takeaway
Since autumn 2025, assuming gold will automatically move inversely to a declining equity tape is a dangerous structural assumption. In short-term vol spikes, gold is behaving like a risk-on momentum asset due to portfolio-positioning mechanics; however, its long-term secular bull thesis remains firmly distinct from equities.
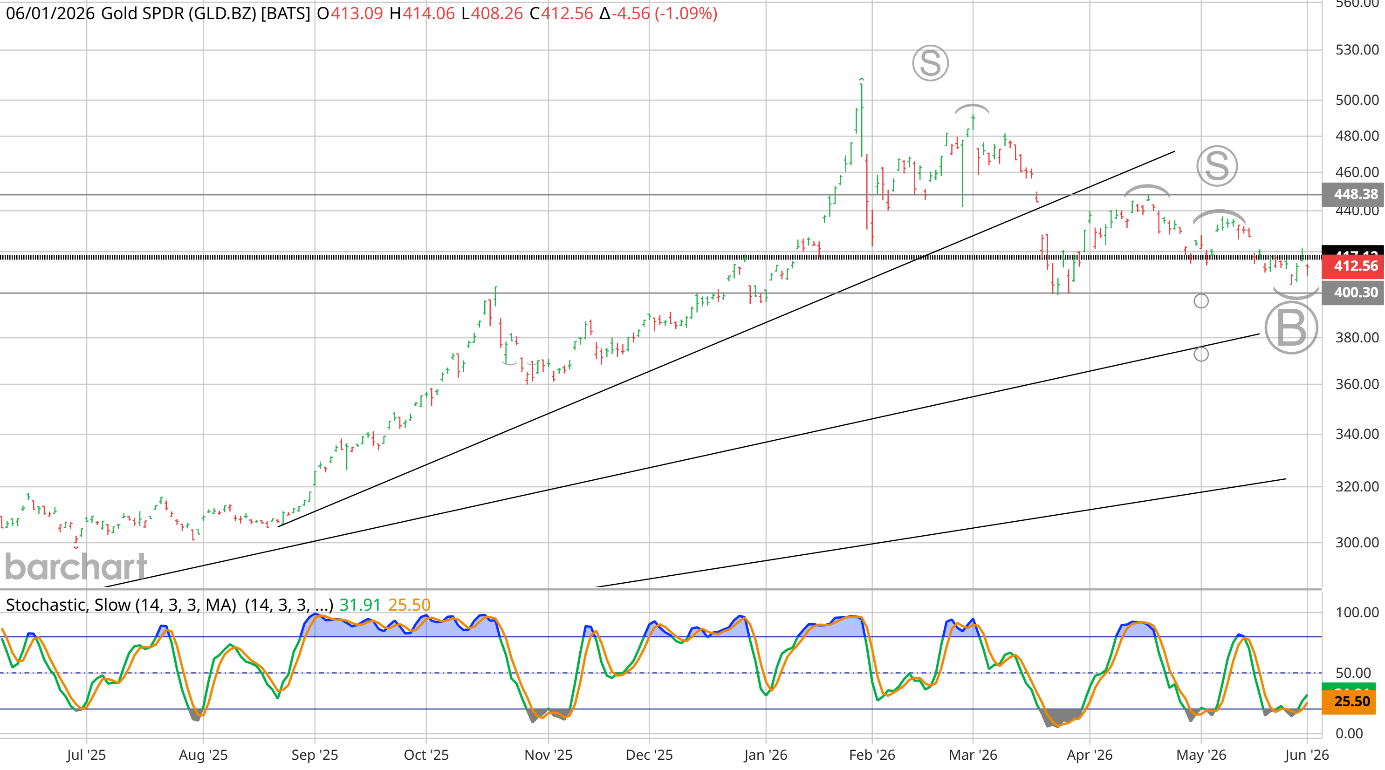
As of June 1, 2026, gold may have seen a double bottom, and as long as the $400–410 level in the GLD ETF holds, another test of the $450 level seems likely. Under the new regime, that is bullish for risk-on assets such as stocks.
Closelook publishes a market diary, not investment advice. The strategies described here are educational. Tax, suitability, and risk depend on personal circumstances — consult a licensed advisor before acting.