Closelook@US Stock Markets
Nasdaq — The Confirmation Came, and the Market Underneath Made Its Low
The Nasdaq 100 fund closed the week at 749.58, a record and above the 746.16 line this letter has waited on since August — the confirmation, on a weekly close. On the same Friday the Nasdaq 100 without its tech stocks closed at its lowest level of the year, the S&P 500 without tech fell 1.5%, only three of eleven sectors rose, and not one financial stock in the S&P closed above its 20-day average. Soft inflation and a weak jobs report could not lower the long end. The fourth quarter starts here — the strongest stretch of the calendar, two uncertain weeks before the reporting season, and TSMC's September sales as the first test.
Current edition · 2026-10-04
1 · This Week's Action
The confirmation came. The Nasdaq 100 fund closed Friday at 749.58 — up 0.68% on the week, a record close, and above 746.16, the line this letter set in August as the confirmation of the advance. Last week it closed through the line once, on Tuesday, and finished the week under it. This week it finished above it. The index itself closed at 30,916, +1.01%, a record. The path: 736.53 Monday (−1.07%), 737.93, 739.77, 742.03, 749.58 (+1.02% on Friday) — four up days after a down Monday, the last of them on a jobs report that showed almost no jobs.
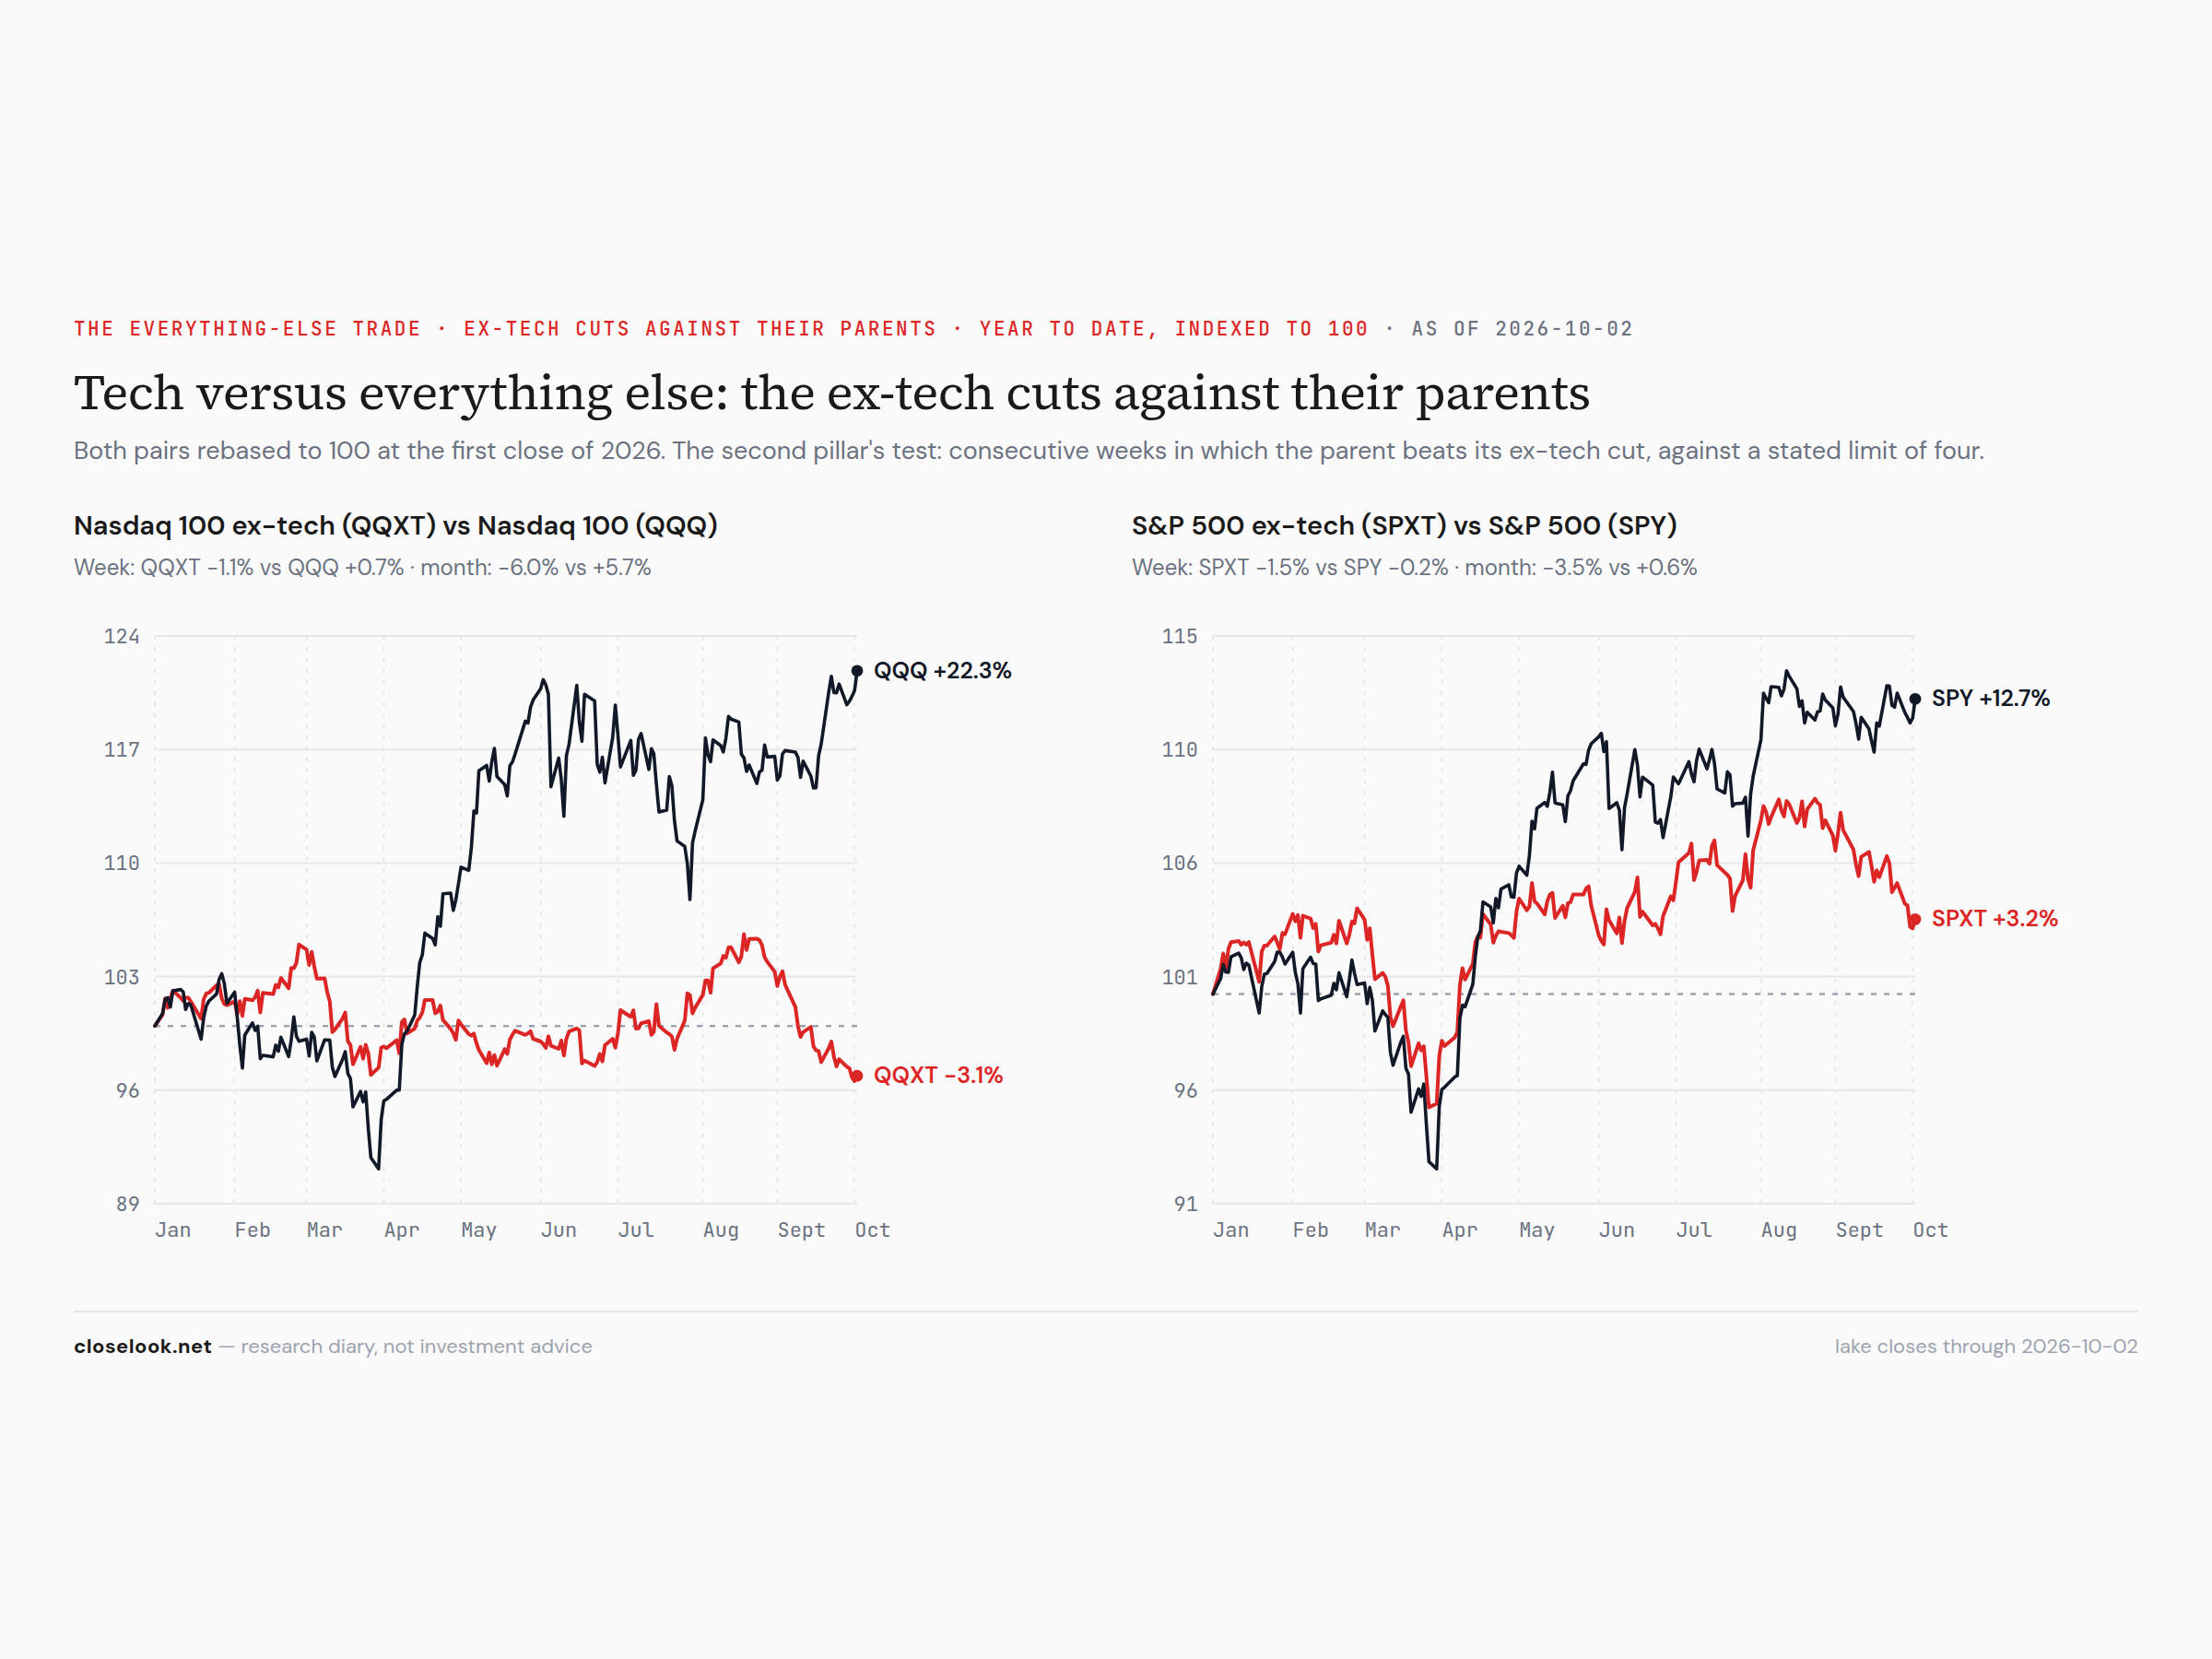
And the market underneath made its low. On the same Friday the Nasdaq 100 without its tech stocks closed at 95.89, −1.06% on the week — its lowest close of 2026, under last week's 95.94. The S&P 500 without tech fell 1.48%. The S&P 500 fund slipped 0.22% to 769.64, 1.1% under its August high; the equal-weight S&P fell 0.65% and sits 3.2% under its 50-day average; the small caps fell 0.16%. The two halves of the market moved in opposite directions on the same five days, and the index that measures the largest companies recorded only the half that went up.
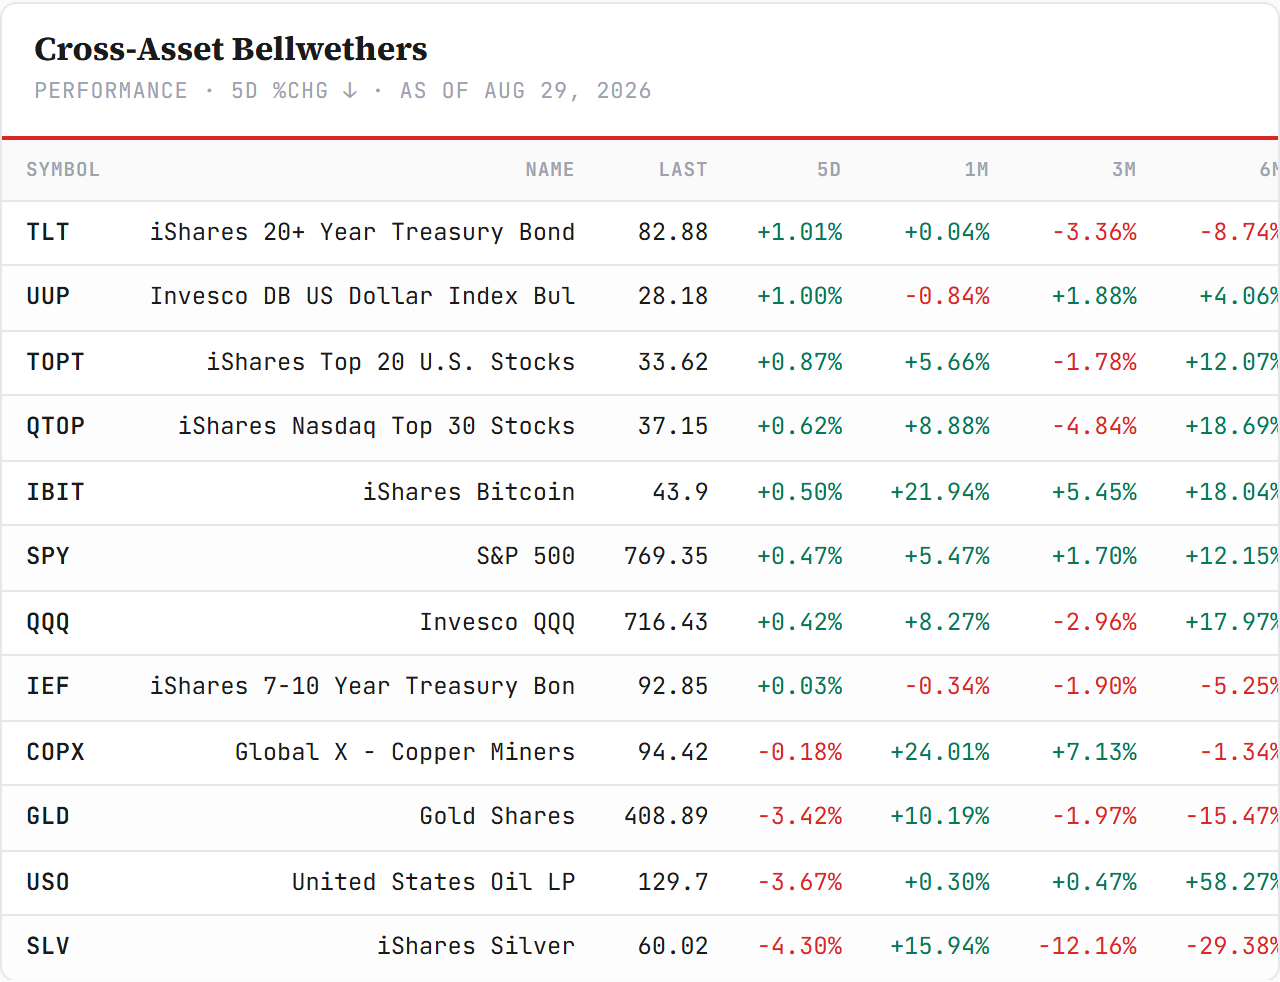
The cross-asset tape — four of twelve green. The dollar fund +0.94%, the Nasdaq top-30 fund +0.90%, the Nasdaq 100 +0.68%, the bitcoin fund +0.34%. Everything else fell: silver −5.85%, gold −3.37%, the long bond −2.32%, the belly −1.06%, copper miners −0.95%, oil −0.65%, the US top-20 fund −0.37%, the S&P −0.22%. The dollar fund made its highest close of the year on Thursday. The market bought the currency and the thirty largest Nasdaq stocks and sold everything that pays a fixed rate or stores value.
The eleven S&P 500 sectors
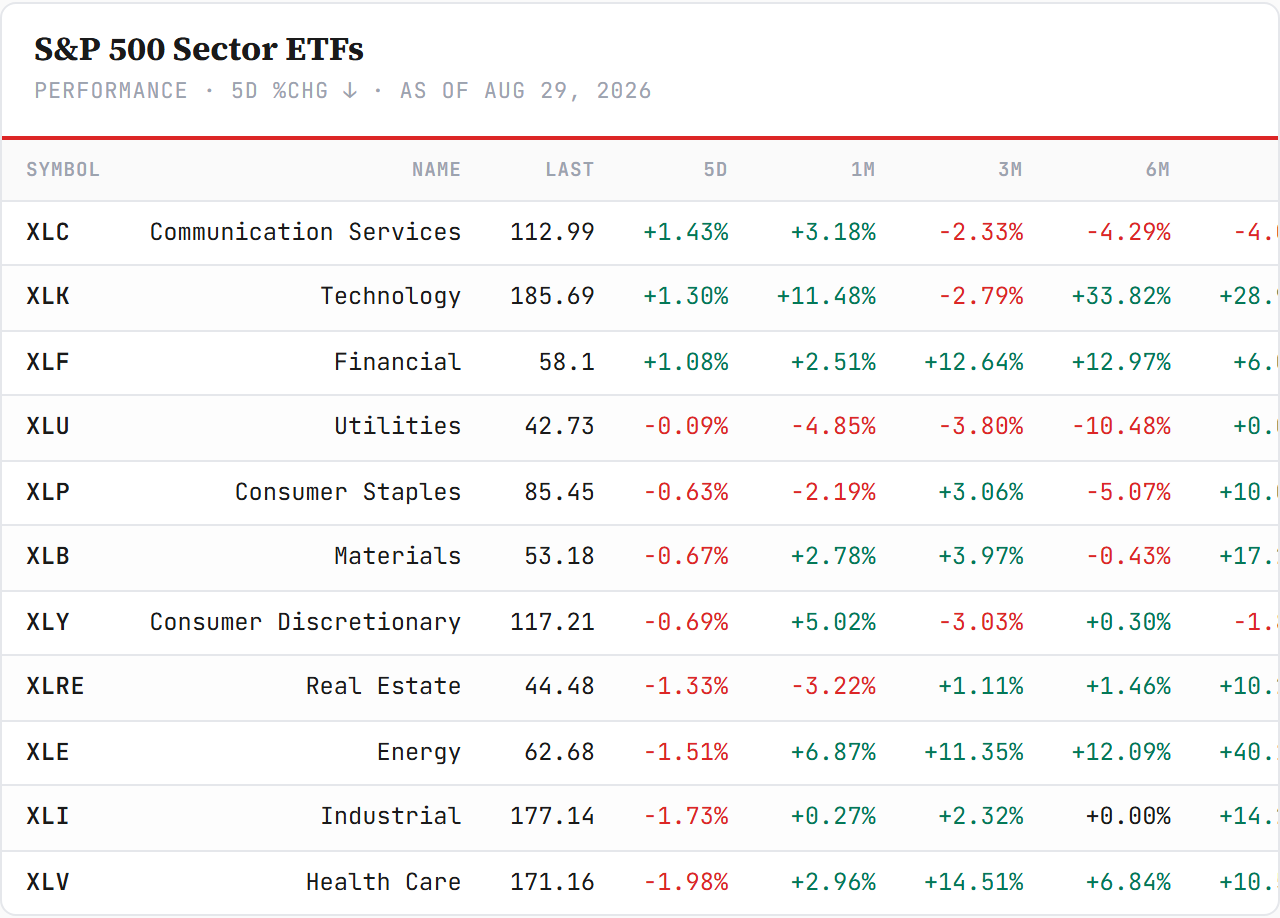
Three of eleven green. Technology +1.80% to a record 199.81, energy +1.26%, utilities +0.81%. The bottom: health care −2.65%, financials −2.46%, communications −2.34%, materials −1.89%, staples −1.86%, real estate −1.80%, discretionary −0.47%, industrials −0.28%.
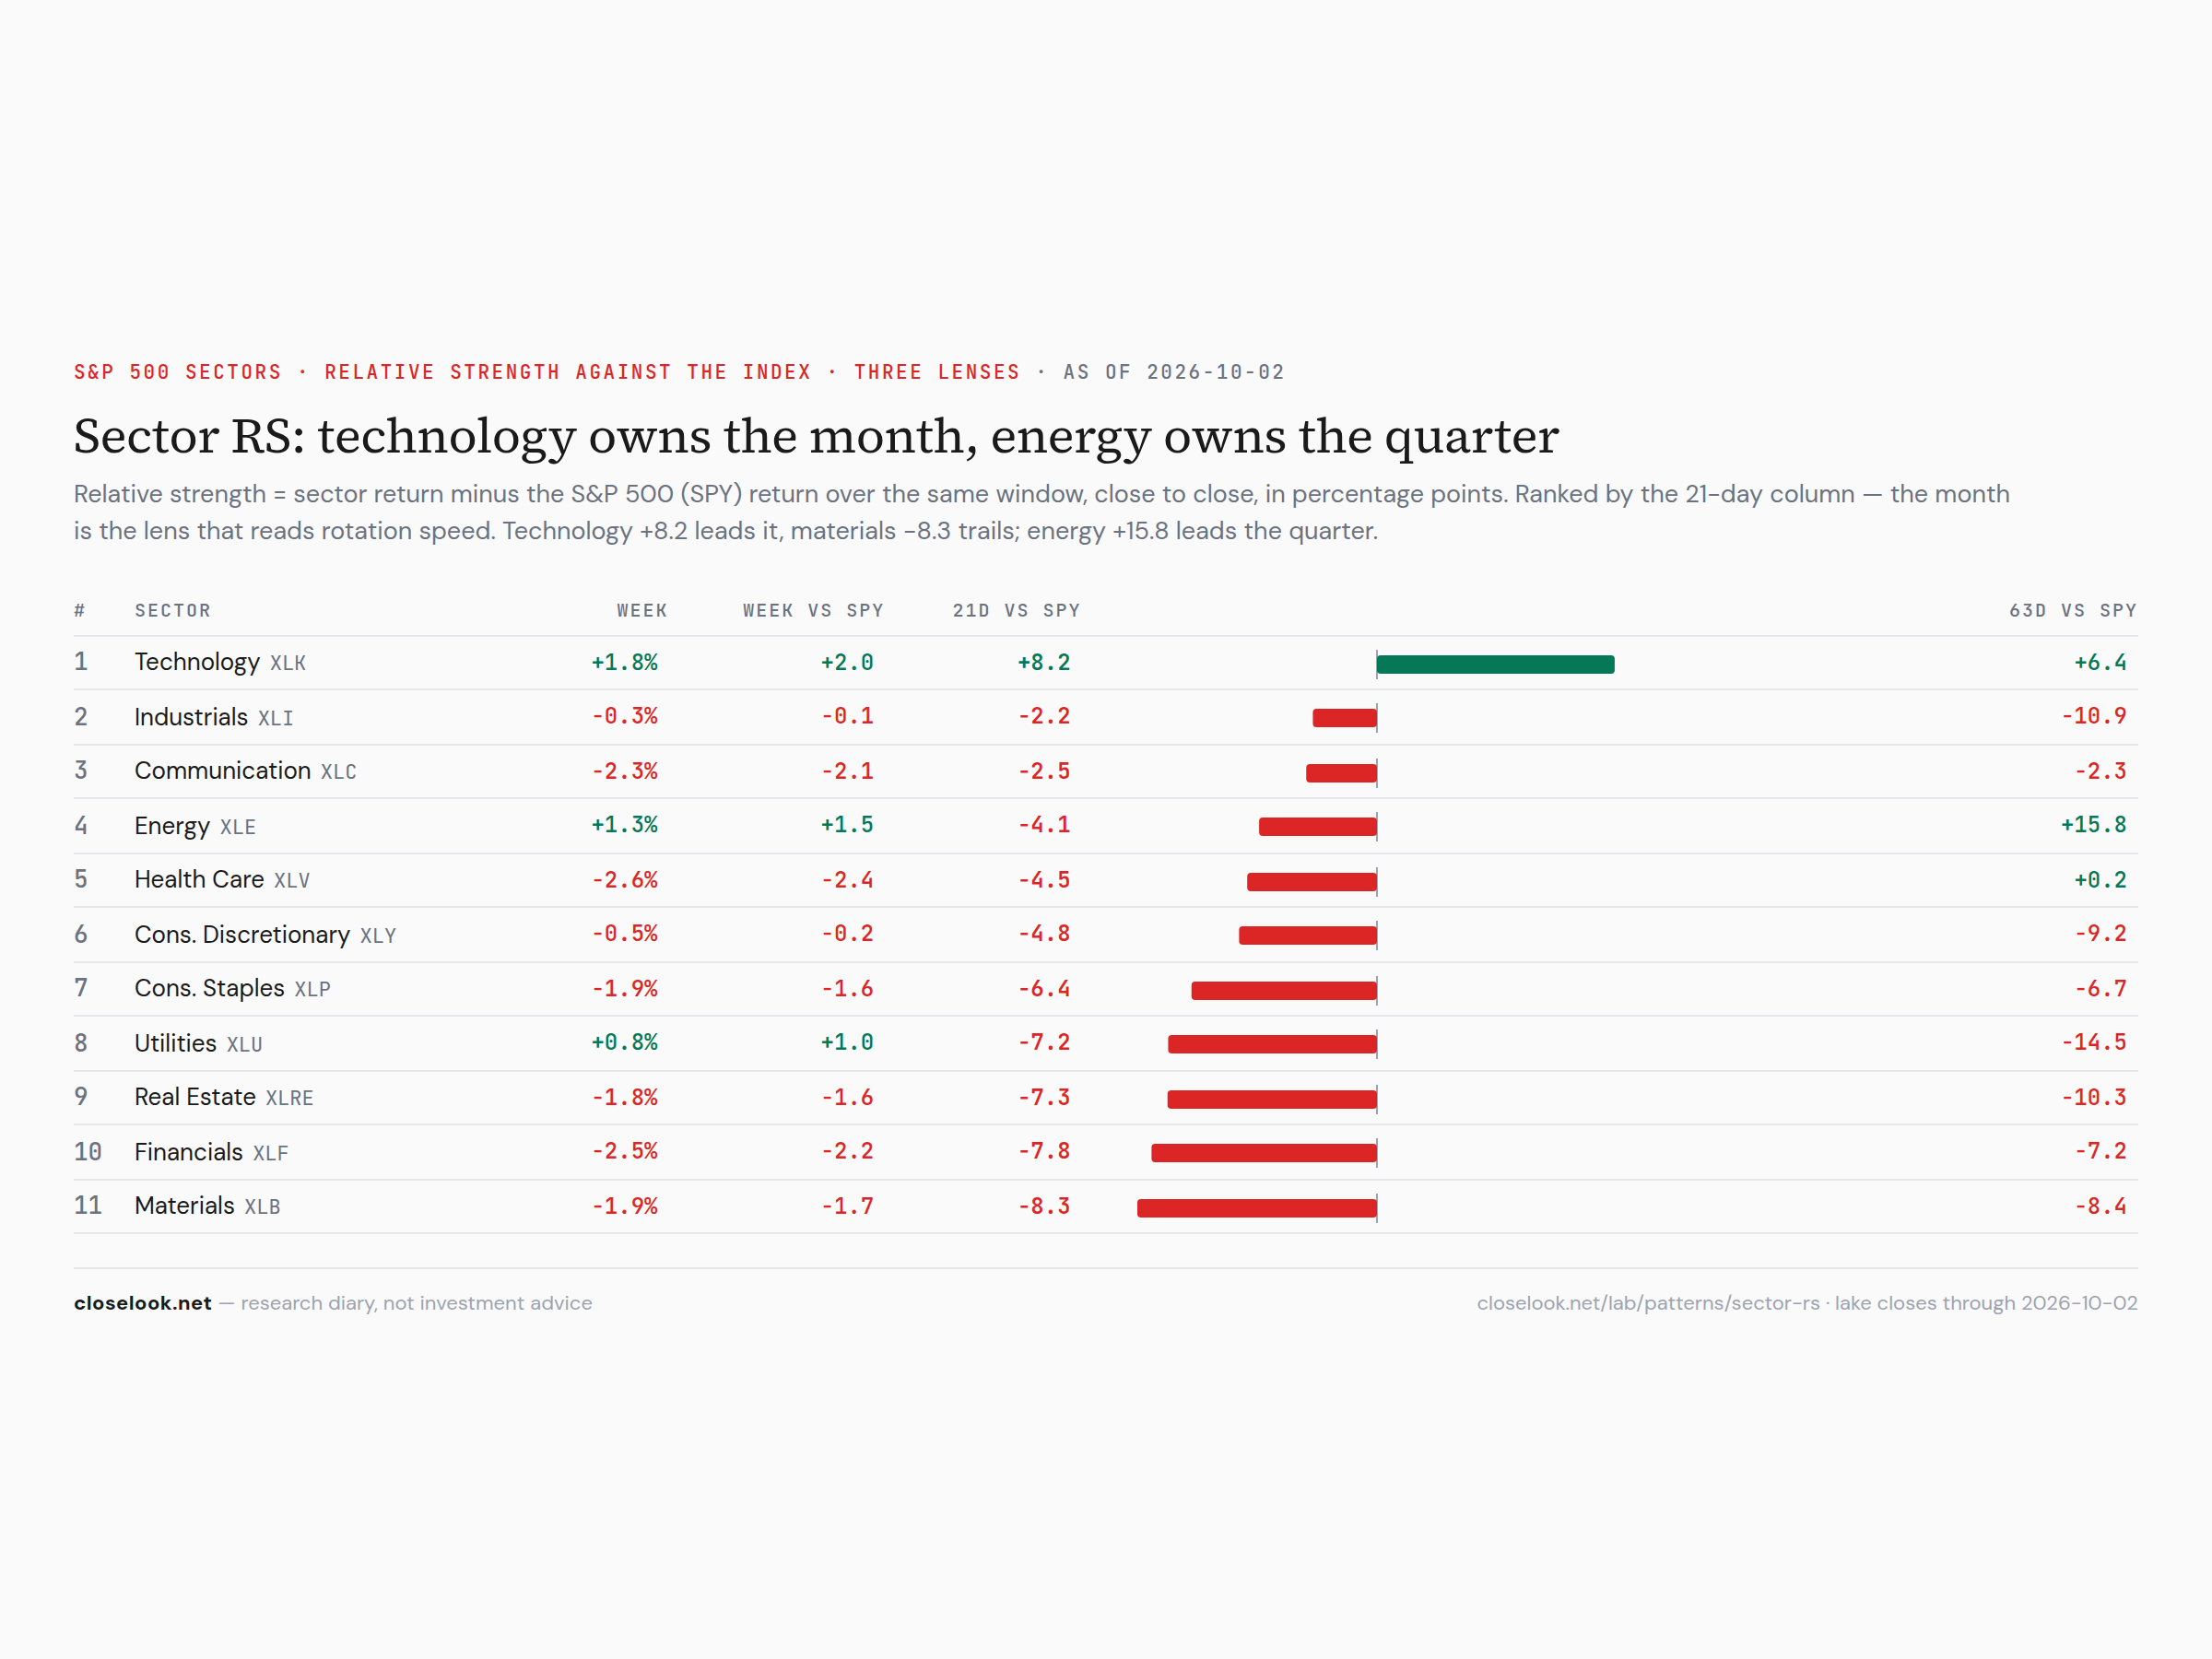
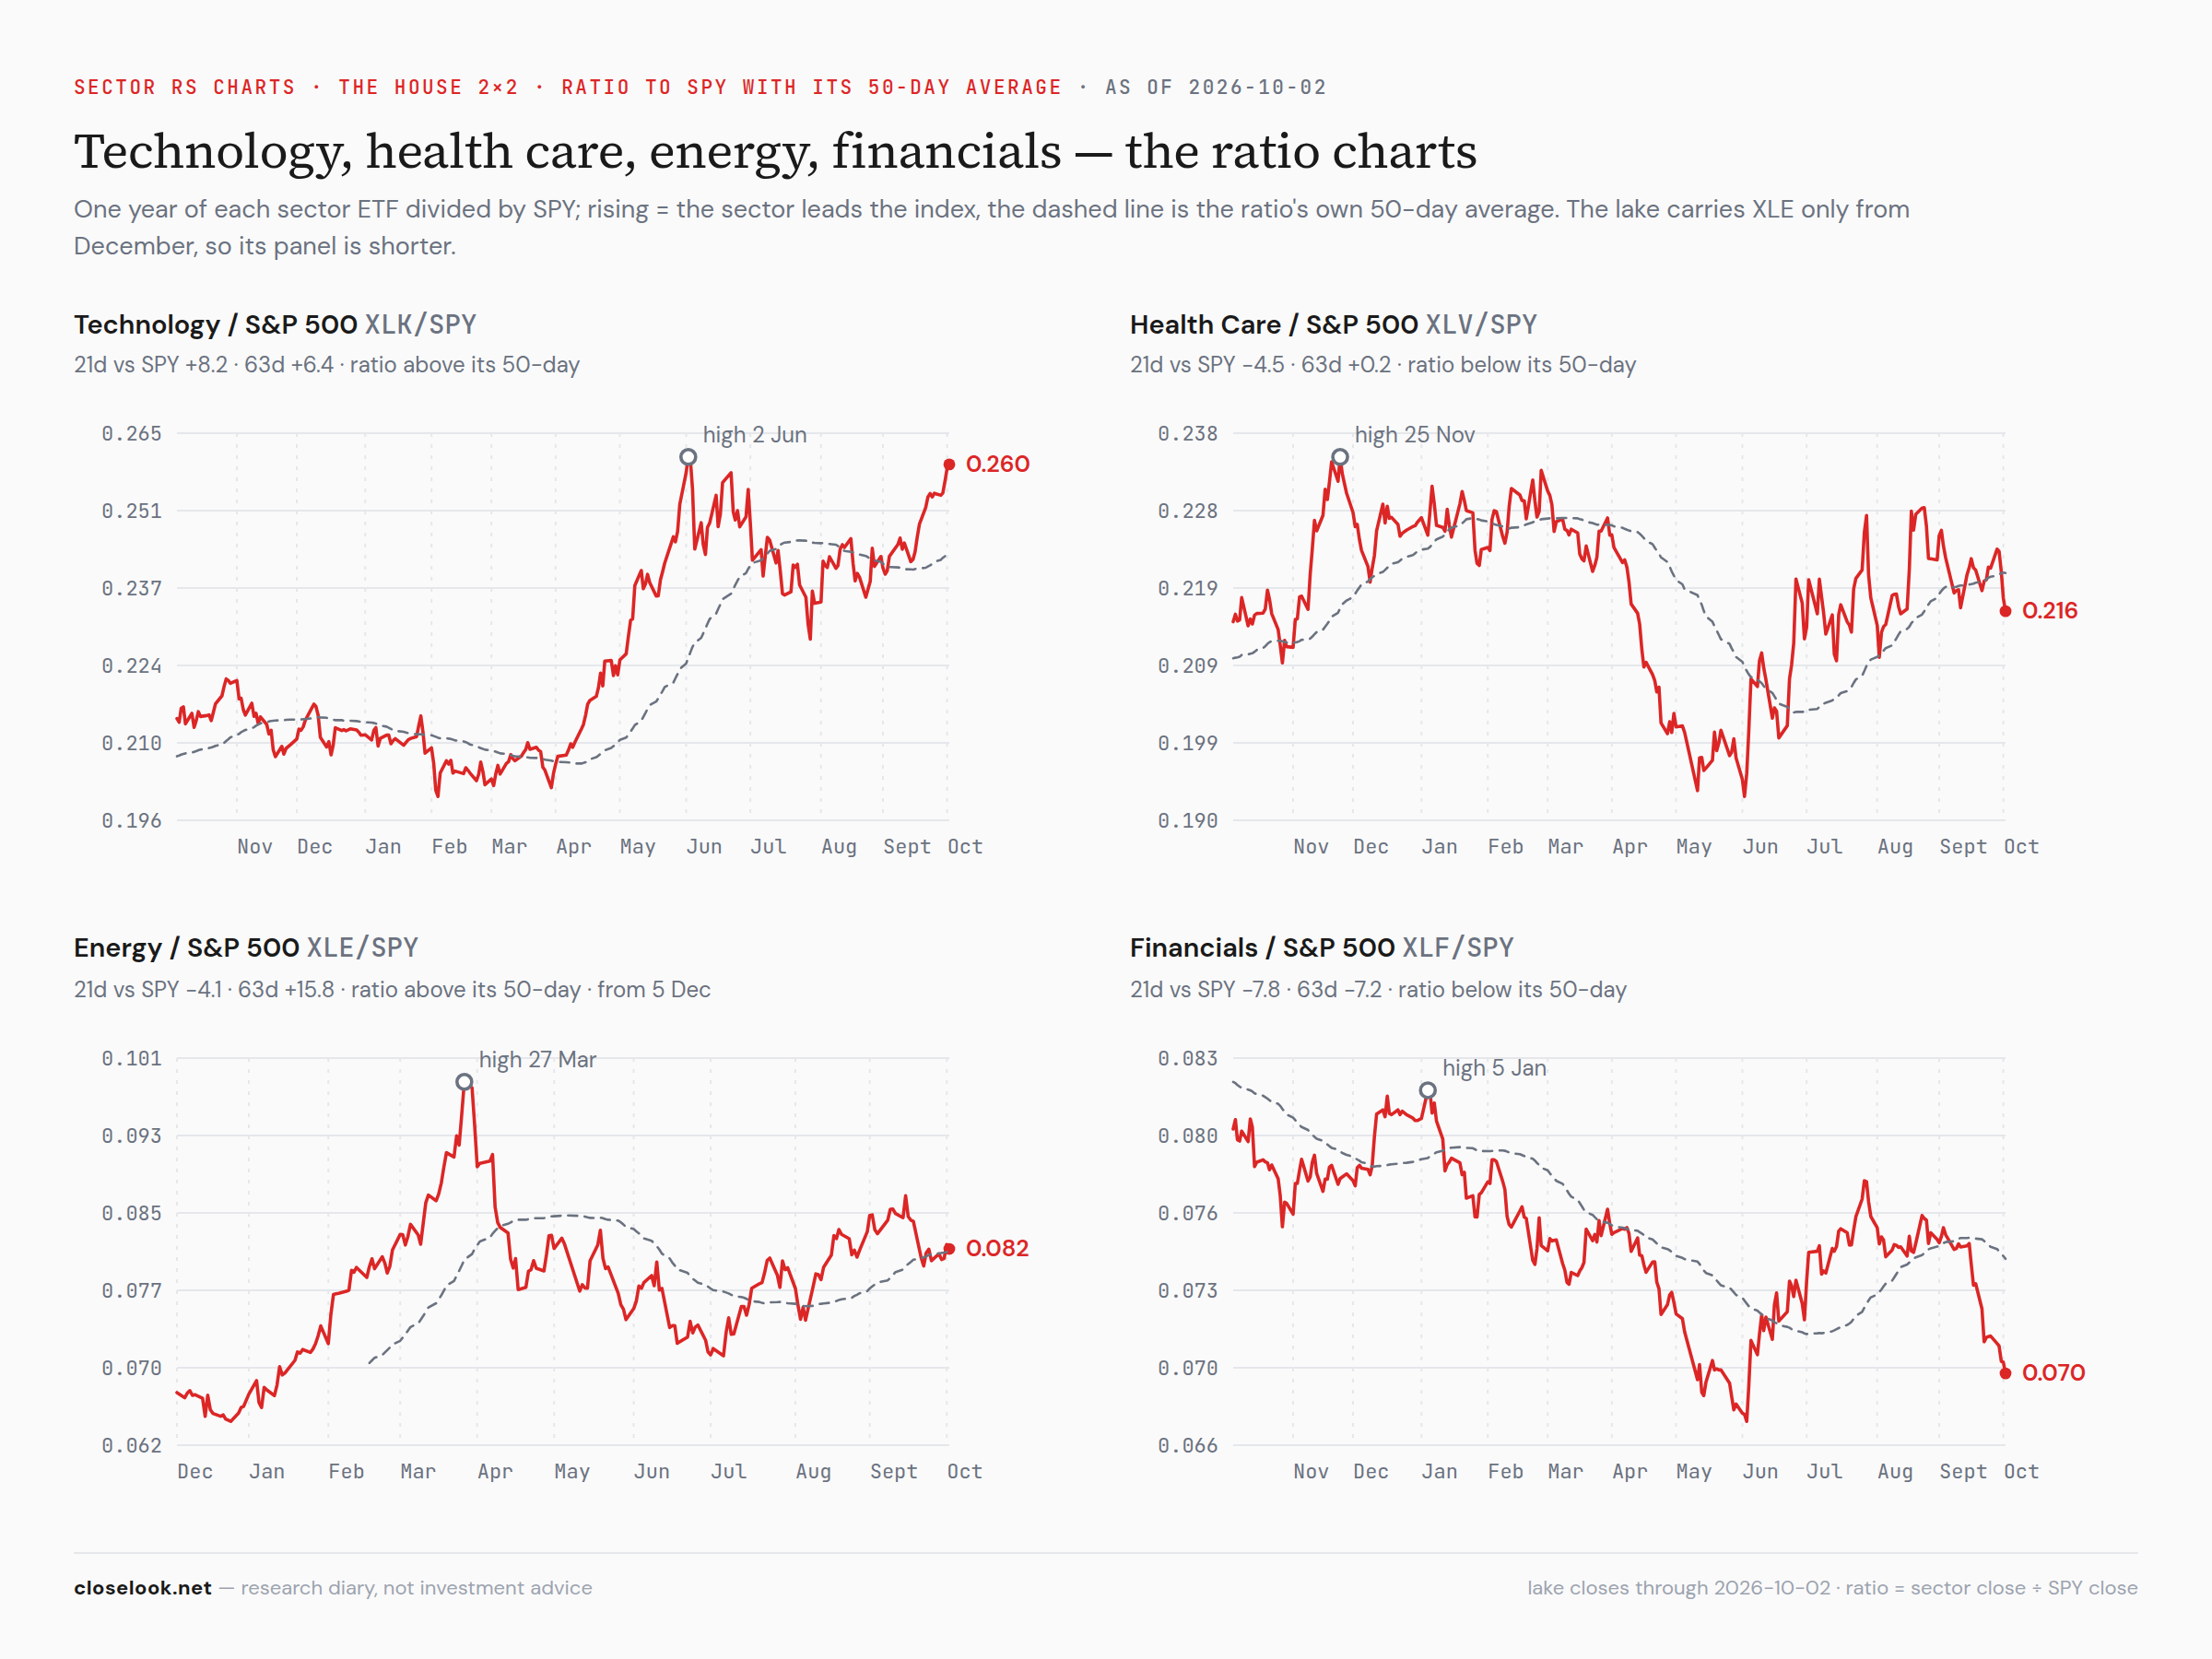
Relative strength — one sector ahead on every window. Against the S&P over the last month, technology is +8.2 points ahead and every other sector behind — financials −7.8, materials −8.3, utilities −7.2, real estate −7.3, staples −6.4, discretionary −4.8, health care −4.5, energy −4.1. Over three months energy +15.8 and technology +6.4 lead, health care is level, and utilities −14.5, industrials −10.9, real estate −10.3, discretionary −9.2 trail. A one-sector month inside a two-sector quarter.
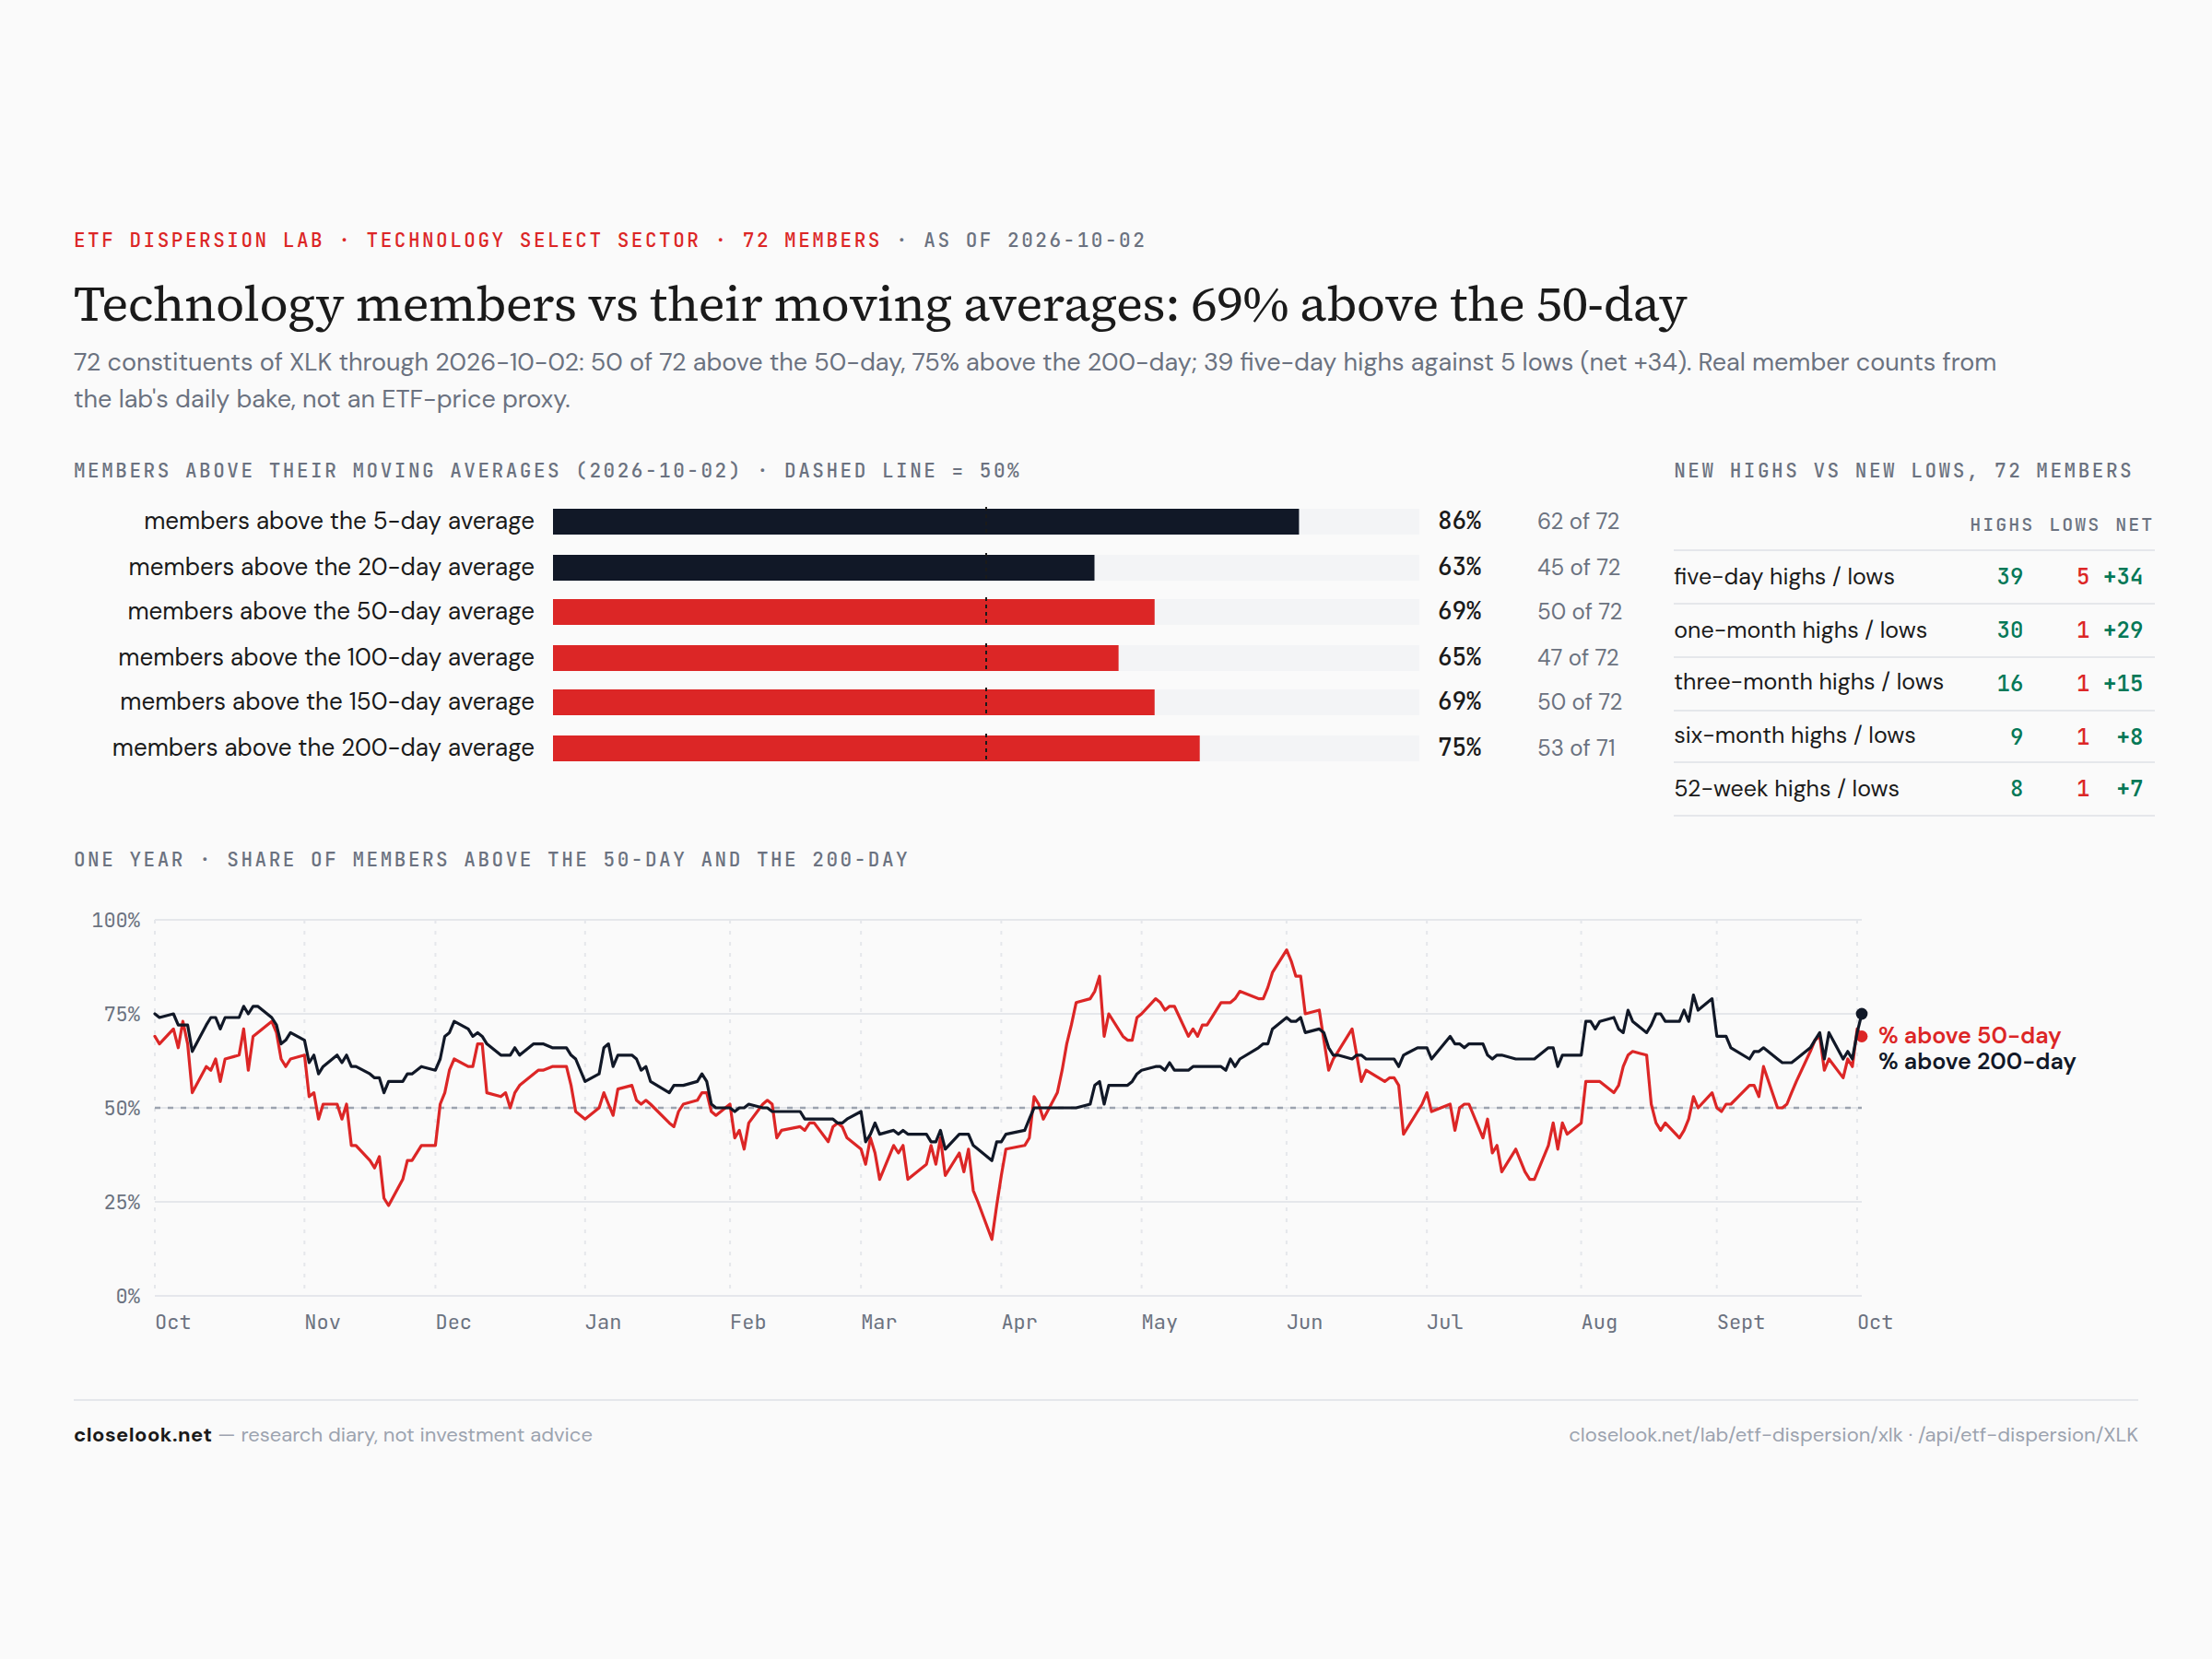
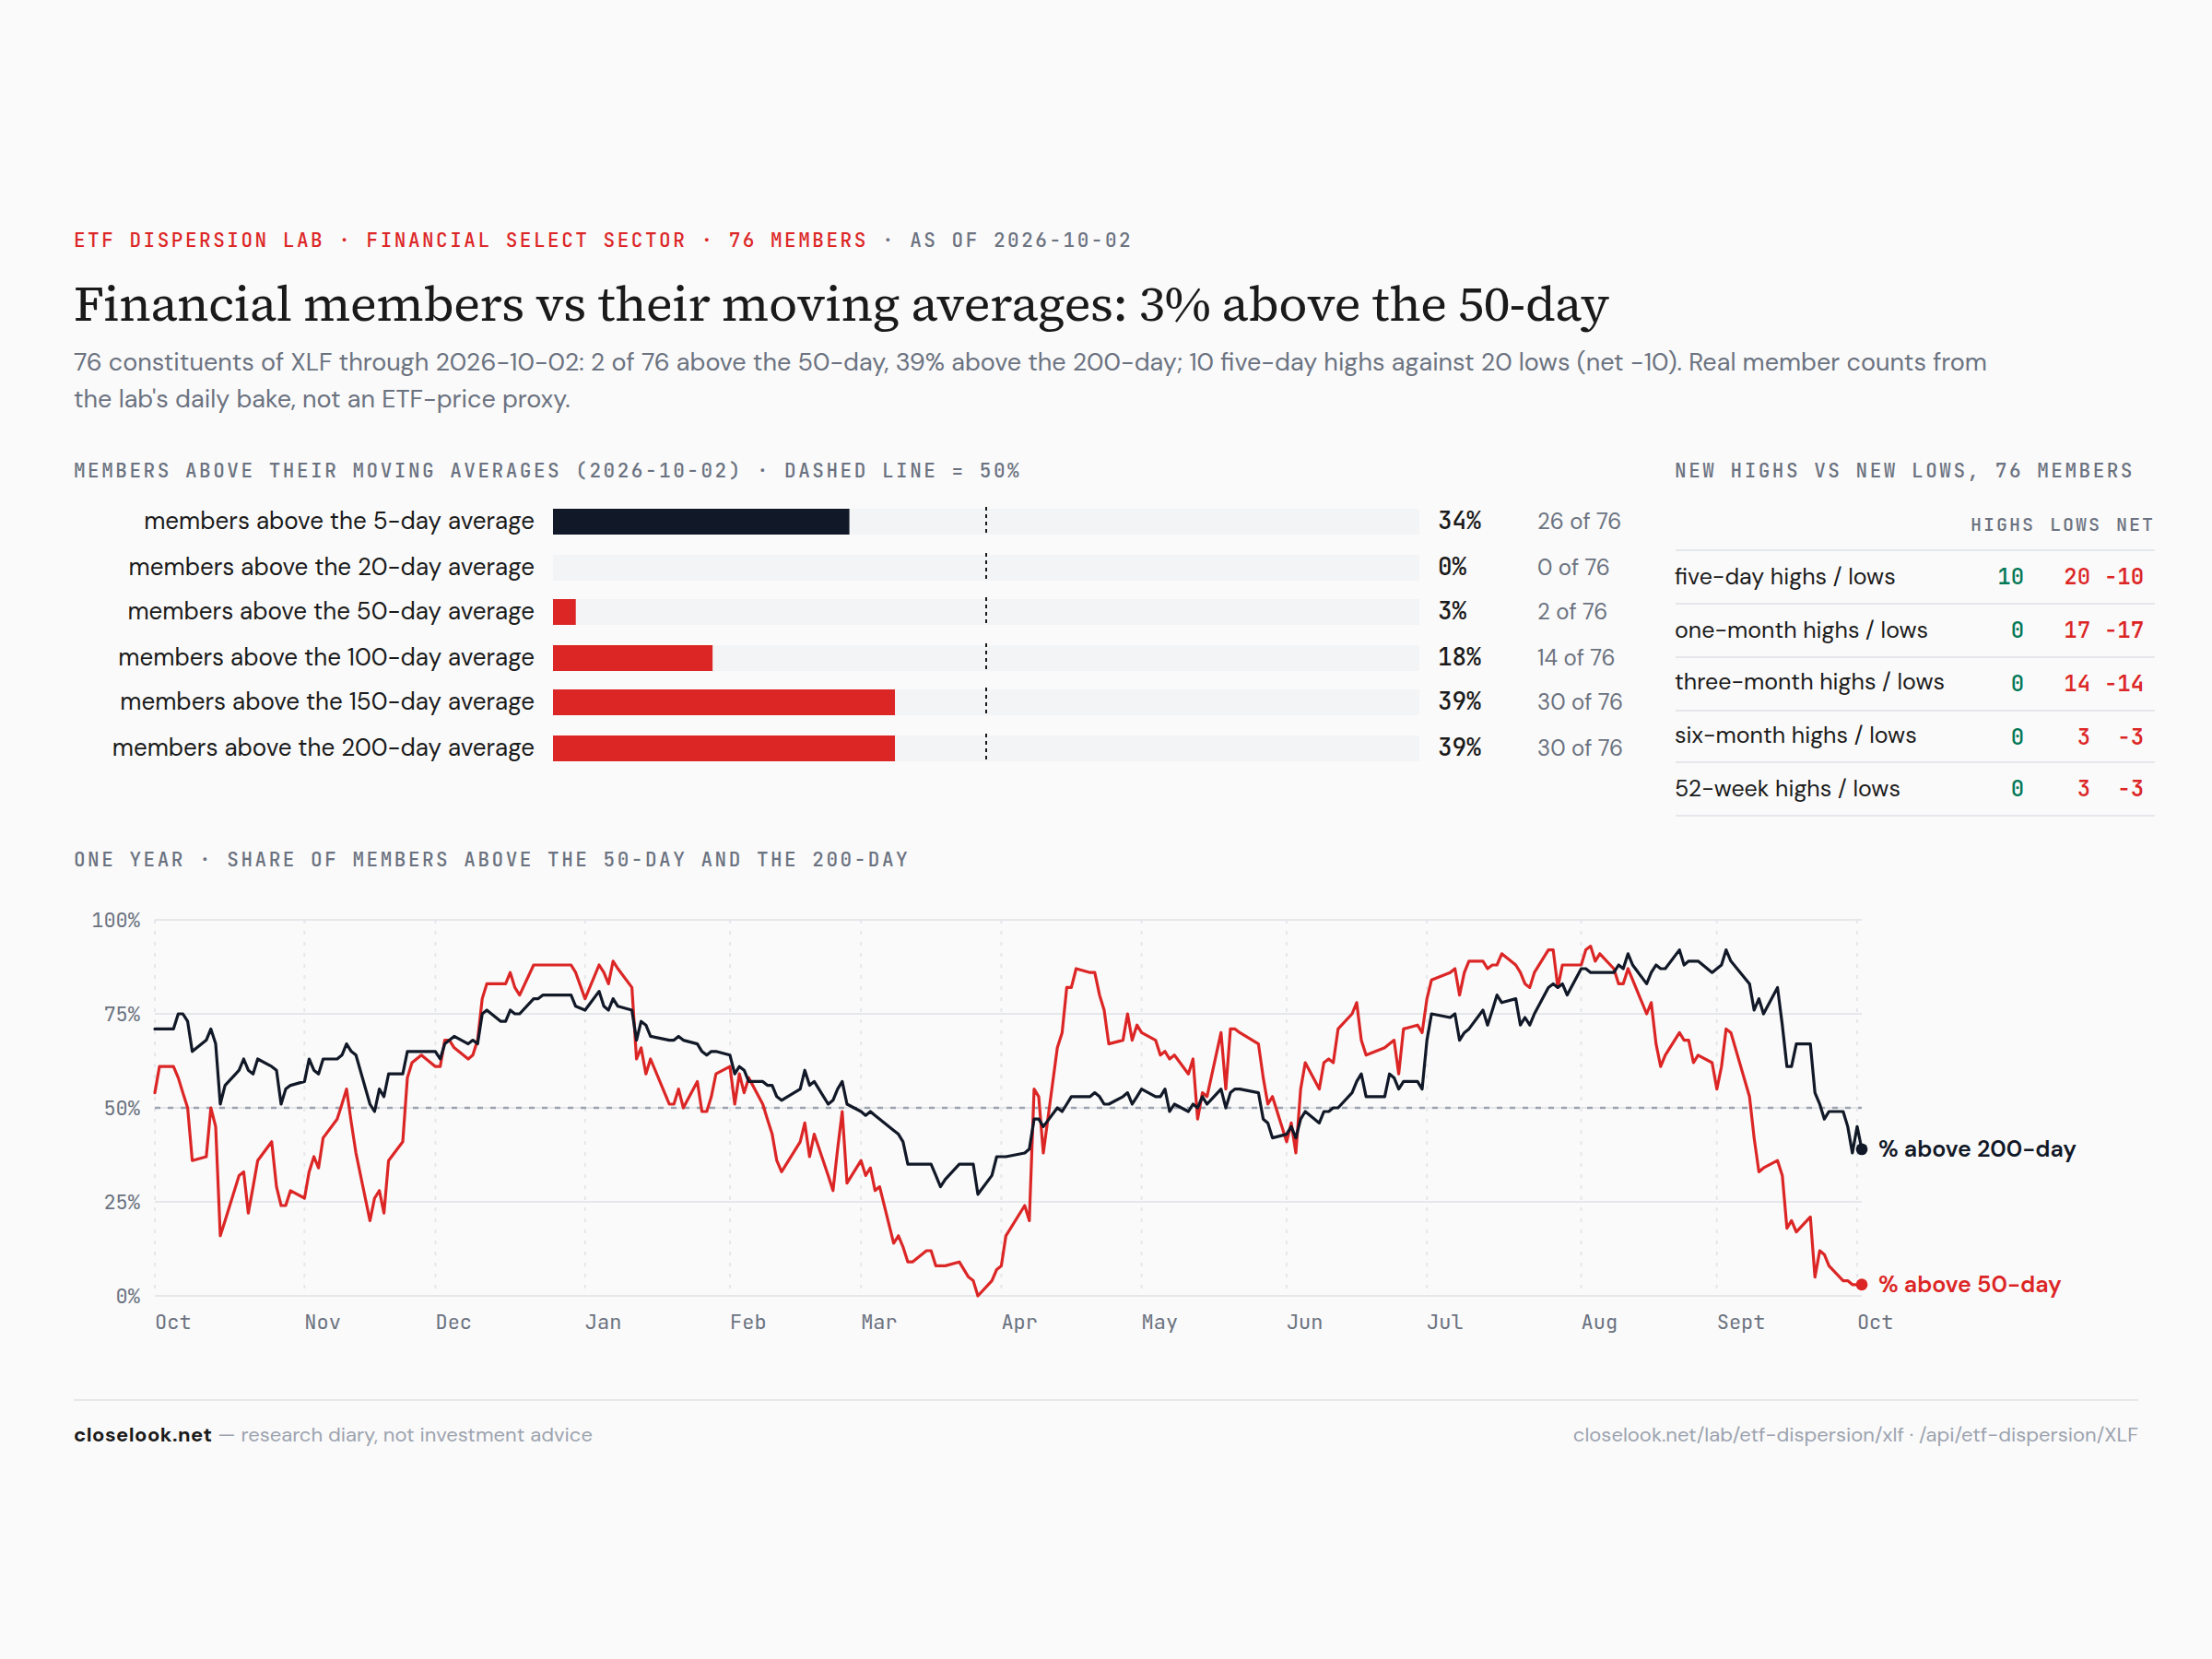
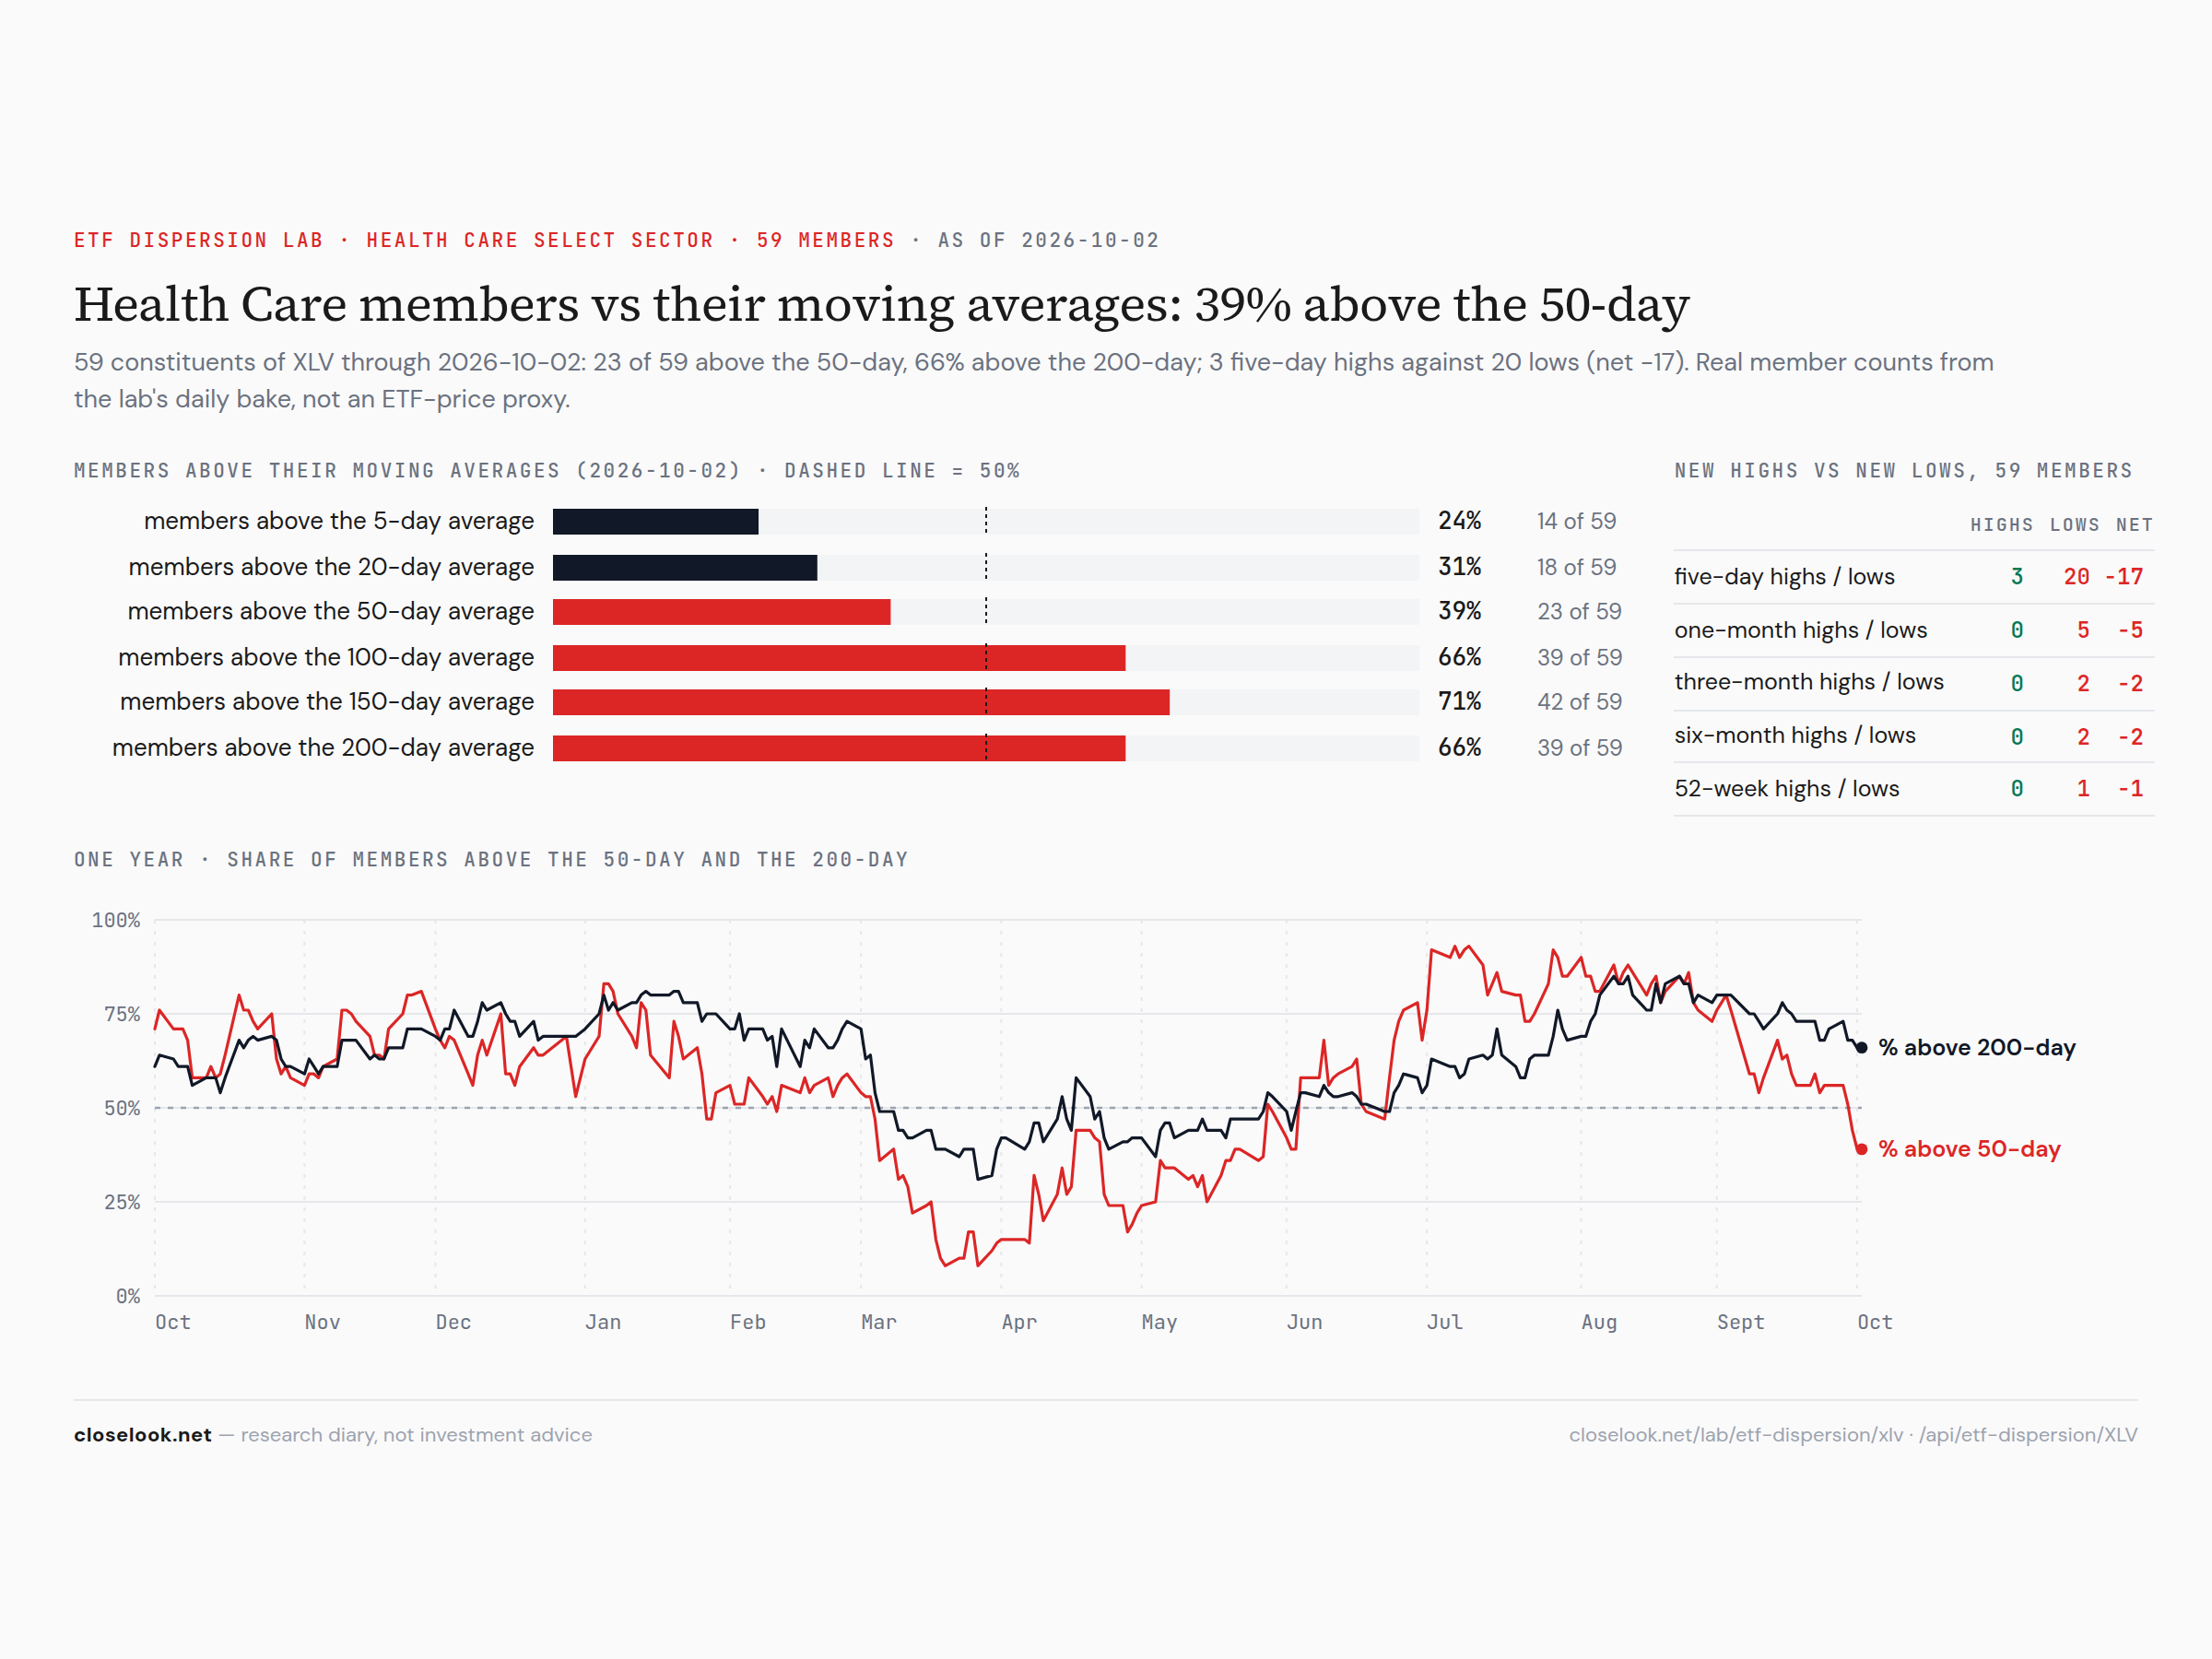
Breadth inside the sectors — a full sector and an empty one. In the tech fund, 86% of the 72 members closed above their 5-day average, 69% above their 50-day and 75% above their 200-day; 39 made a five-day high and 5 a five-day low, and 8 closed at a 52-week high. In financials the picture is the reverse: not one of the 76 members closed above its 20-day average, 2.6% above the 50-day, 39% above the 200-day; 17 made a one-month low and none a one-month high. Health care sits in between and leaning down: 39% above the 50-day, 20 five-day lows against 3 highs. A record in tech and a sector with no member above its 20-day line, in the same week.
The Nasdaq 100, cut six ways
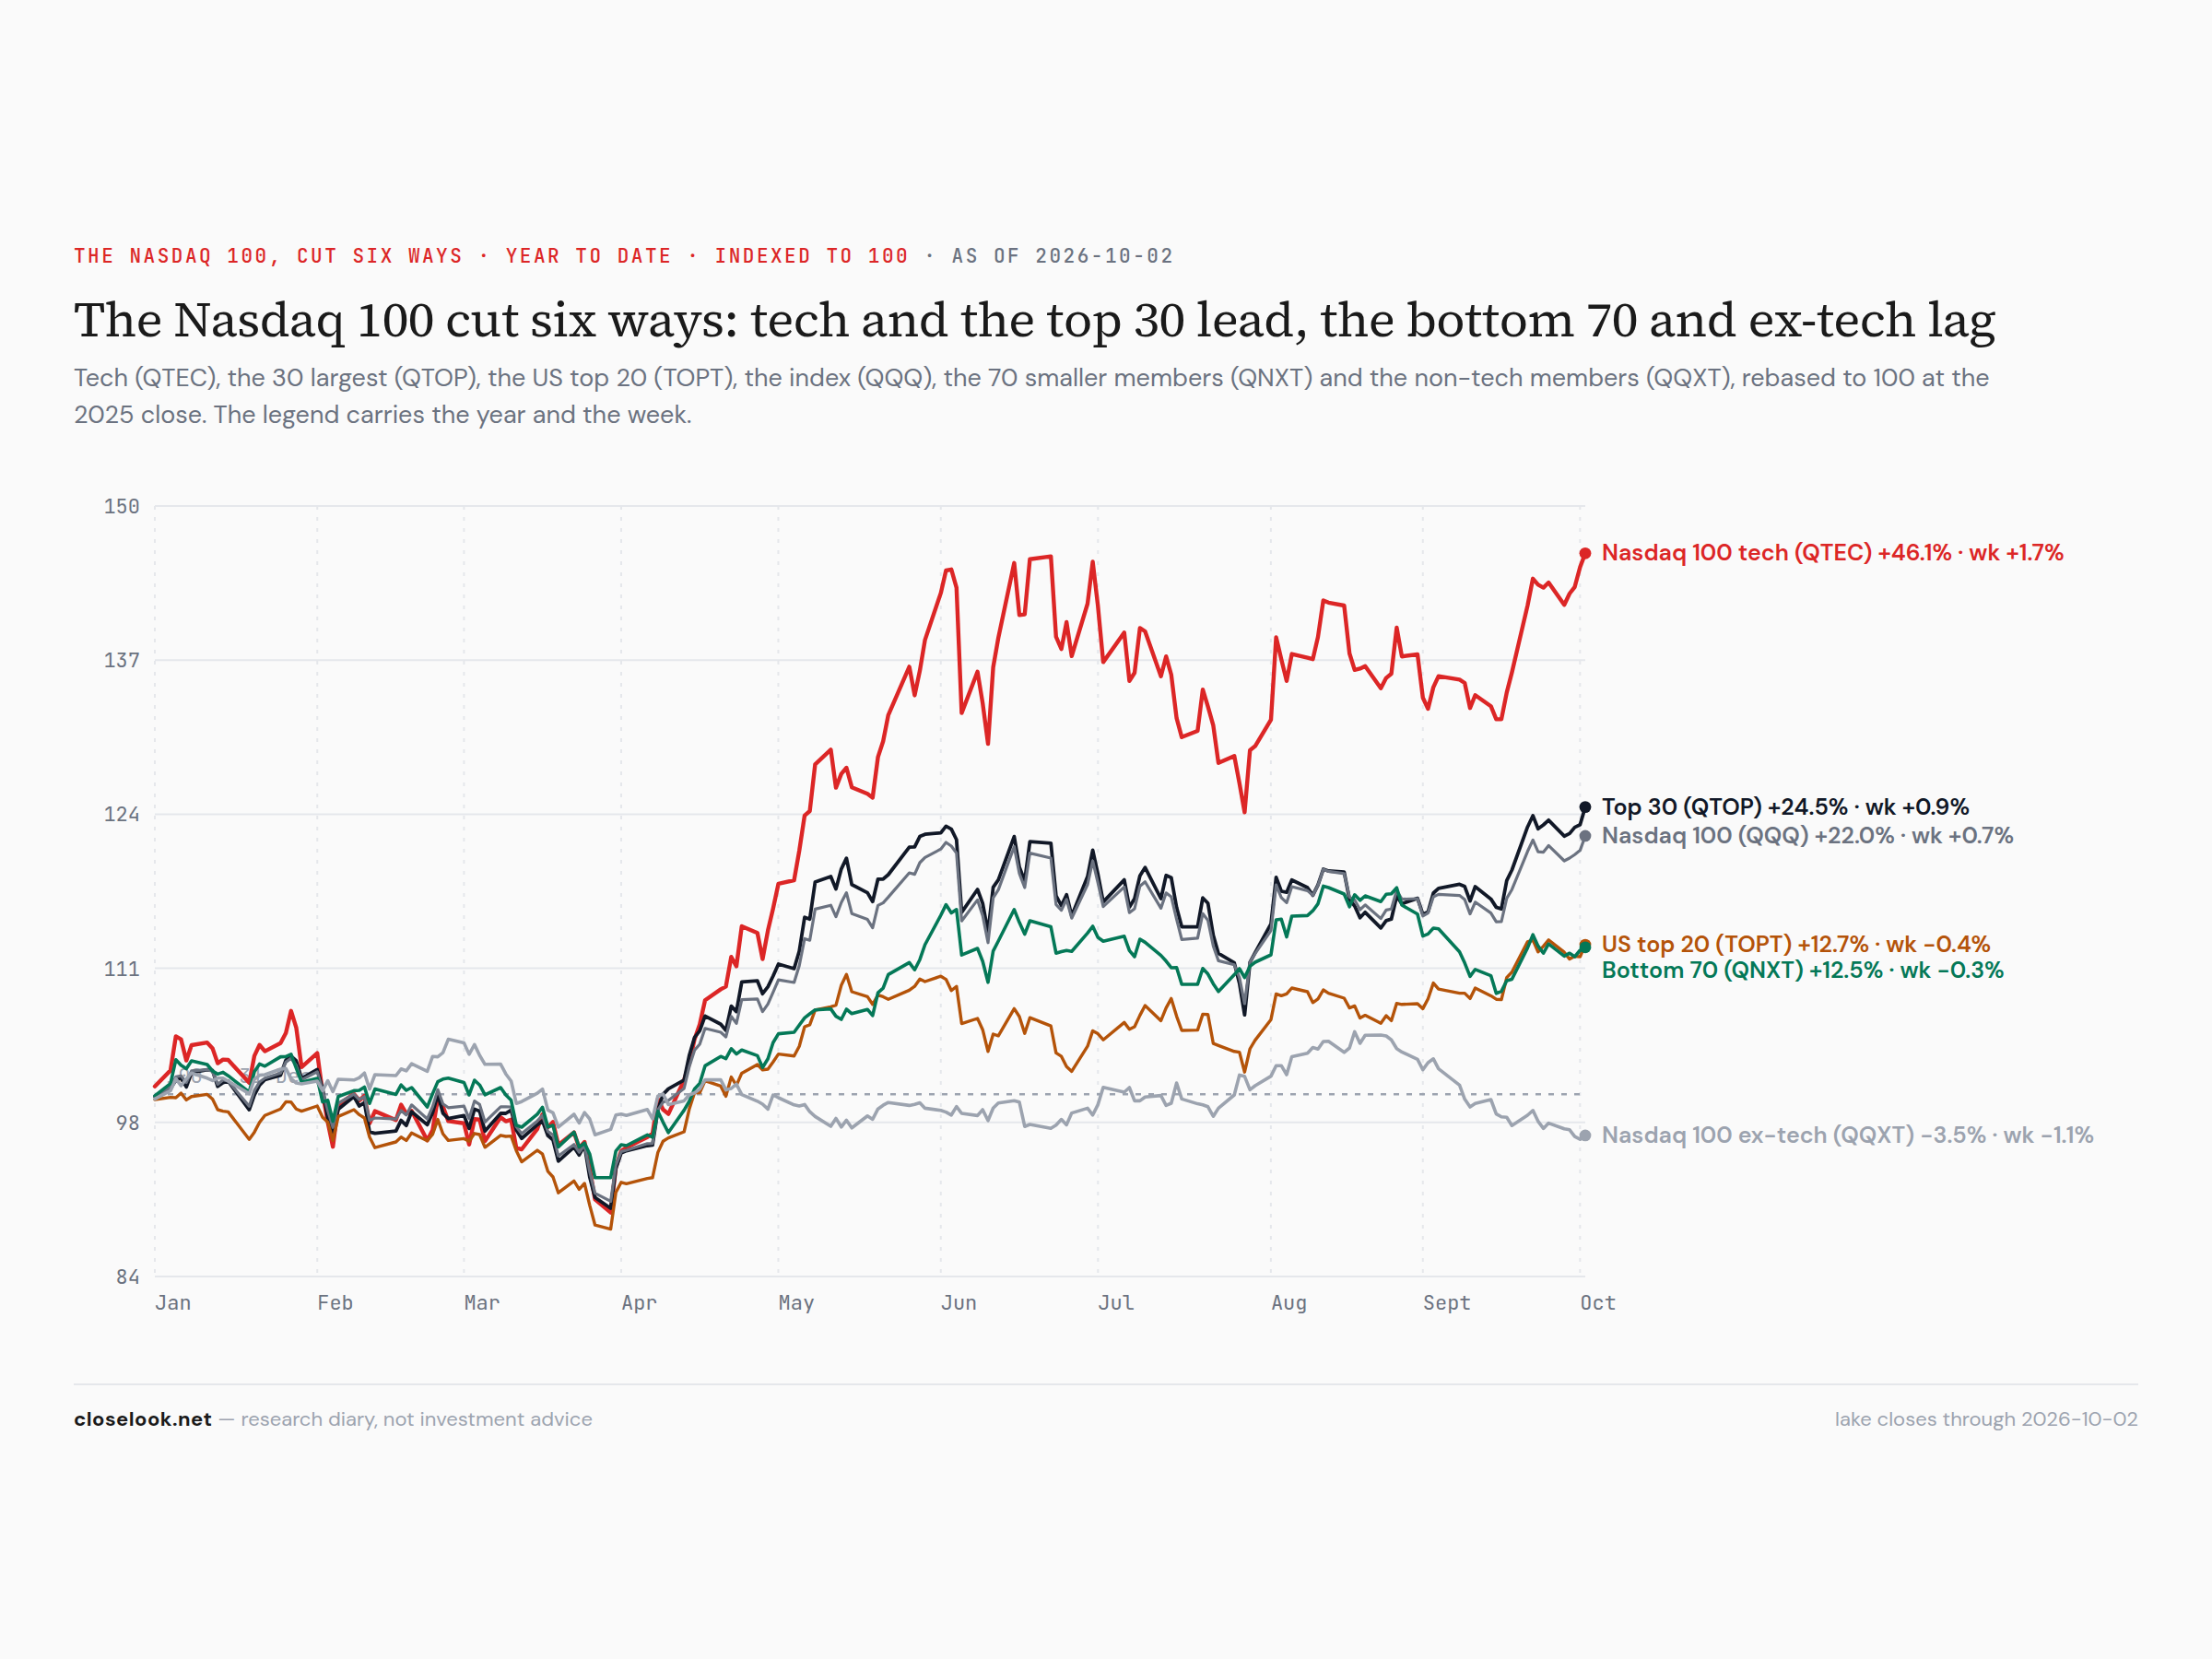
Tech and the top thirty led; the bottom seventy and the non-tech half fell. On the year: Nasdaq 100 tech +46.1% (+1.73% on the week), the top 30 +24.5% (+0.90%), the index +22.0% (+0.68%); the US top 20 +12.7% (−0.37%), the bottom 70 +12.5% (−0.3%), the non-tech members −3.5% (−1.06%). The spread between the tech half and the non-tech half of the same index is now 49.6 points on the year. The index is a record; seventy of its hundred members are not part of the record.
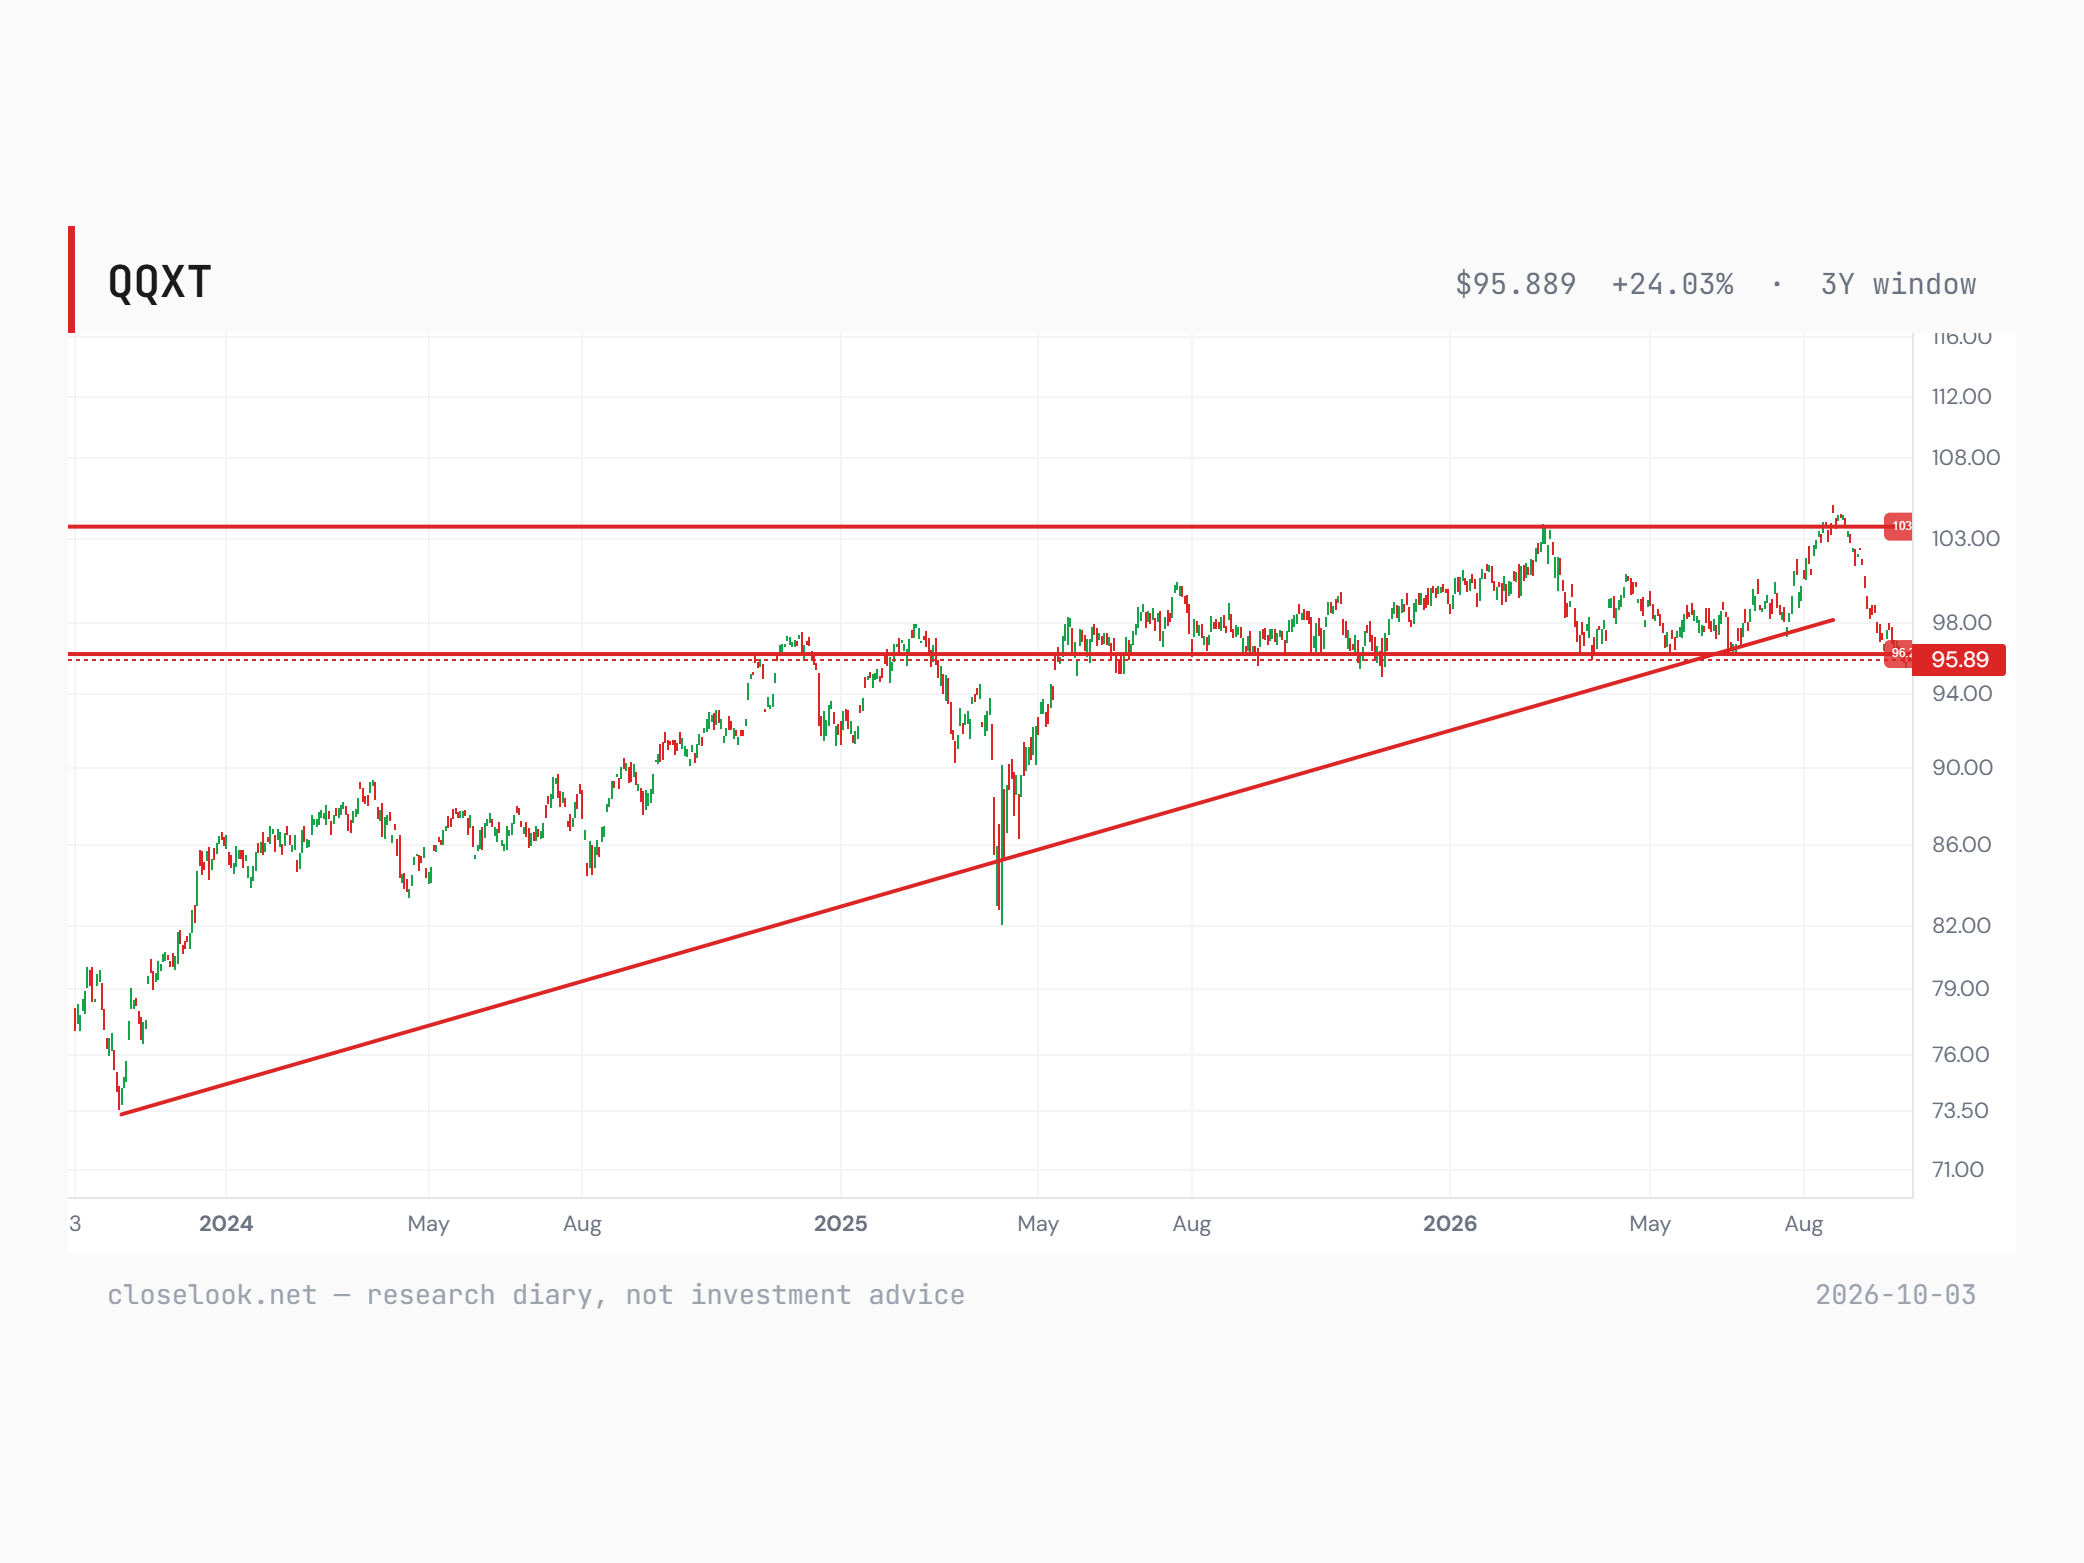
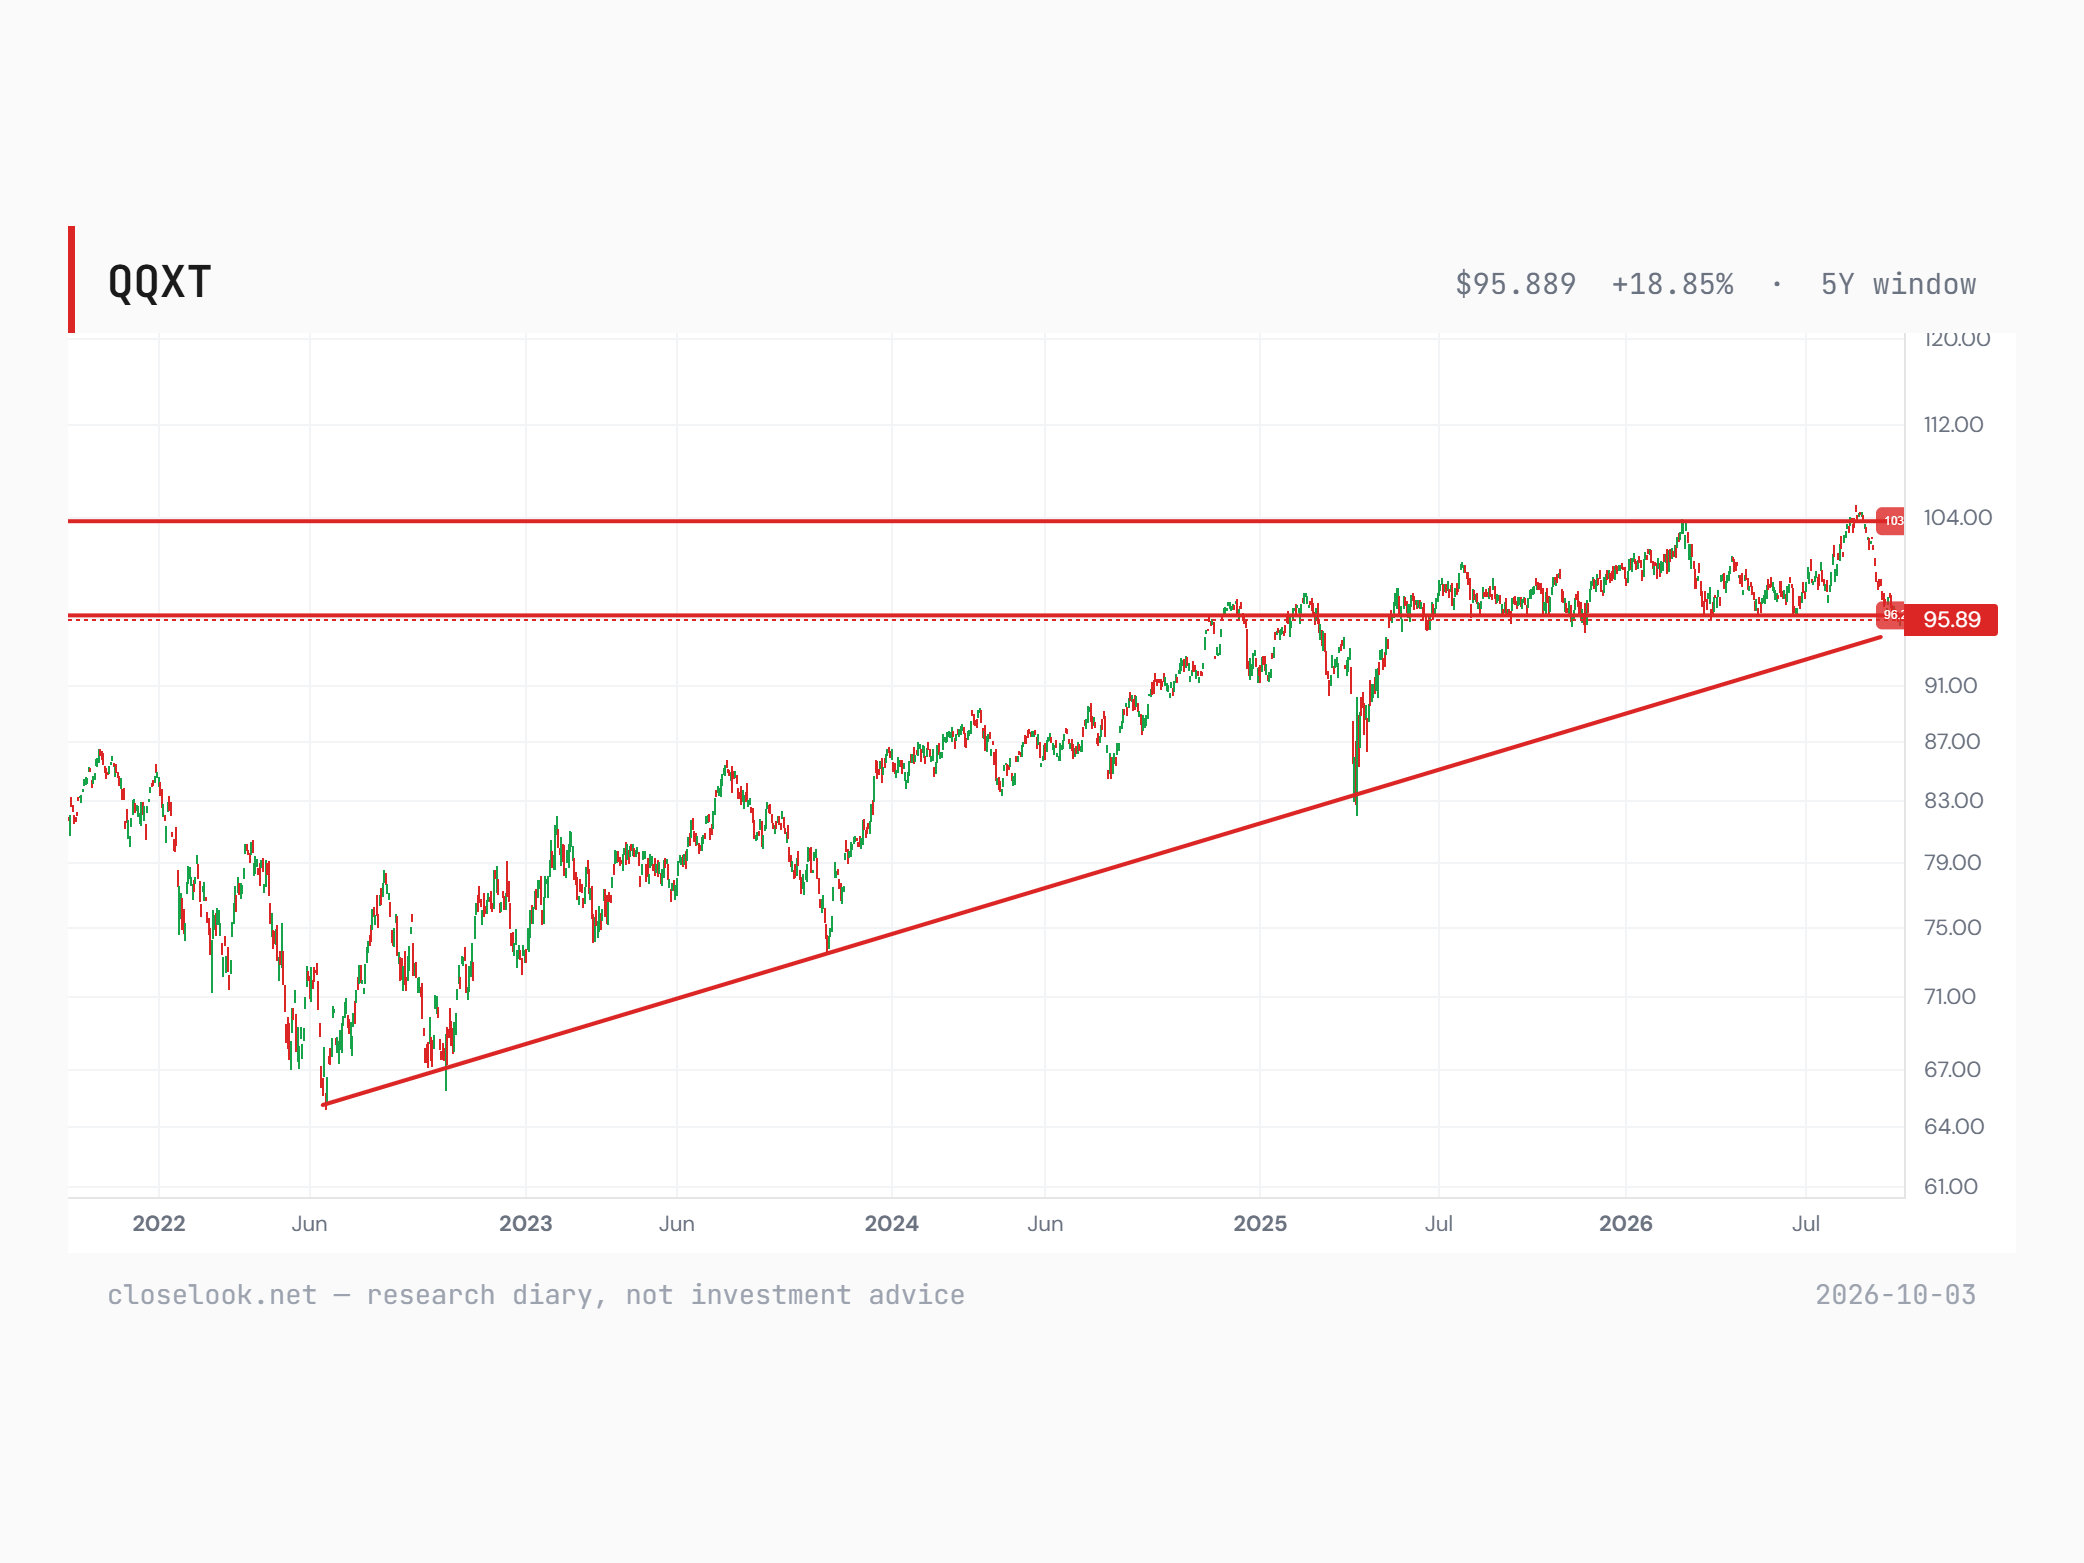
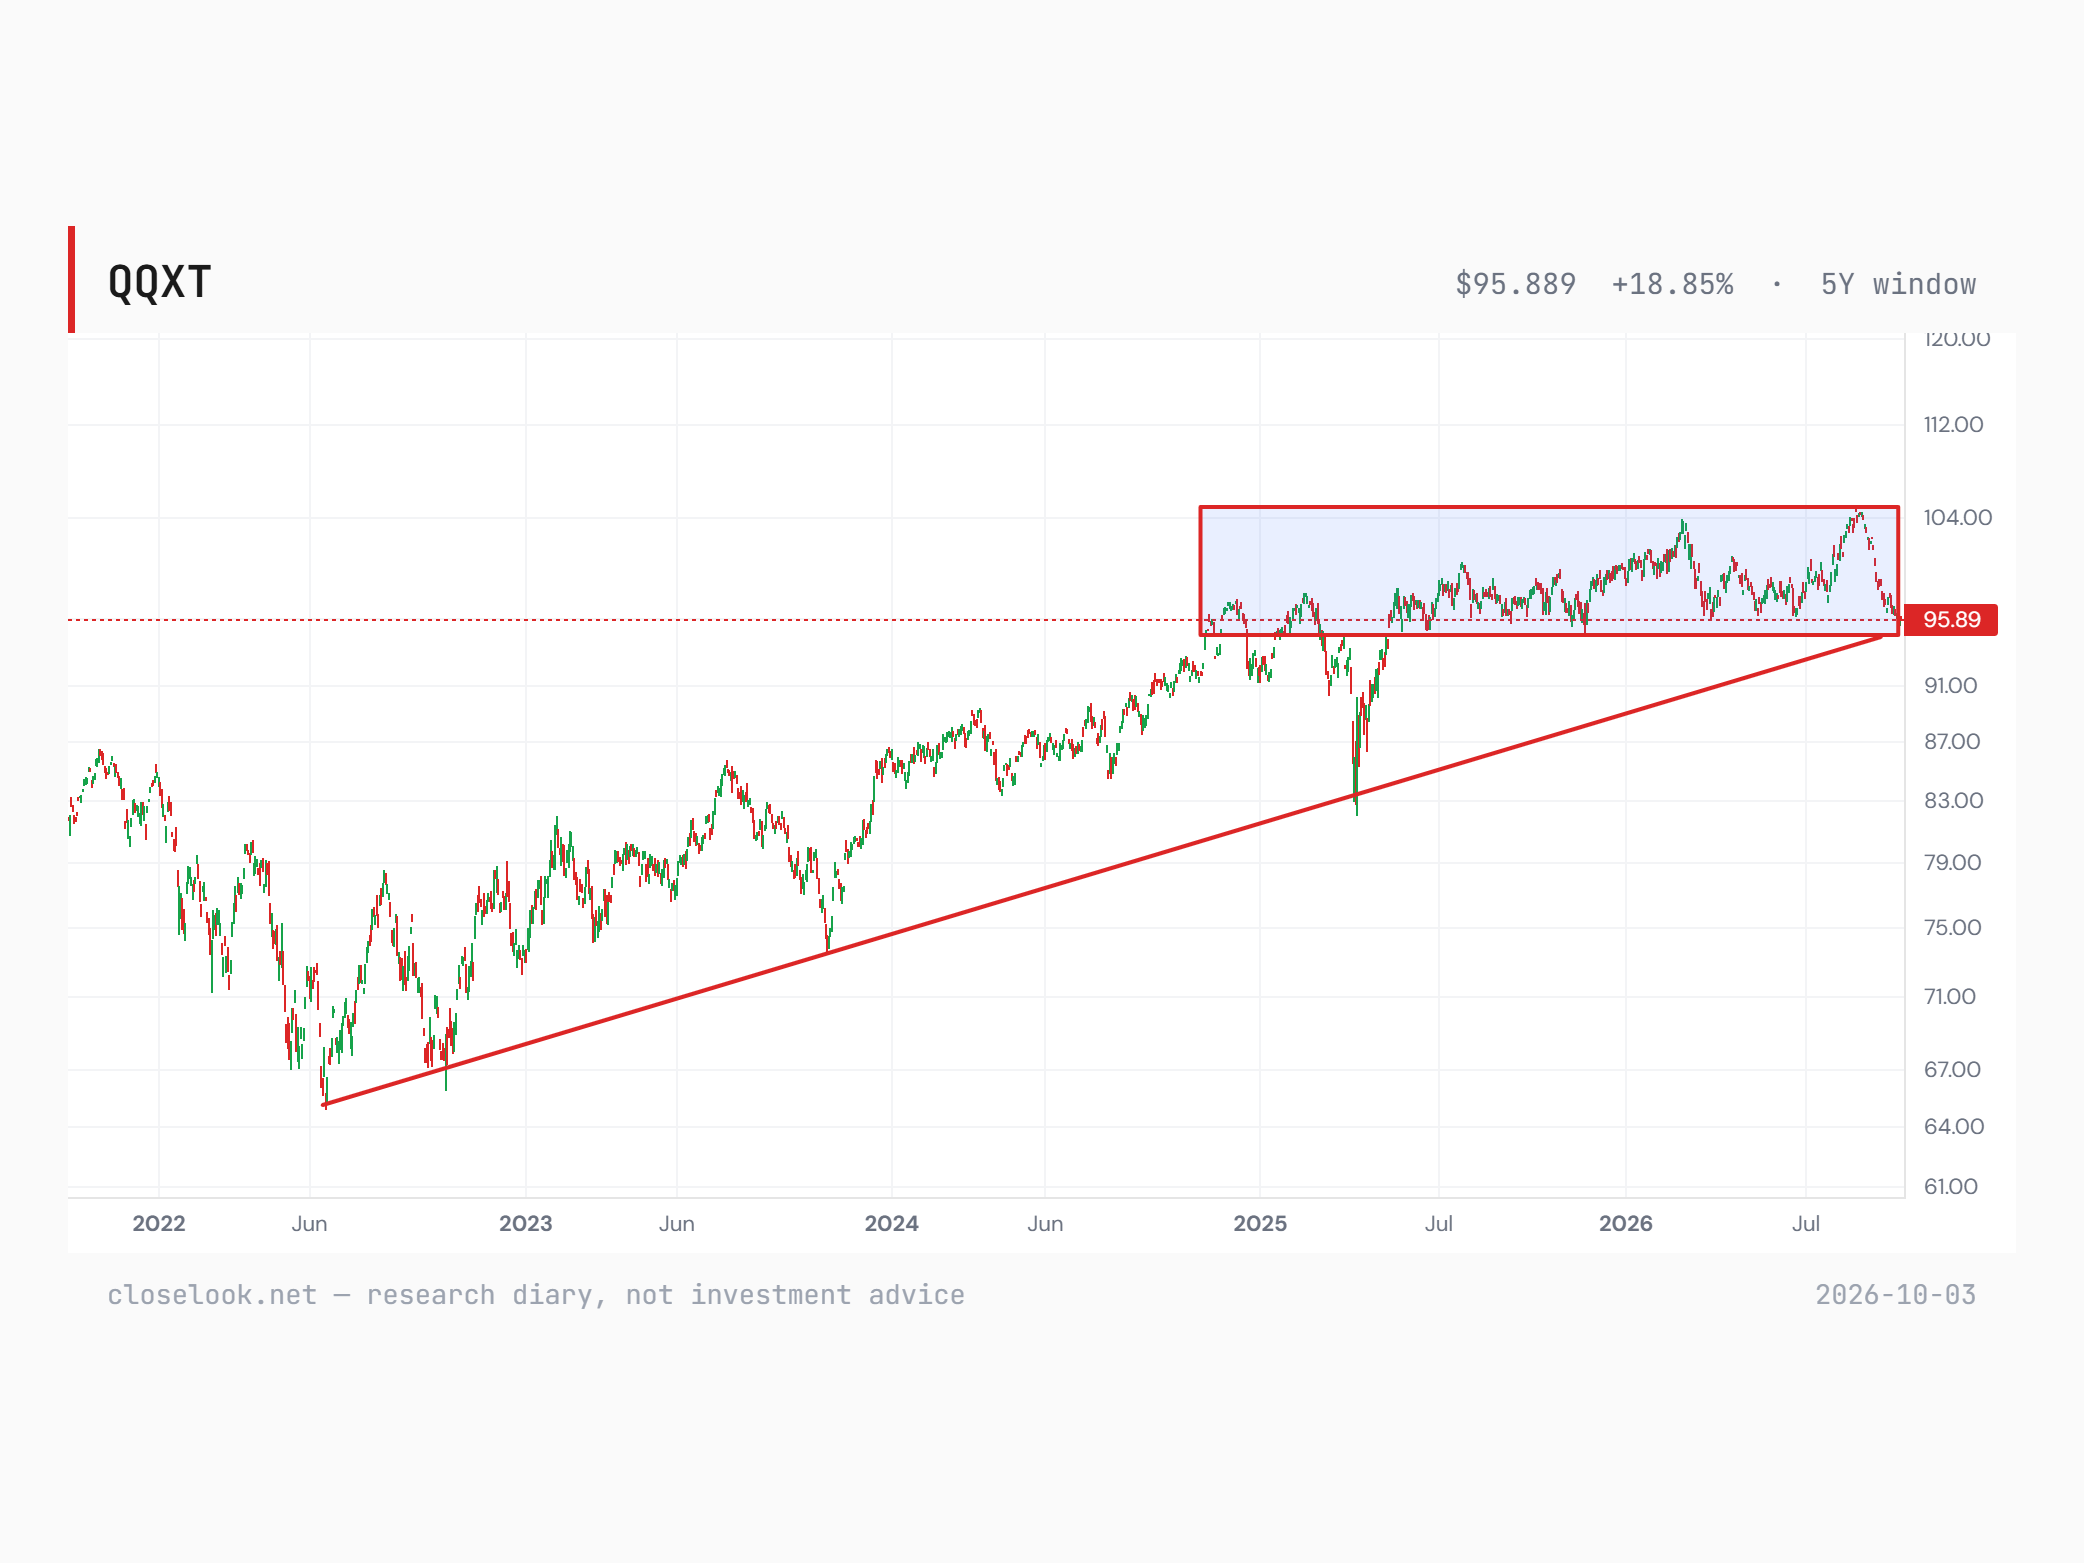
The editor's read on the non-tech half — sitting on support, and very critical. Two drawings of the same five years, and they agree on the one thing that matters: this is the line. Drawn from the October 2023 low, the rising line of the non-tech Nasdaq's bull market broke in September — the fund fell through it from its August high near 104 and closed the week at 95.89, also just under the 96.2 shelf that has caught every pullback since the middle of 2025, with 103–104 the ceiling above. Drawn from the June 2022 low through the October 2023 and April 2025 lows, the longer line is still intact, and the fund is sitting on it — the bull market that began in 2022 is not over on that reading, but it has no room left. Either way the non-tech half of the Nasdaq 100 is at the place where a three-year advance either holds or ends. The editor's rectangle adds the time: since the autumn of 2024 — the fund first closed at this level on 6 November 2024, at 95.97 — it has gone sideways in a box between about 95 and 104: two years of dead capital on the price (−0.1% since that first close), while the tech half of the same index rose 72% and the whole index 48%. A weekly close back above 96.2 says the shelf held; a weekly close under the long line from 2022 says the bull in what is not technology is over.
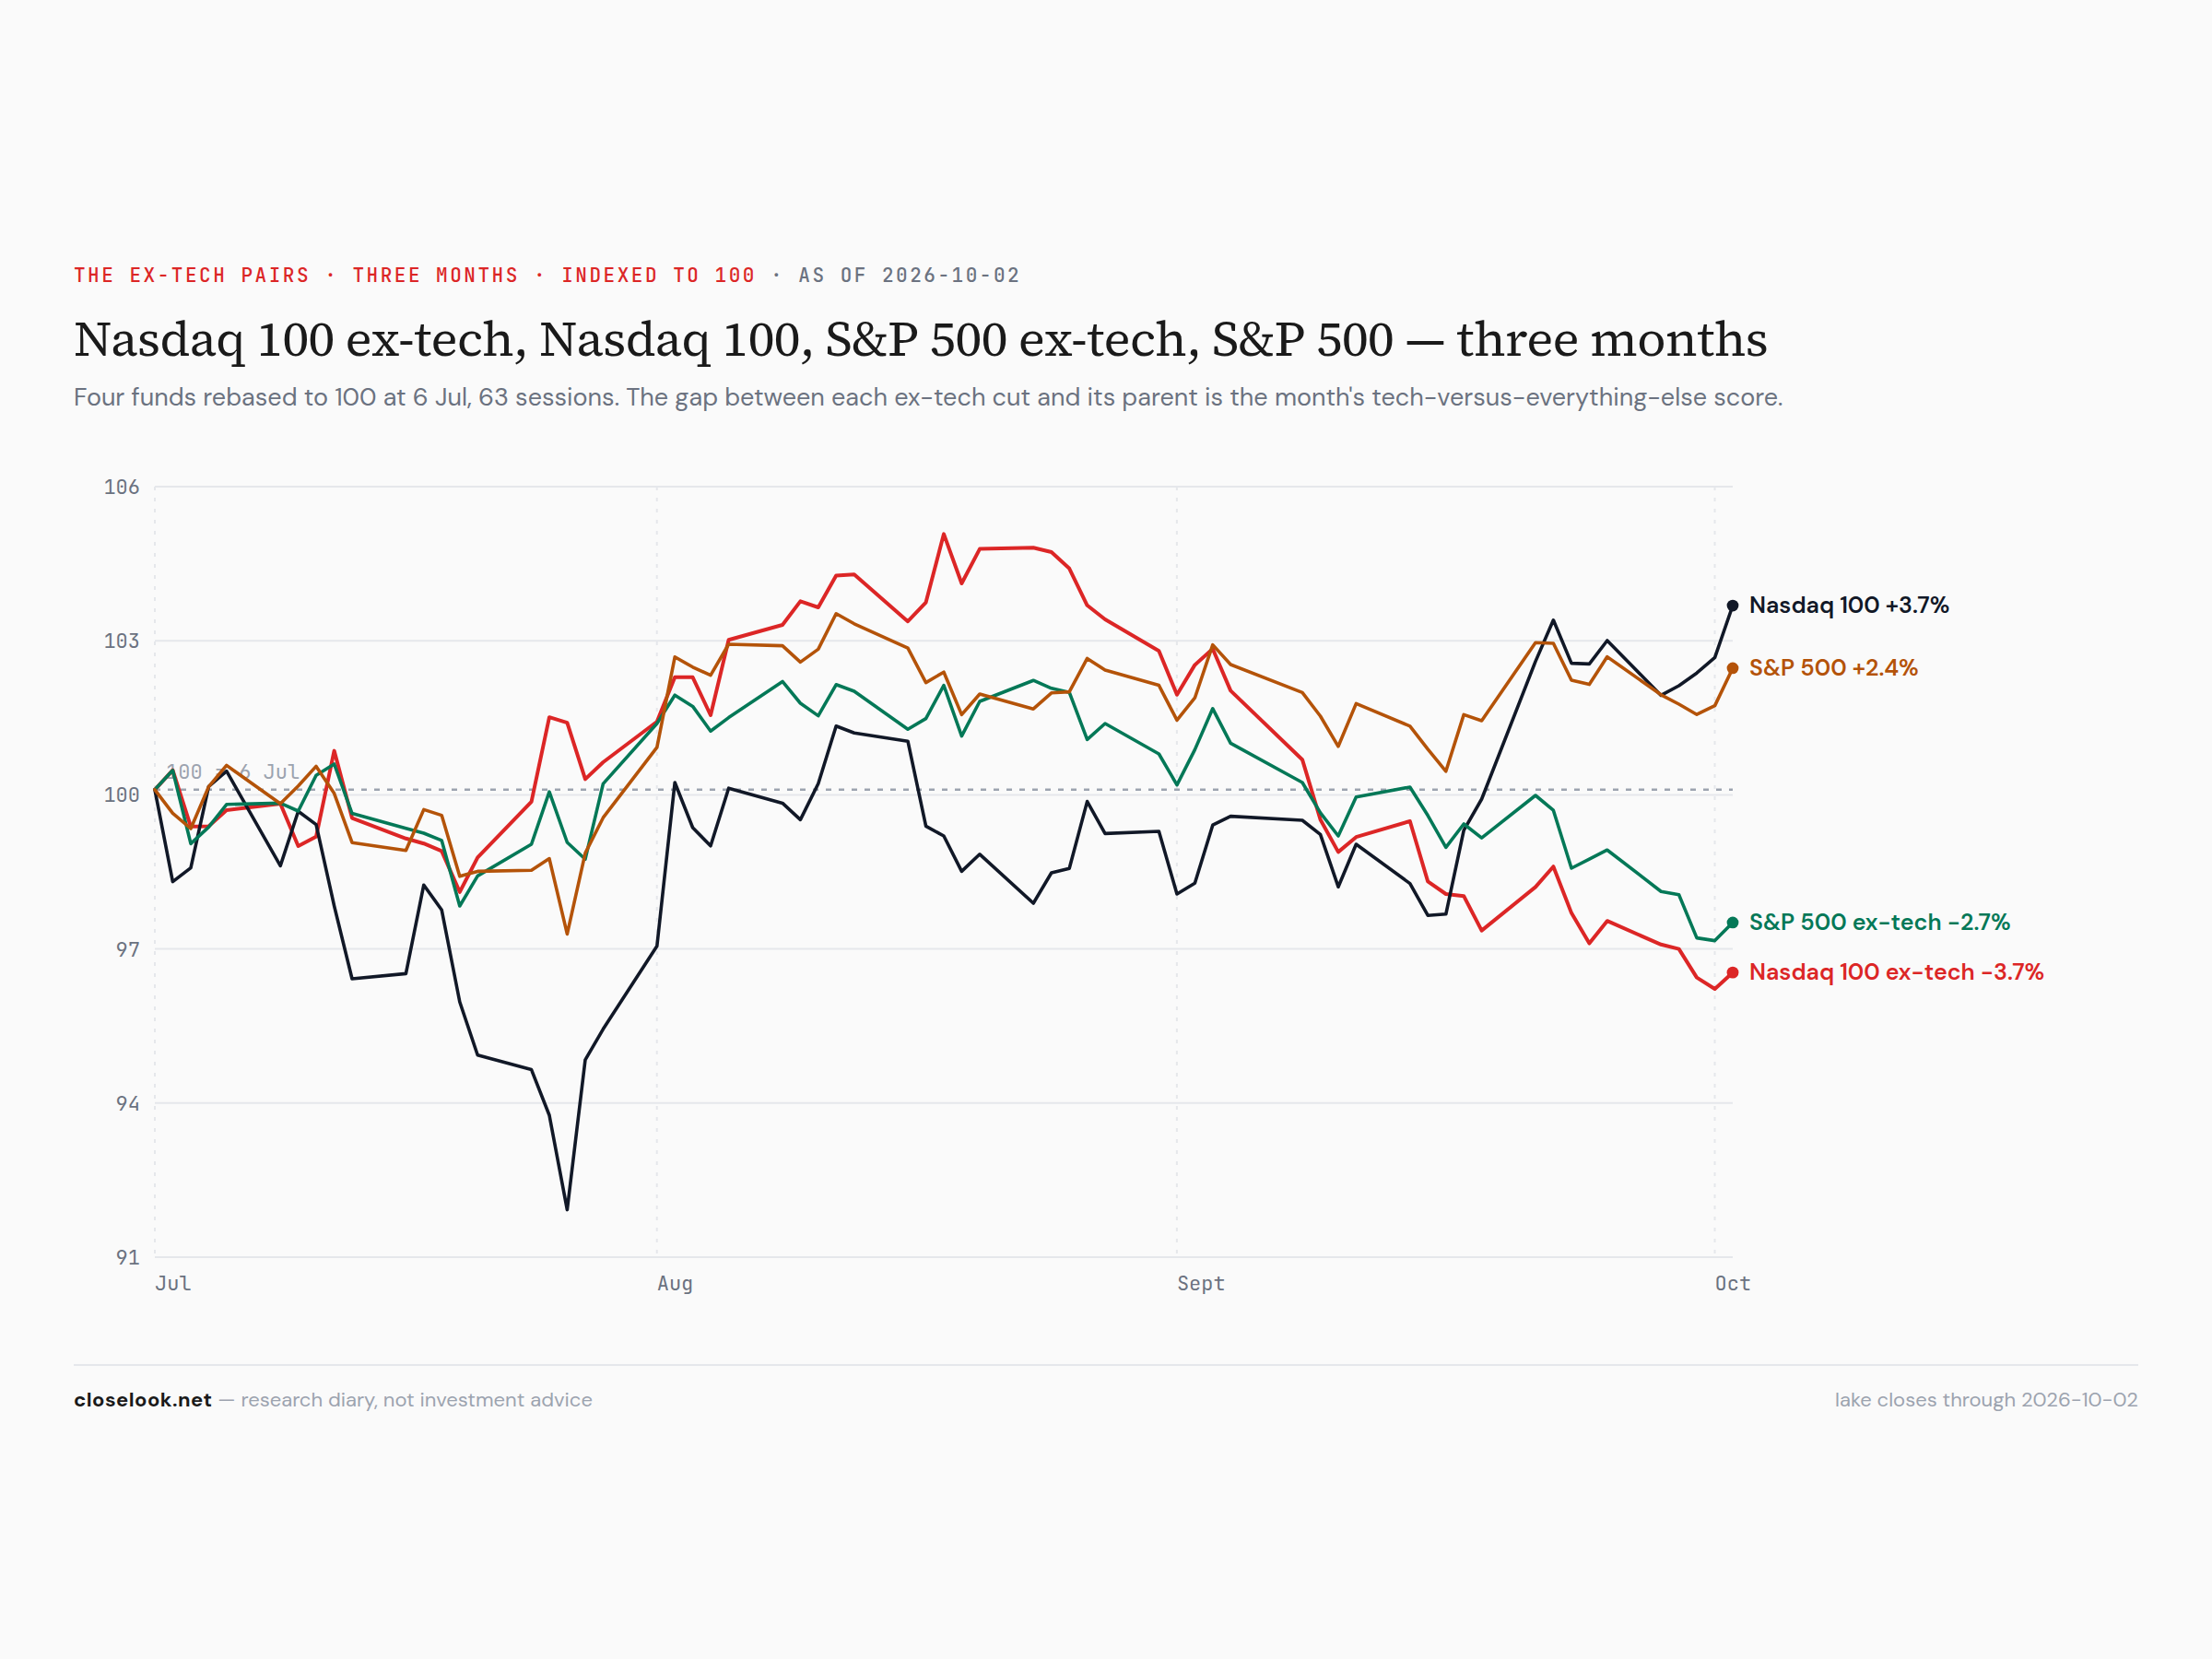
The ex-tech pairs. Over three months the four lines say the same thing at two altitudes: the Nasdaq 100 and its ex-tech half have moved apart, and so have the S&P and its ex-tech version. QQXT −3.5% on the year, SPXT +3.4%, the S&P +12.9%, the Nasdaq 100 +22.0%. What is not technology in America has gained between minus three and plus three percent in nine months.
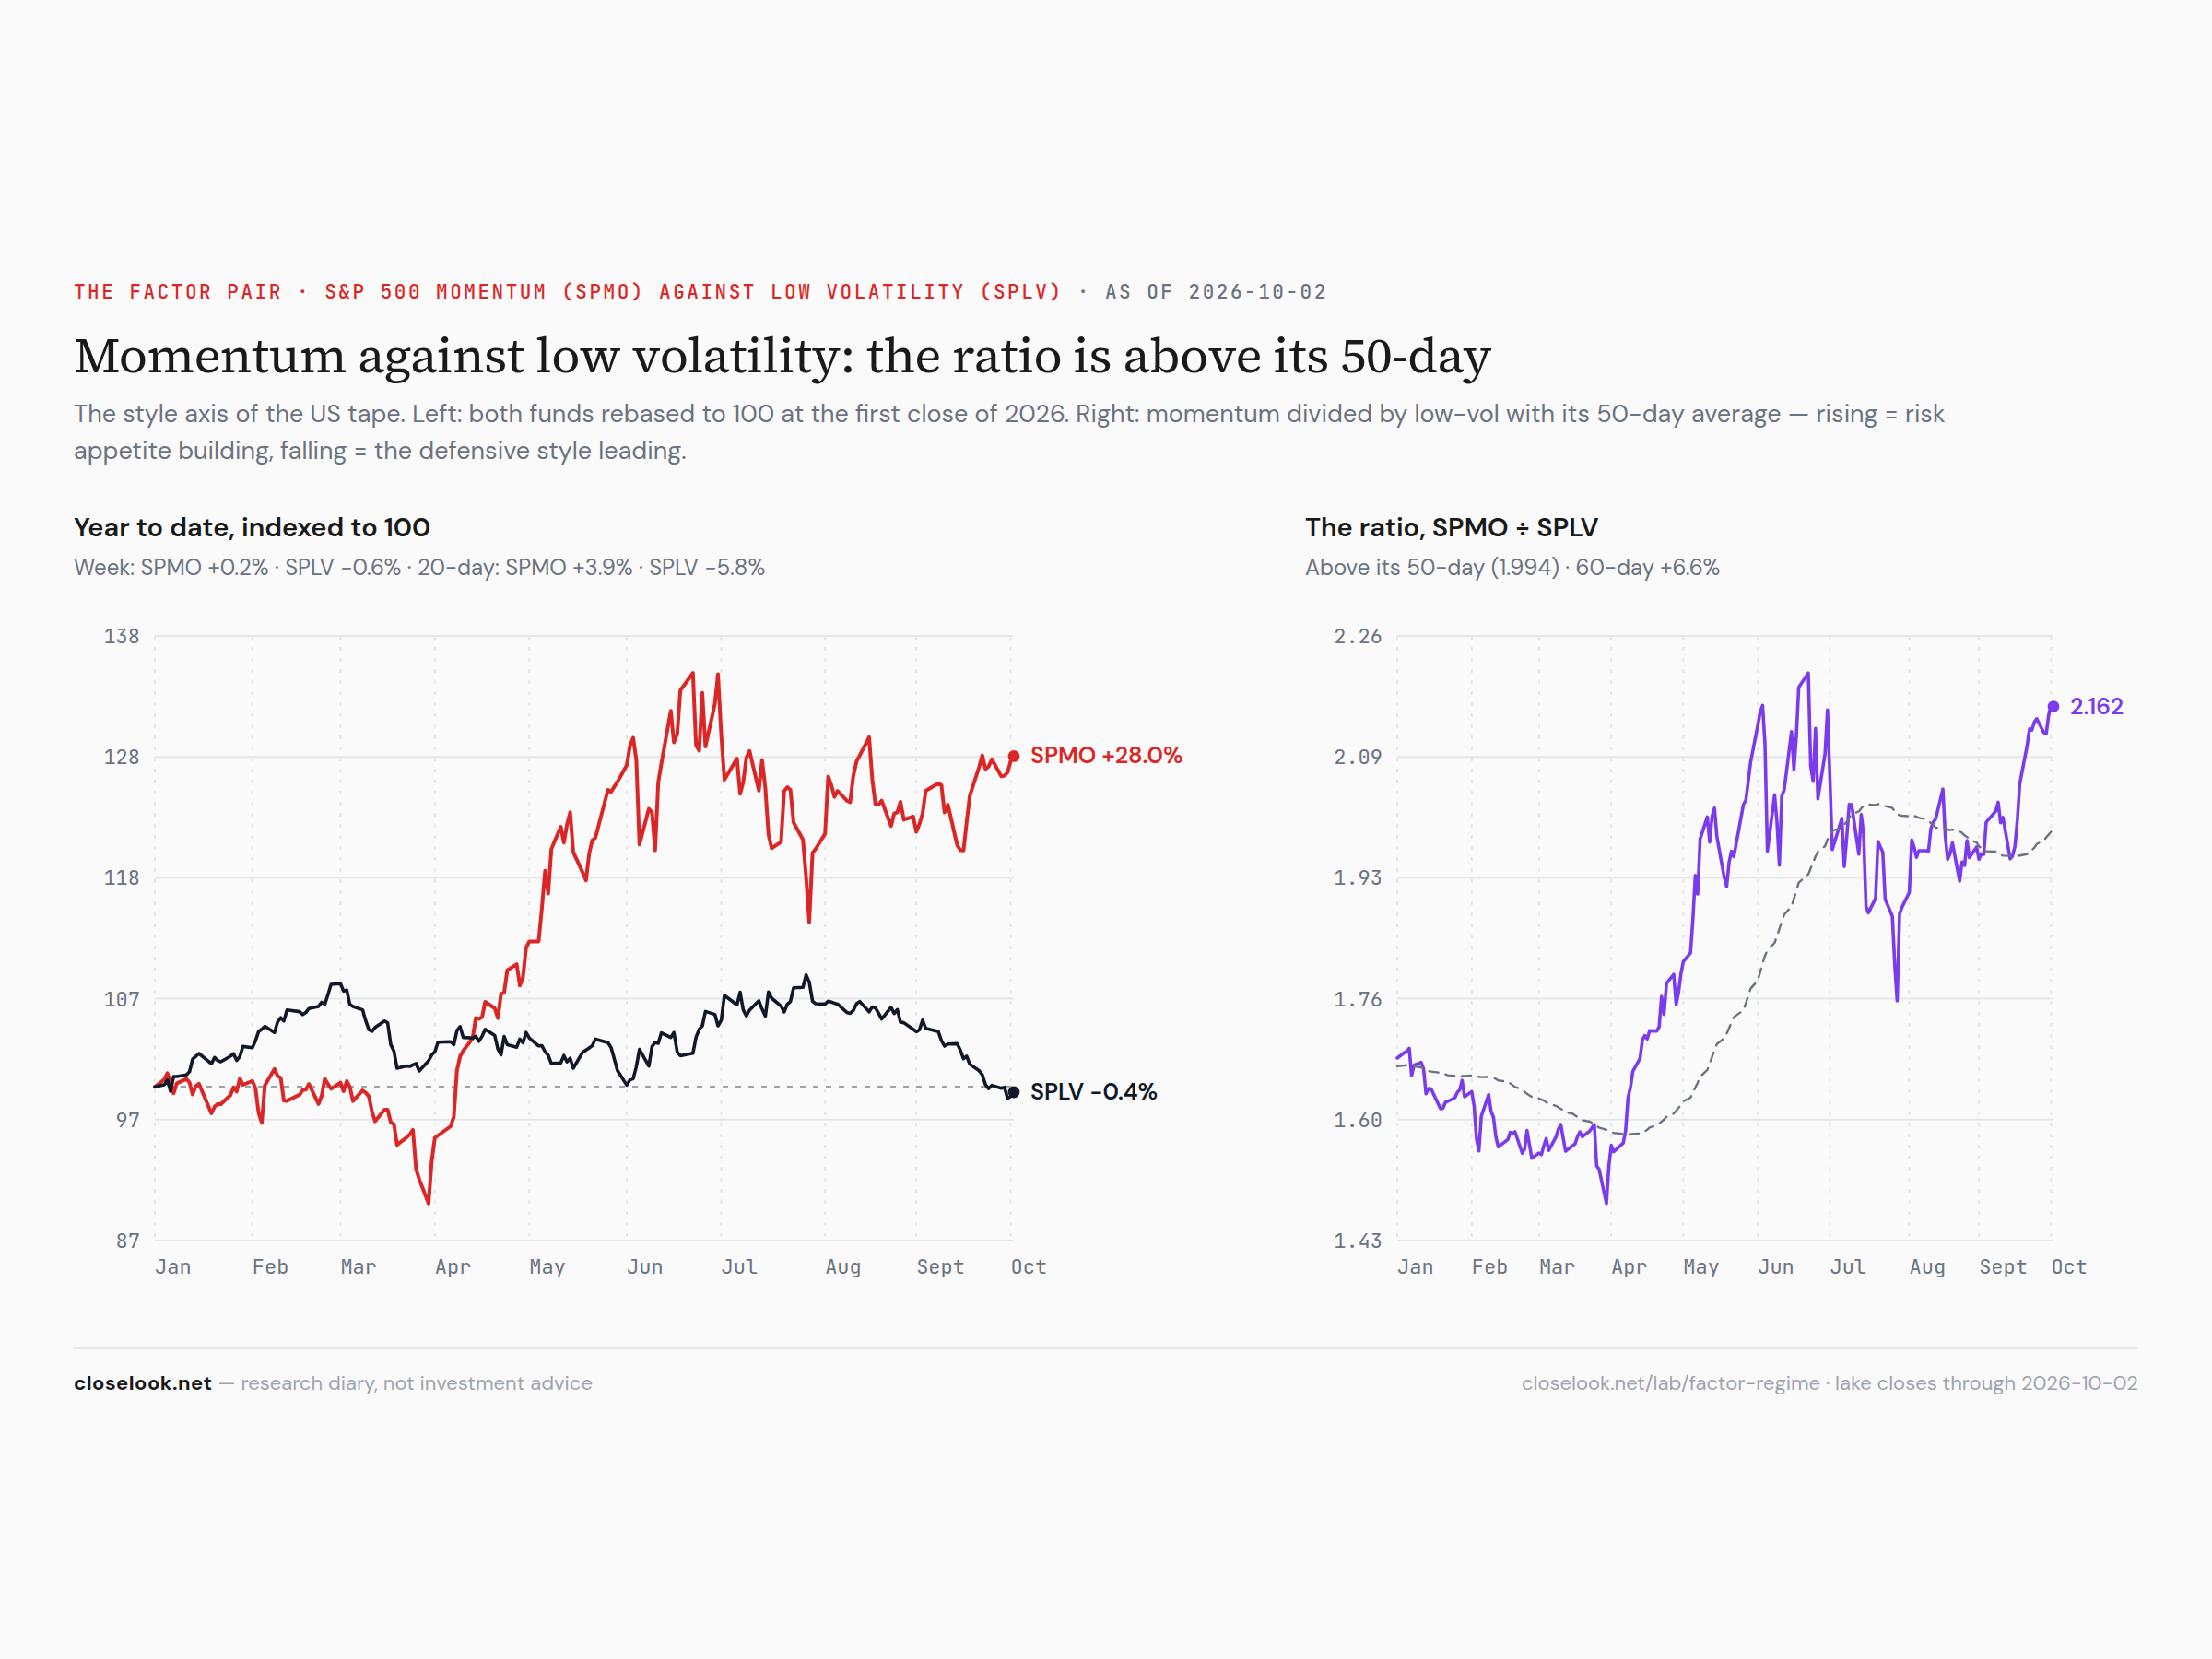
The factor pair — momentum at the top of its range. The momentum fund rose 0.20% to 153.23; the low-volatility fund fell 0.58% to 70.89. The ratio stands 8.4% above its 50-day average, in the 99th percentile of its range — the house factor gauge reads "momentum leading, risk appetite building". On the year momentum +28.4%, low volatility −0.7%. The low-volatility fund is full of the utilities, staples and banks; the momentum fund is full of what made the records.
The tech ETFs we carry
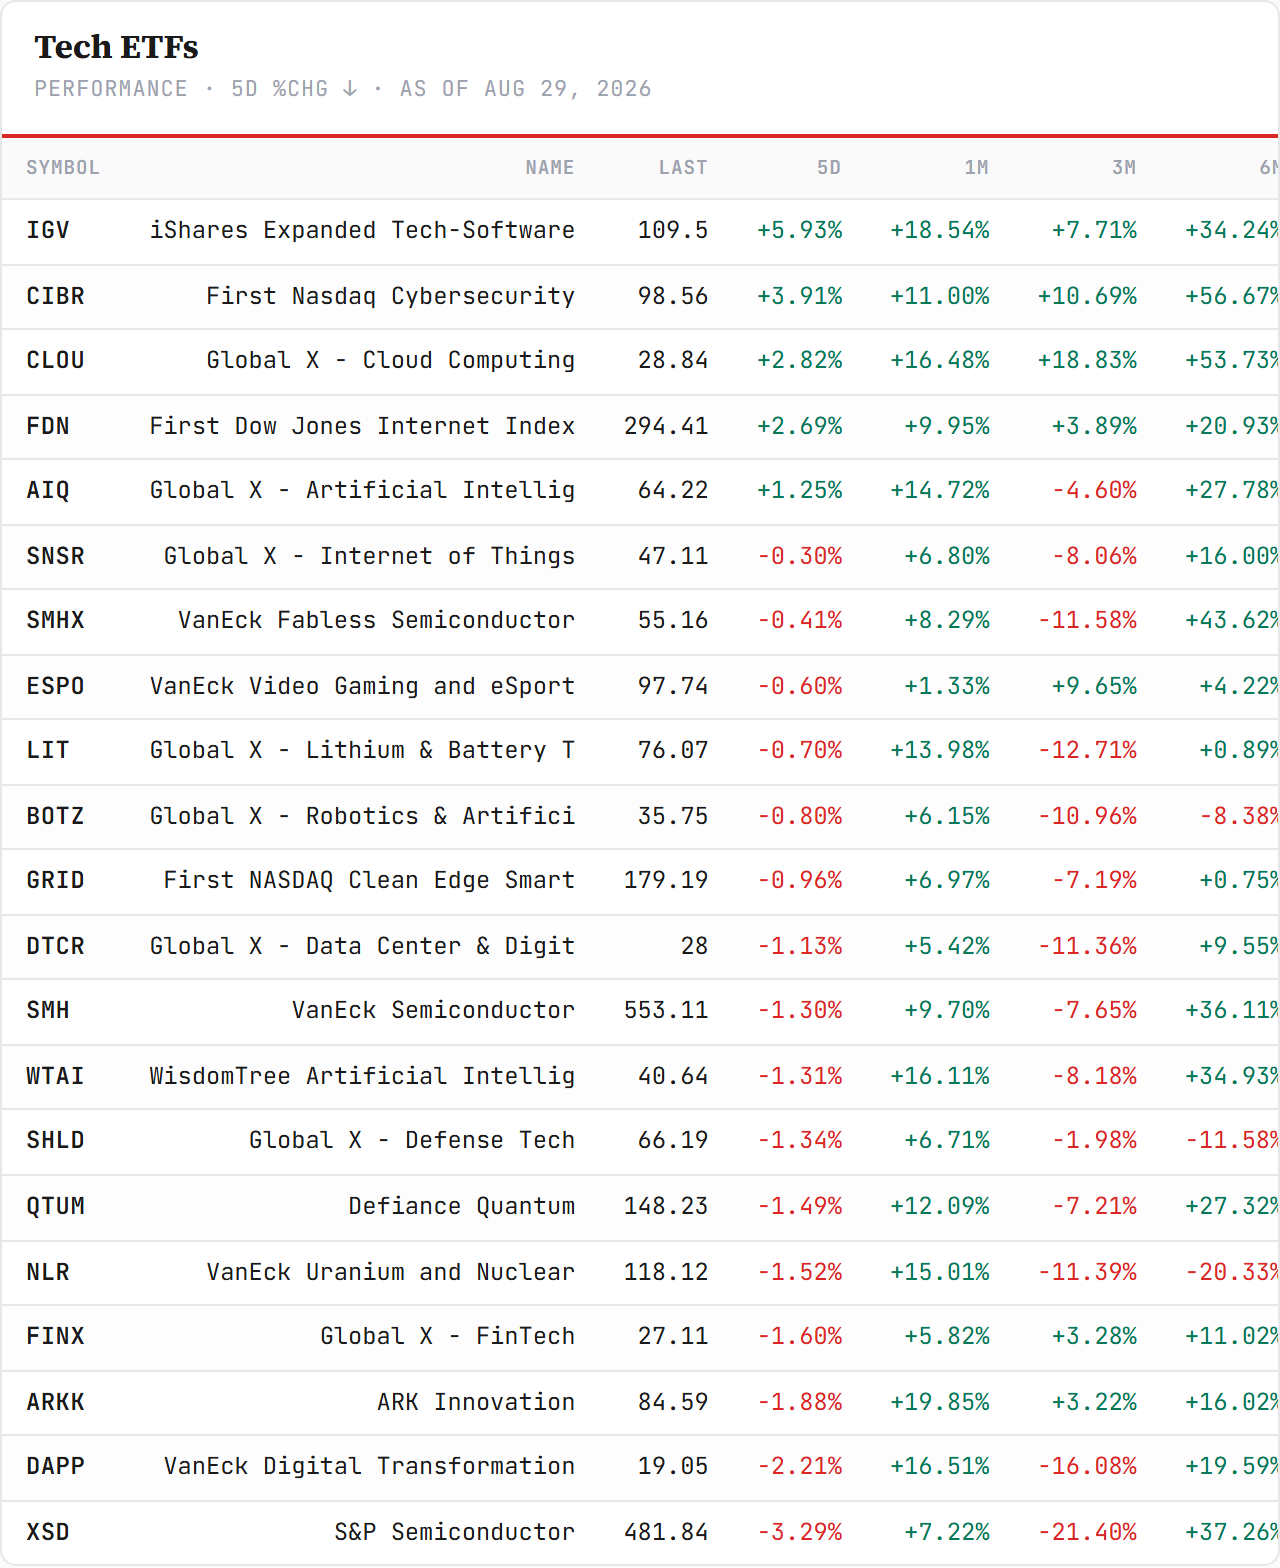
Fifteen of twenty-one green. The chip majors +3.96%, cybersecurity +3.71%, the WisdomTree AI fund +3.19%, the fabless fund +2.82%, the equal-weight semis +2.68%, software +2.28%, cloud +1.48%. The red six: digital transformation −6.37%, fintech −4.02%, uranium −2.87%, data centers −2.05%, defense tech −2.00%, ARK −1.04%. The chip index rose 2.83% to 588.90, the second up week in a row, and is 10.1% under its June 22 high; software closed 108.43, above the 105.69 year-end line for a second week and 1.7% under its August high.
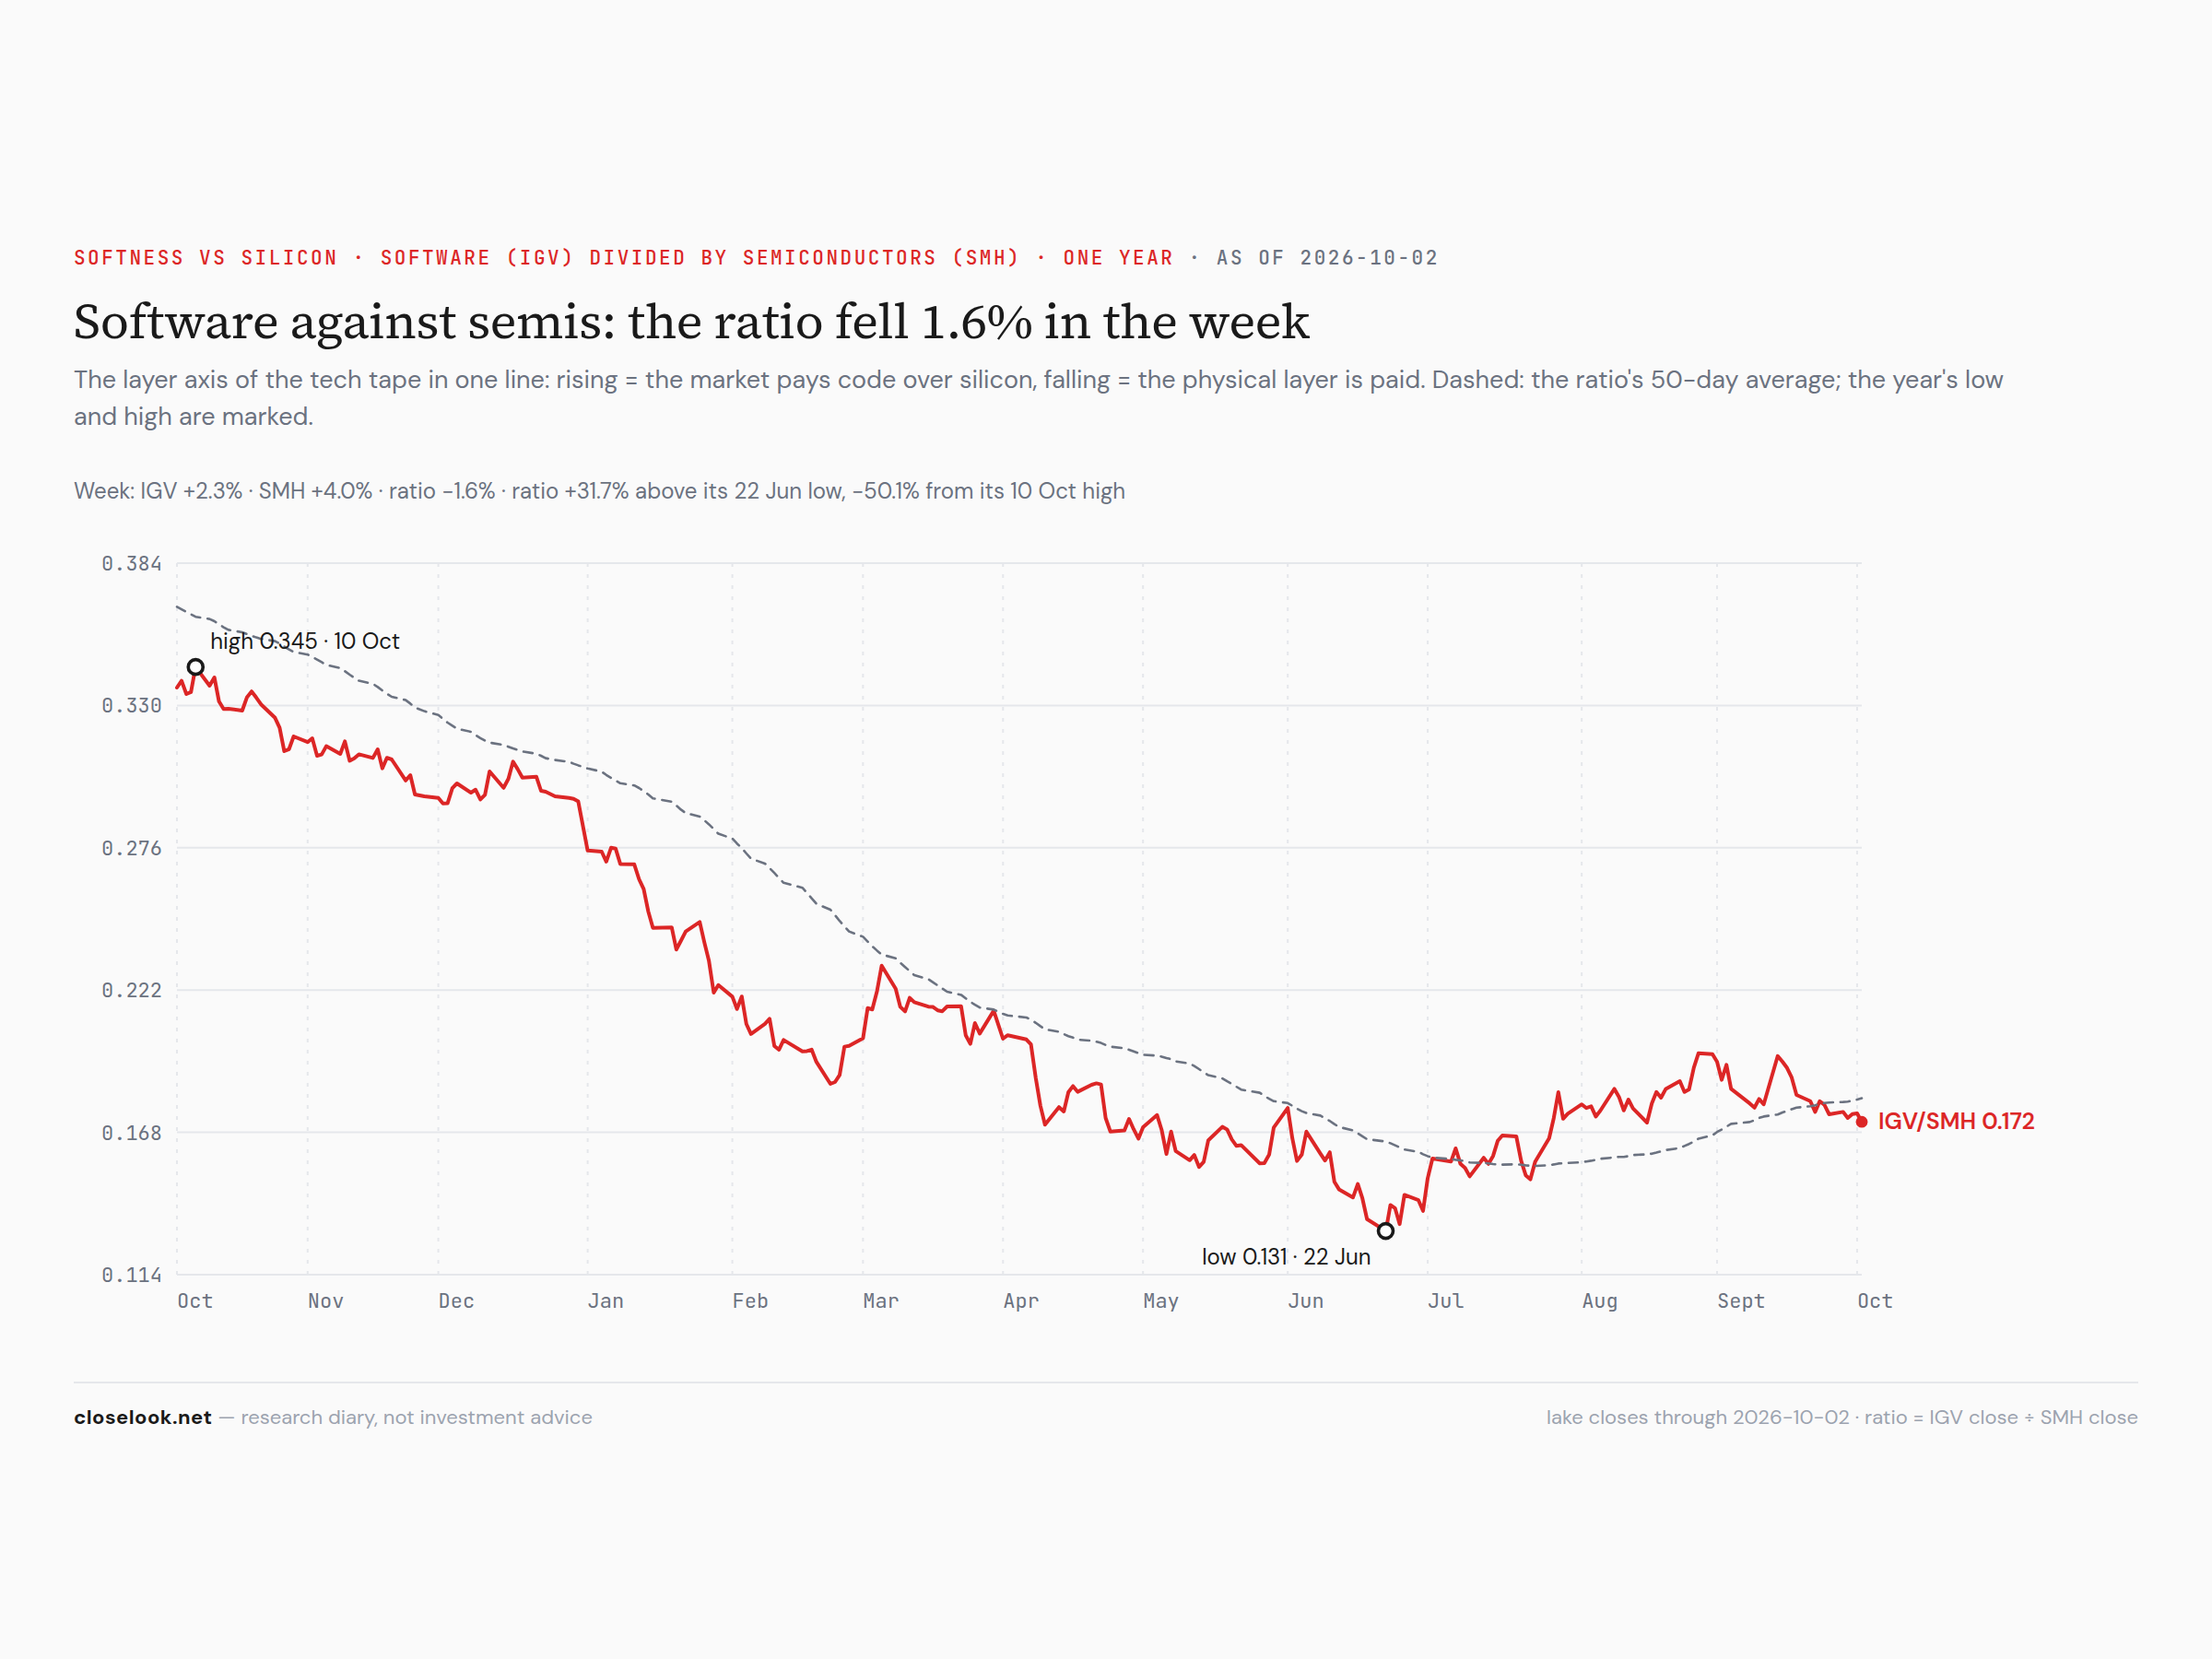
Software against silicon. The software-over-chips ratio fell 1.6% to 0.1719 on the week; it is 31.7% above its June low. Both halves rose this week, the chips more. The ratio has stopped going up; it has not started going down.
The four indices: Dow, S&P 500, Nasdaq 100, Russell 2000
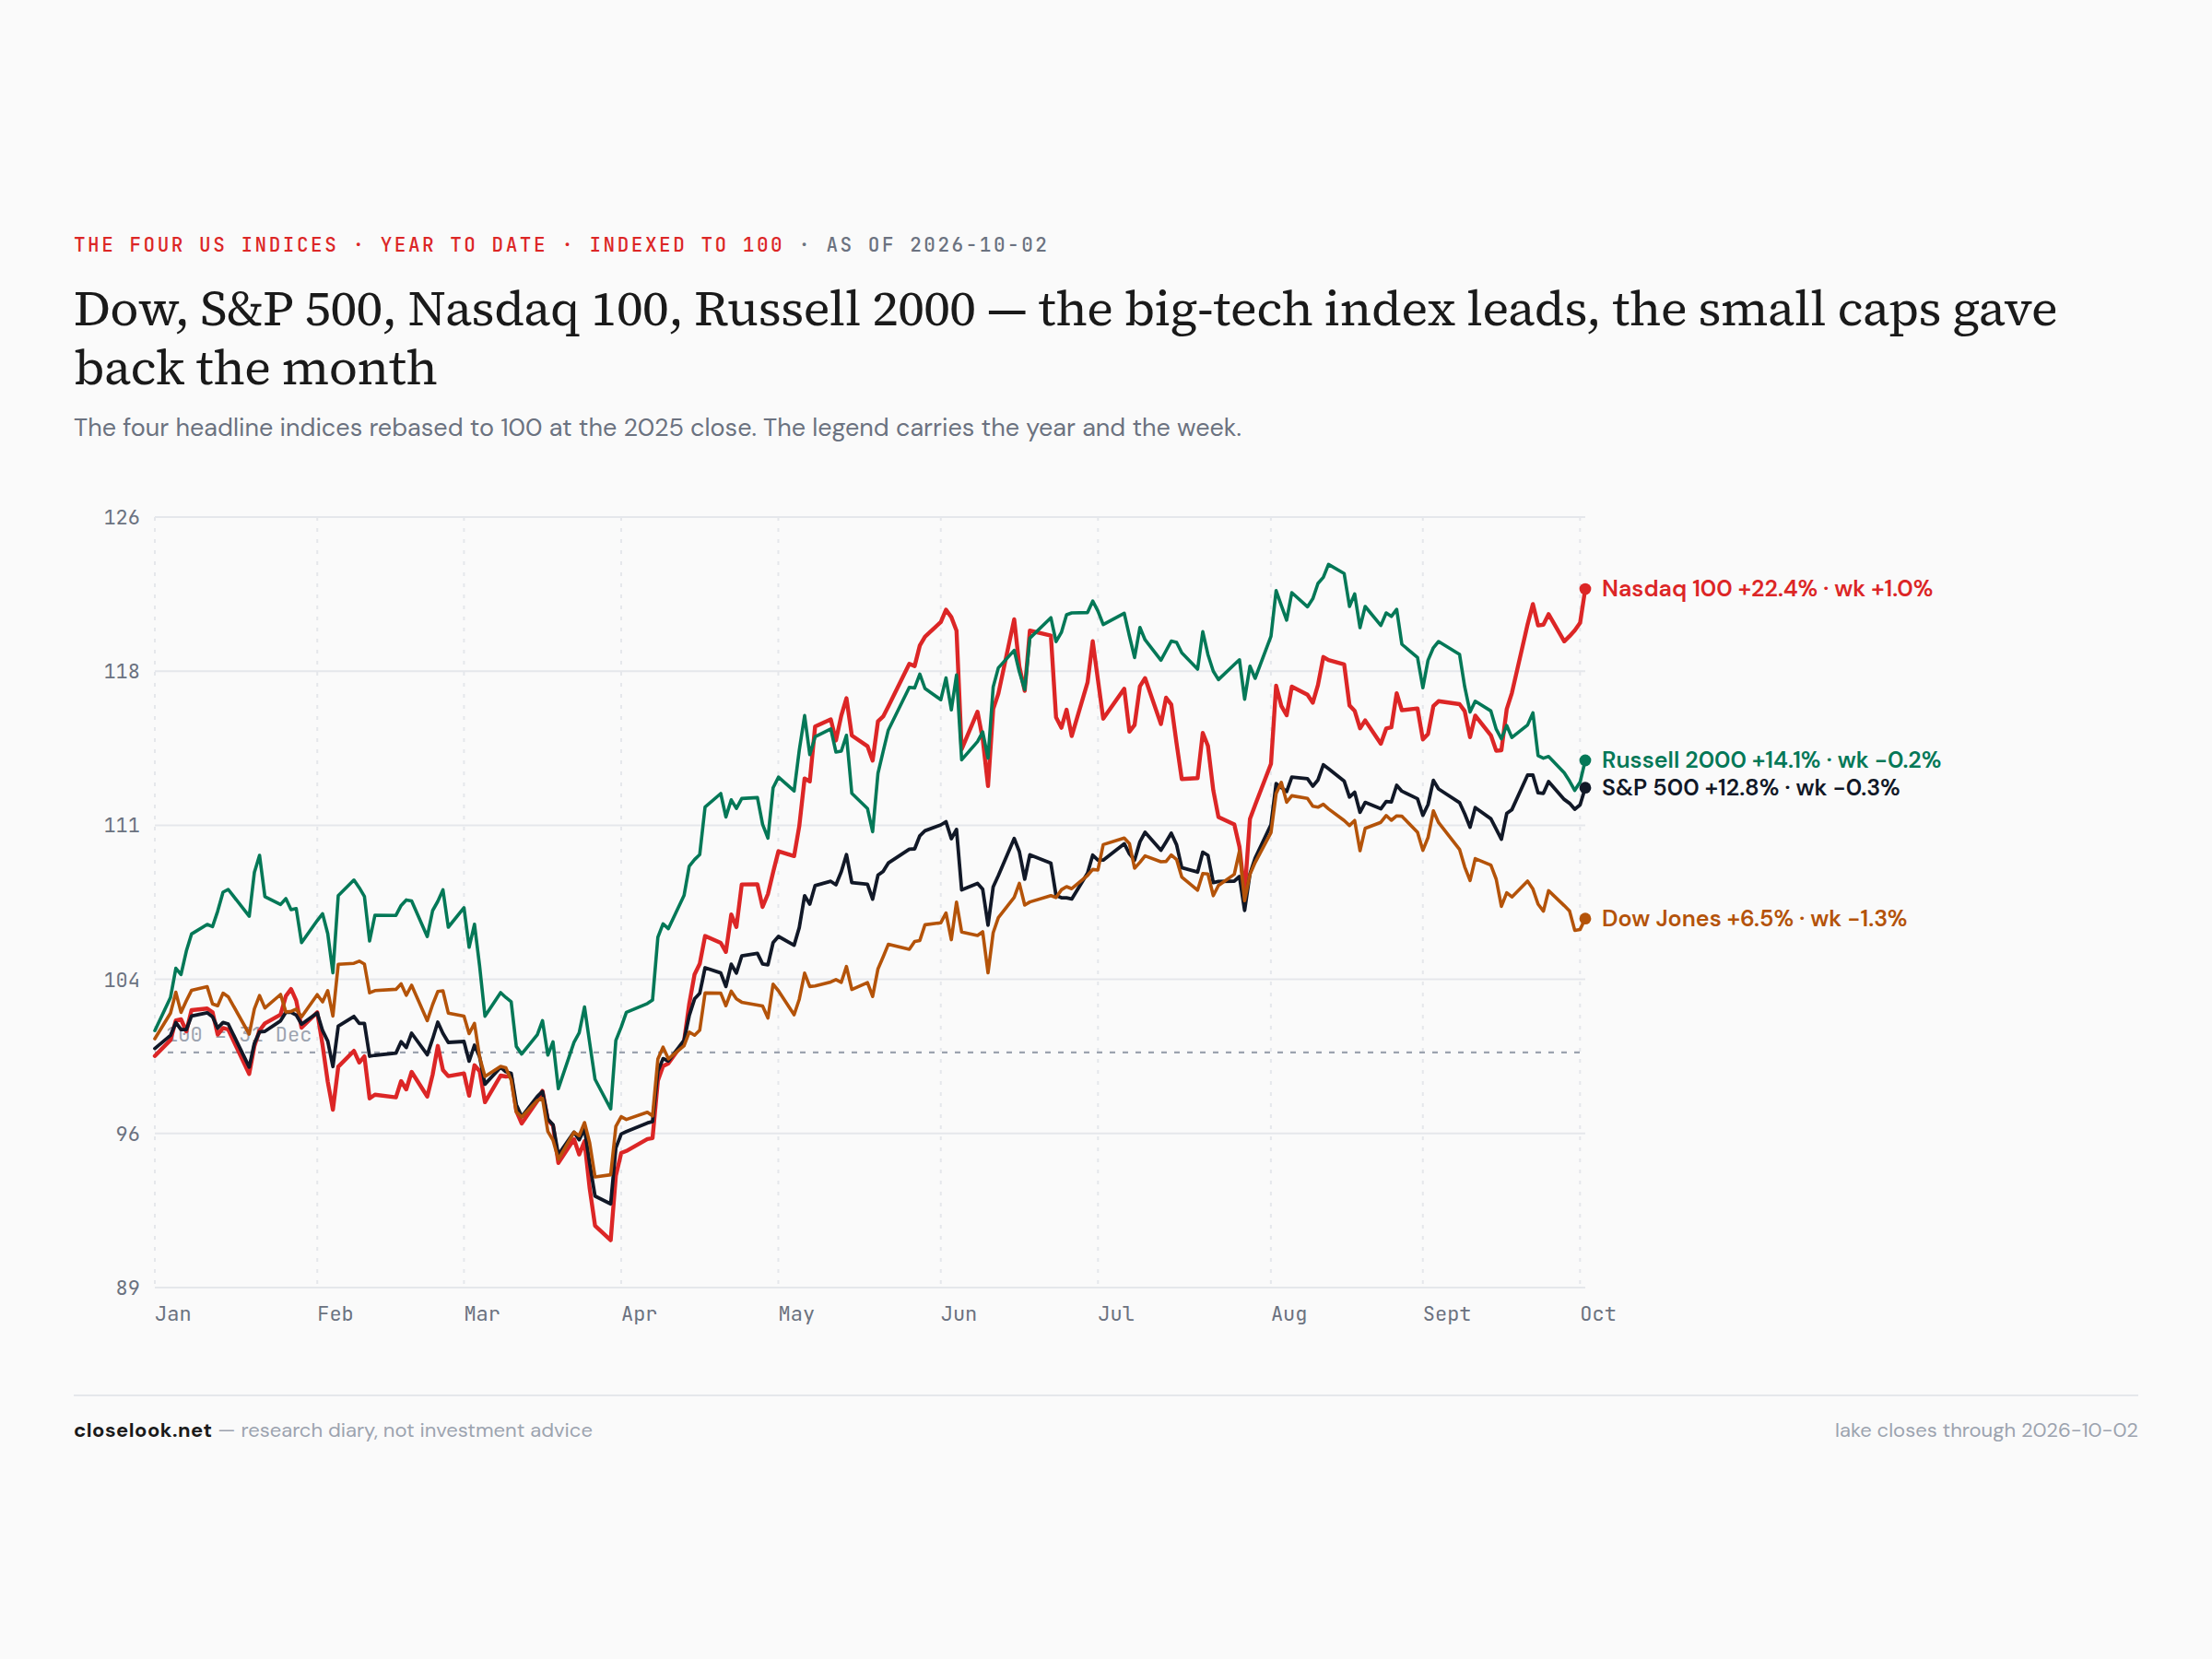
The Nasdaq 100 +1.0% to a record; the S&P −0.3%, the Russell −0.2%, the Dow −1.3%. On the year: Nasdaq 100 +22.4%, Russell 2000 +14.1%, S&P 500 +12.8%, Dow +6.5%. The Dow, with its banks, its health care and its industrials, had the worst week of the four; the Russell held its ground after a month in which it gave back most of its August lead.
The Treasury curve, one month to thirty years
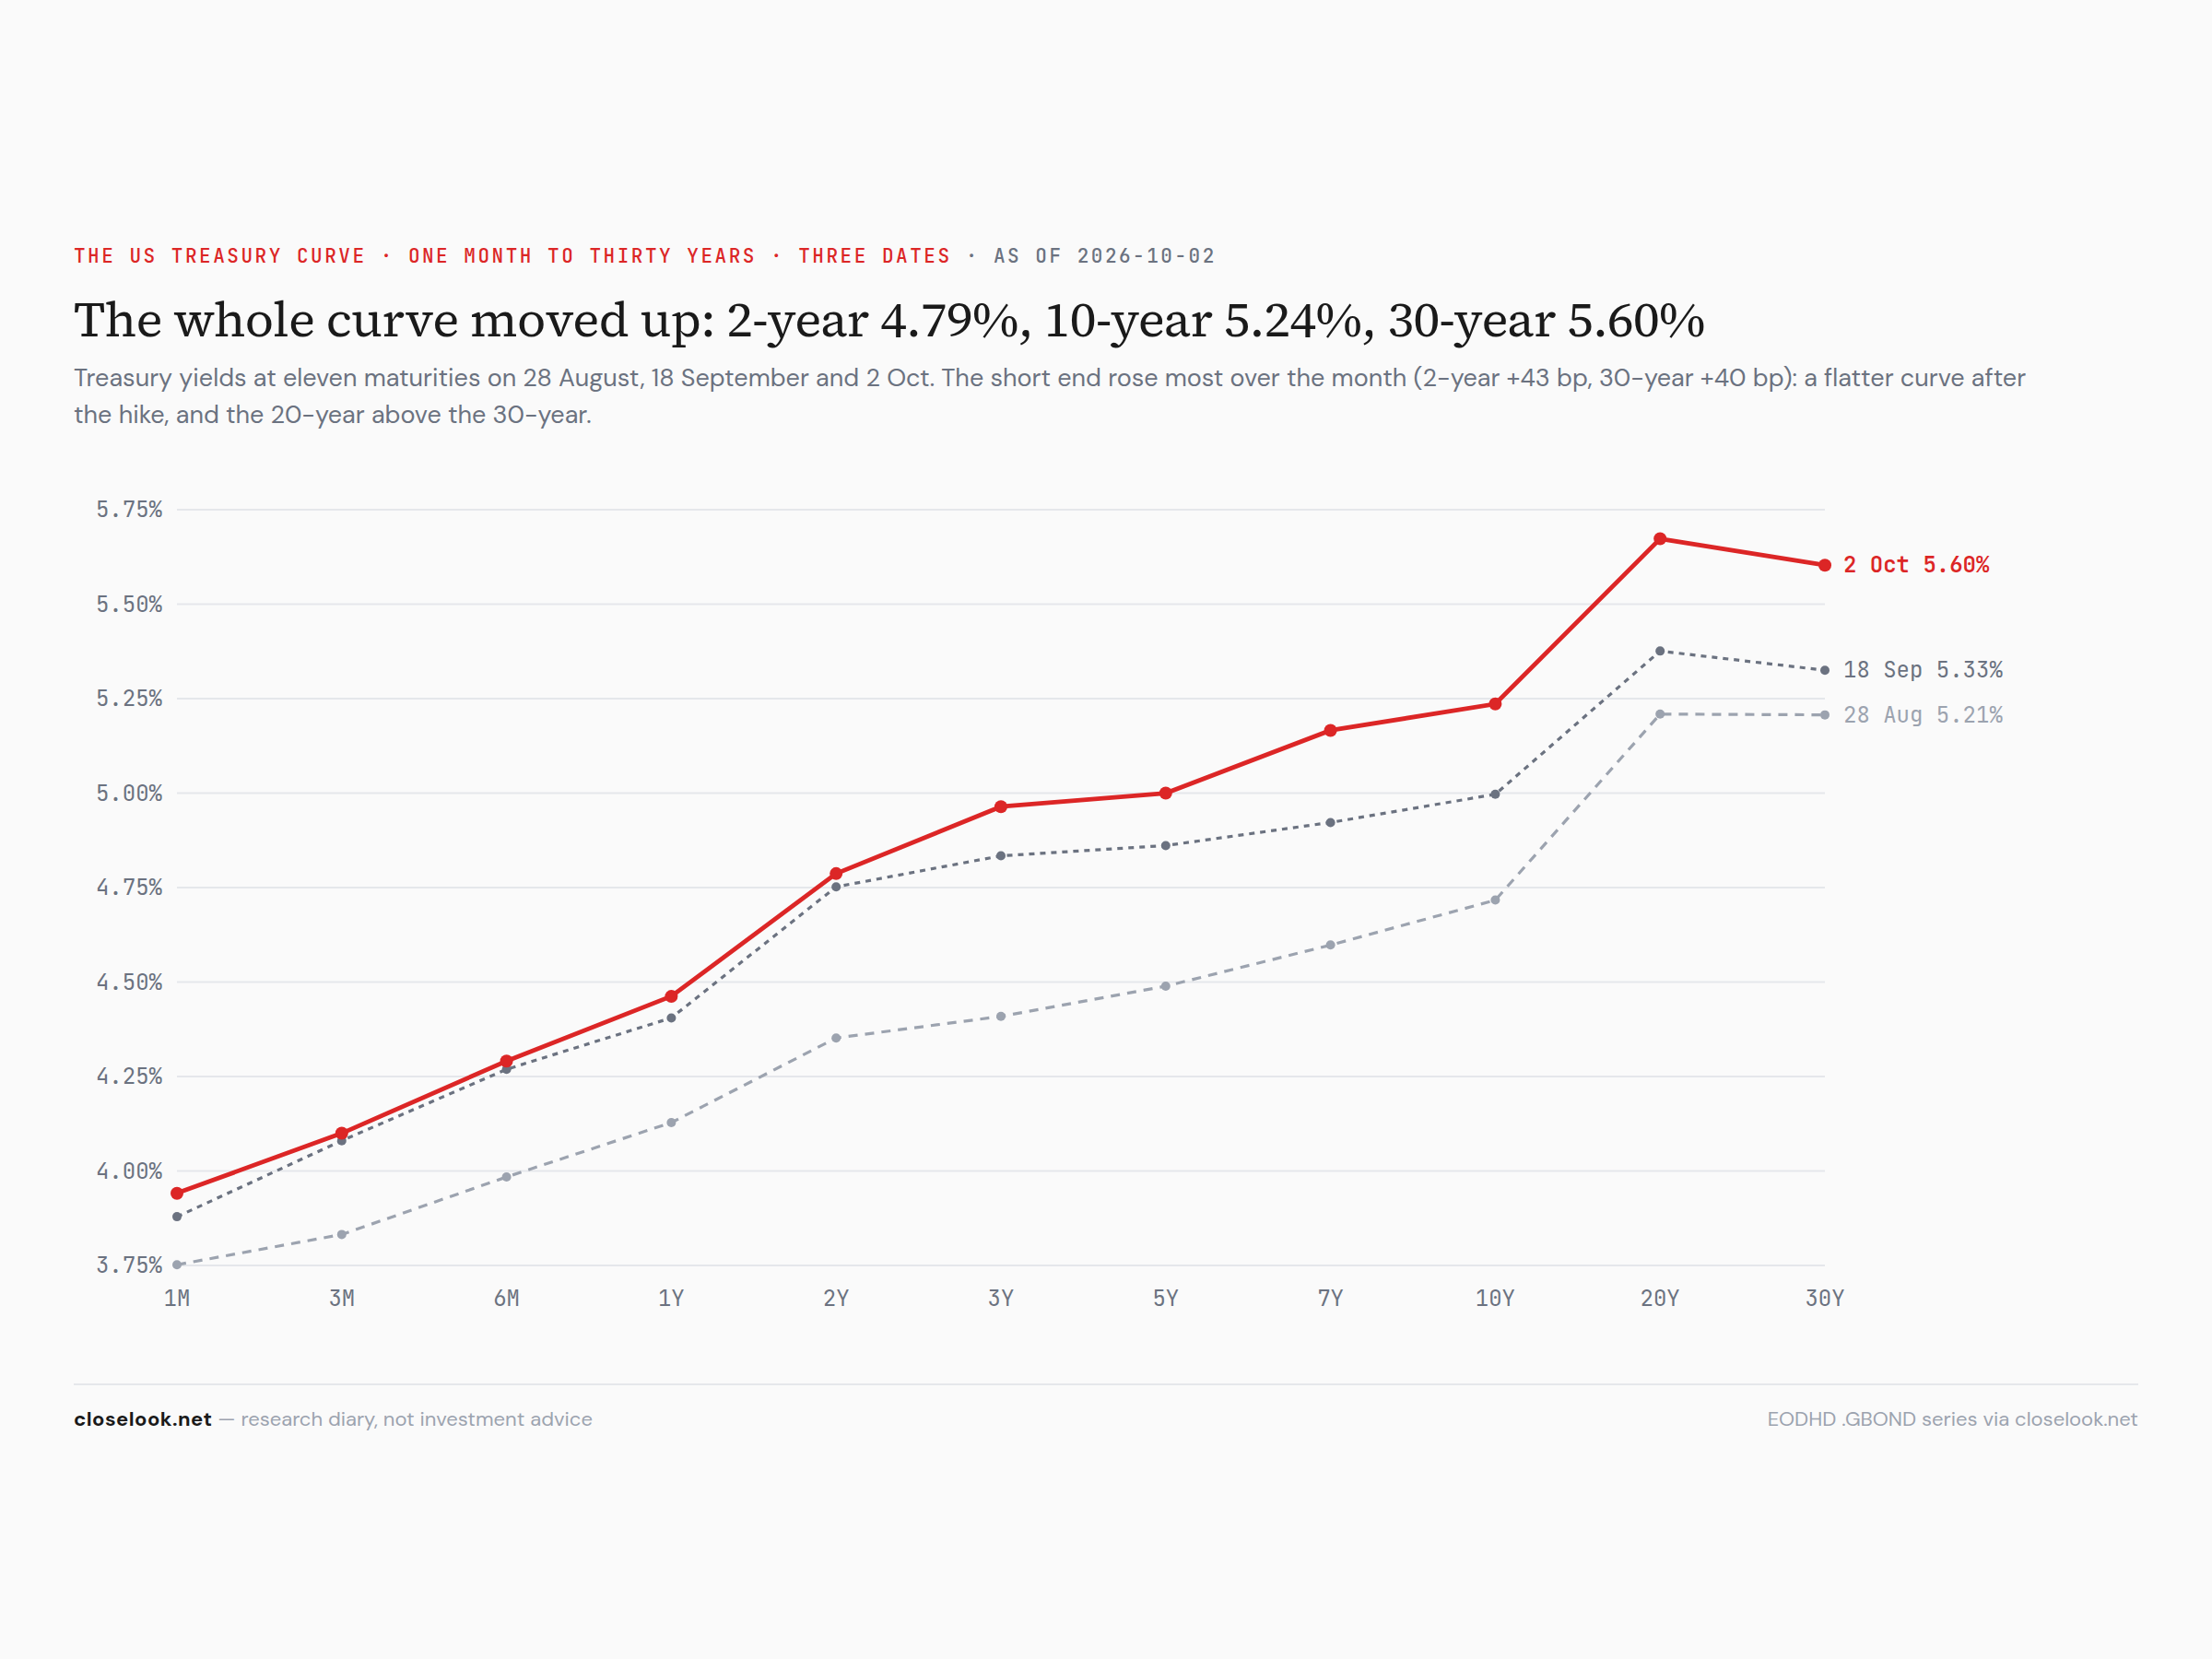
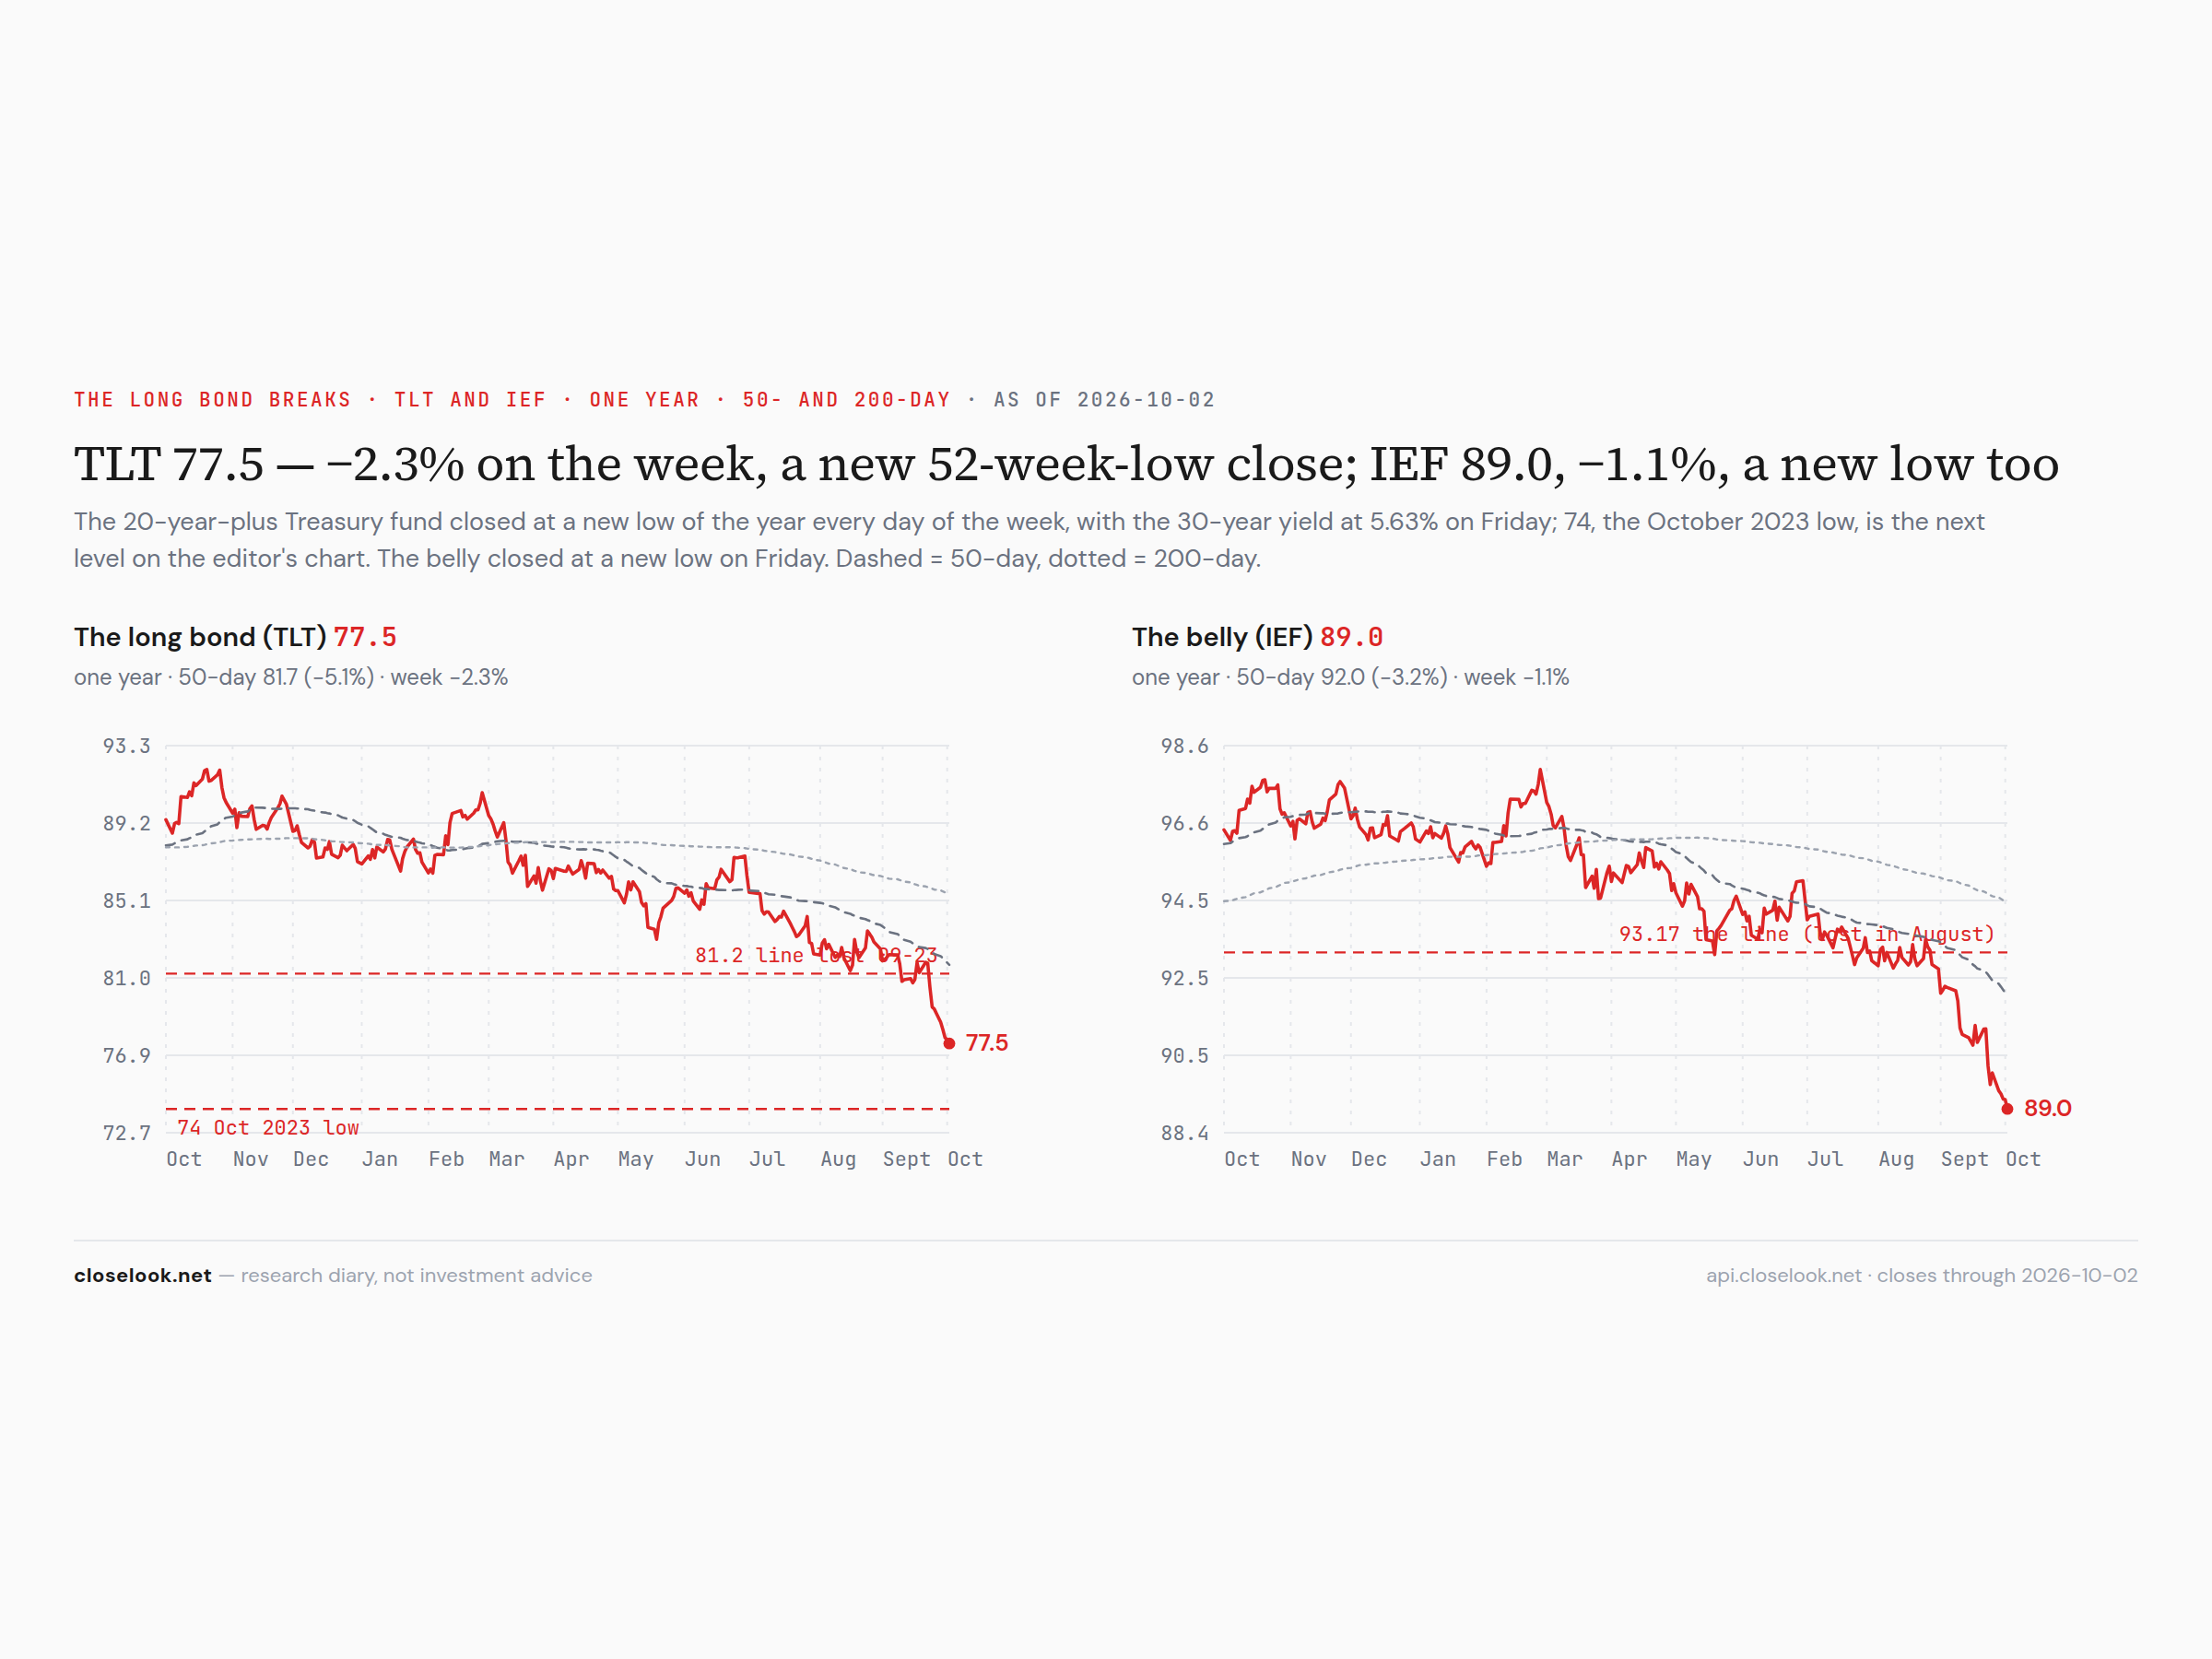
The whole curve moved up again: the 2-year 4.79%, the 10-year 5.24%, the 30-year 5.60% on the curve series. Over five weeks the 2-year rose 43 basis points and the 30-year 40; the 20-year sits above the 30-year. The week's bond fact is the one Saturday's Global letter set at the centre: core inflation came in at 0.2% for August (3.0% on the year, 3.3% expected) and September payrolls at 29,000 with 60,000 of revisions — and the long end still rose. The long-bond fund closed at a new low on every day of the week, 77.48 on Friday, 4.5% above 74, the October 2023 low; the belly closed at 89.05, a new low. A rate that does not fall on soft data is trading on supply and credit, not on the Fed.
The dollar
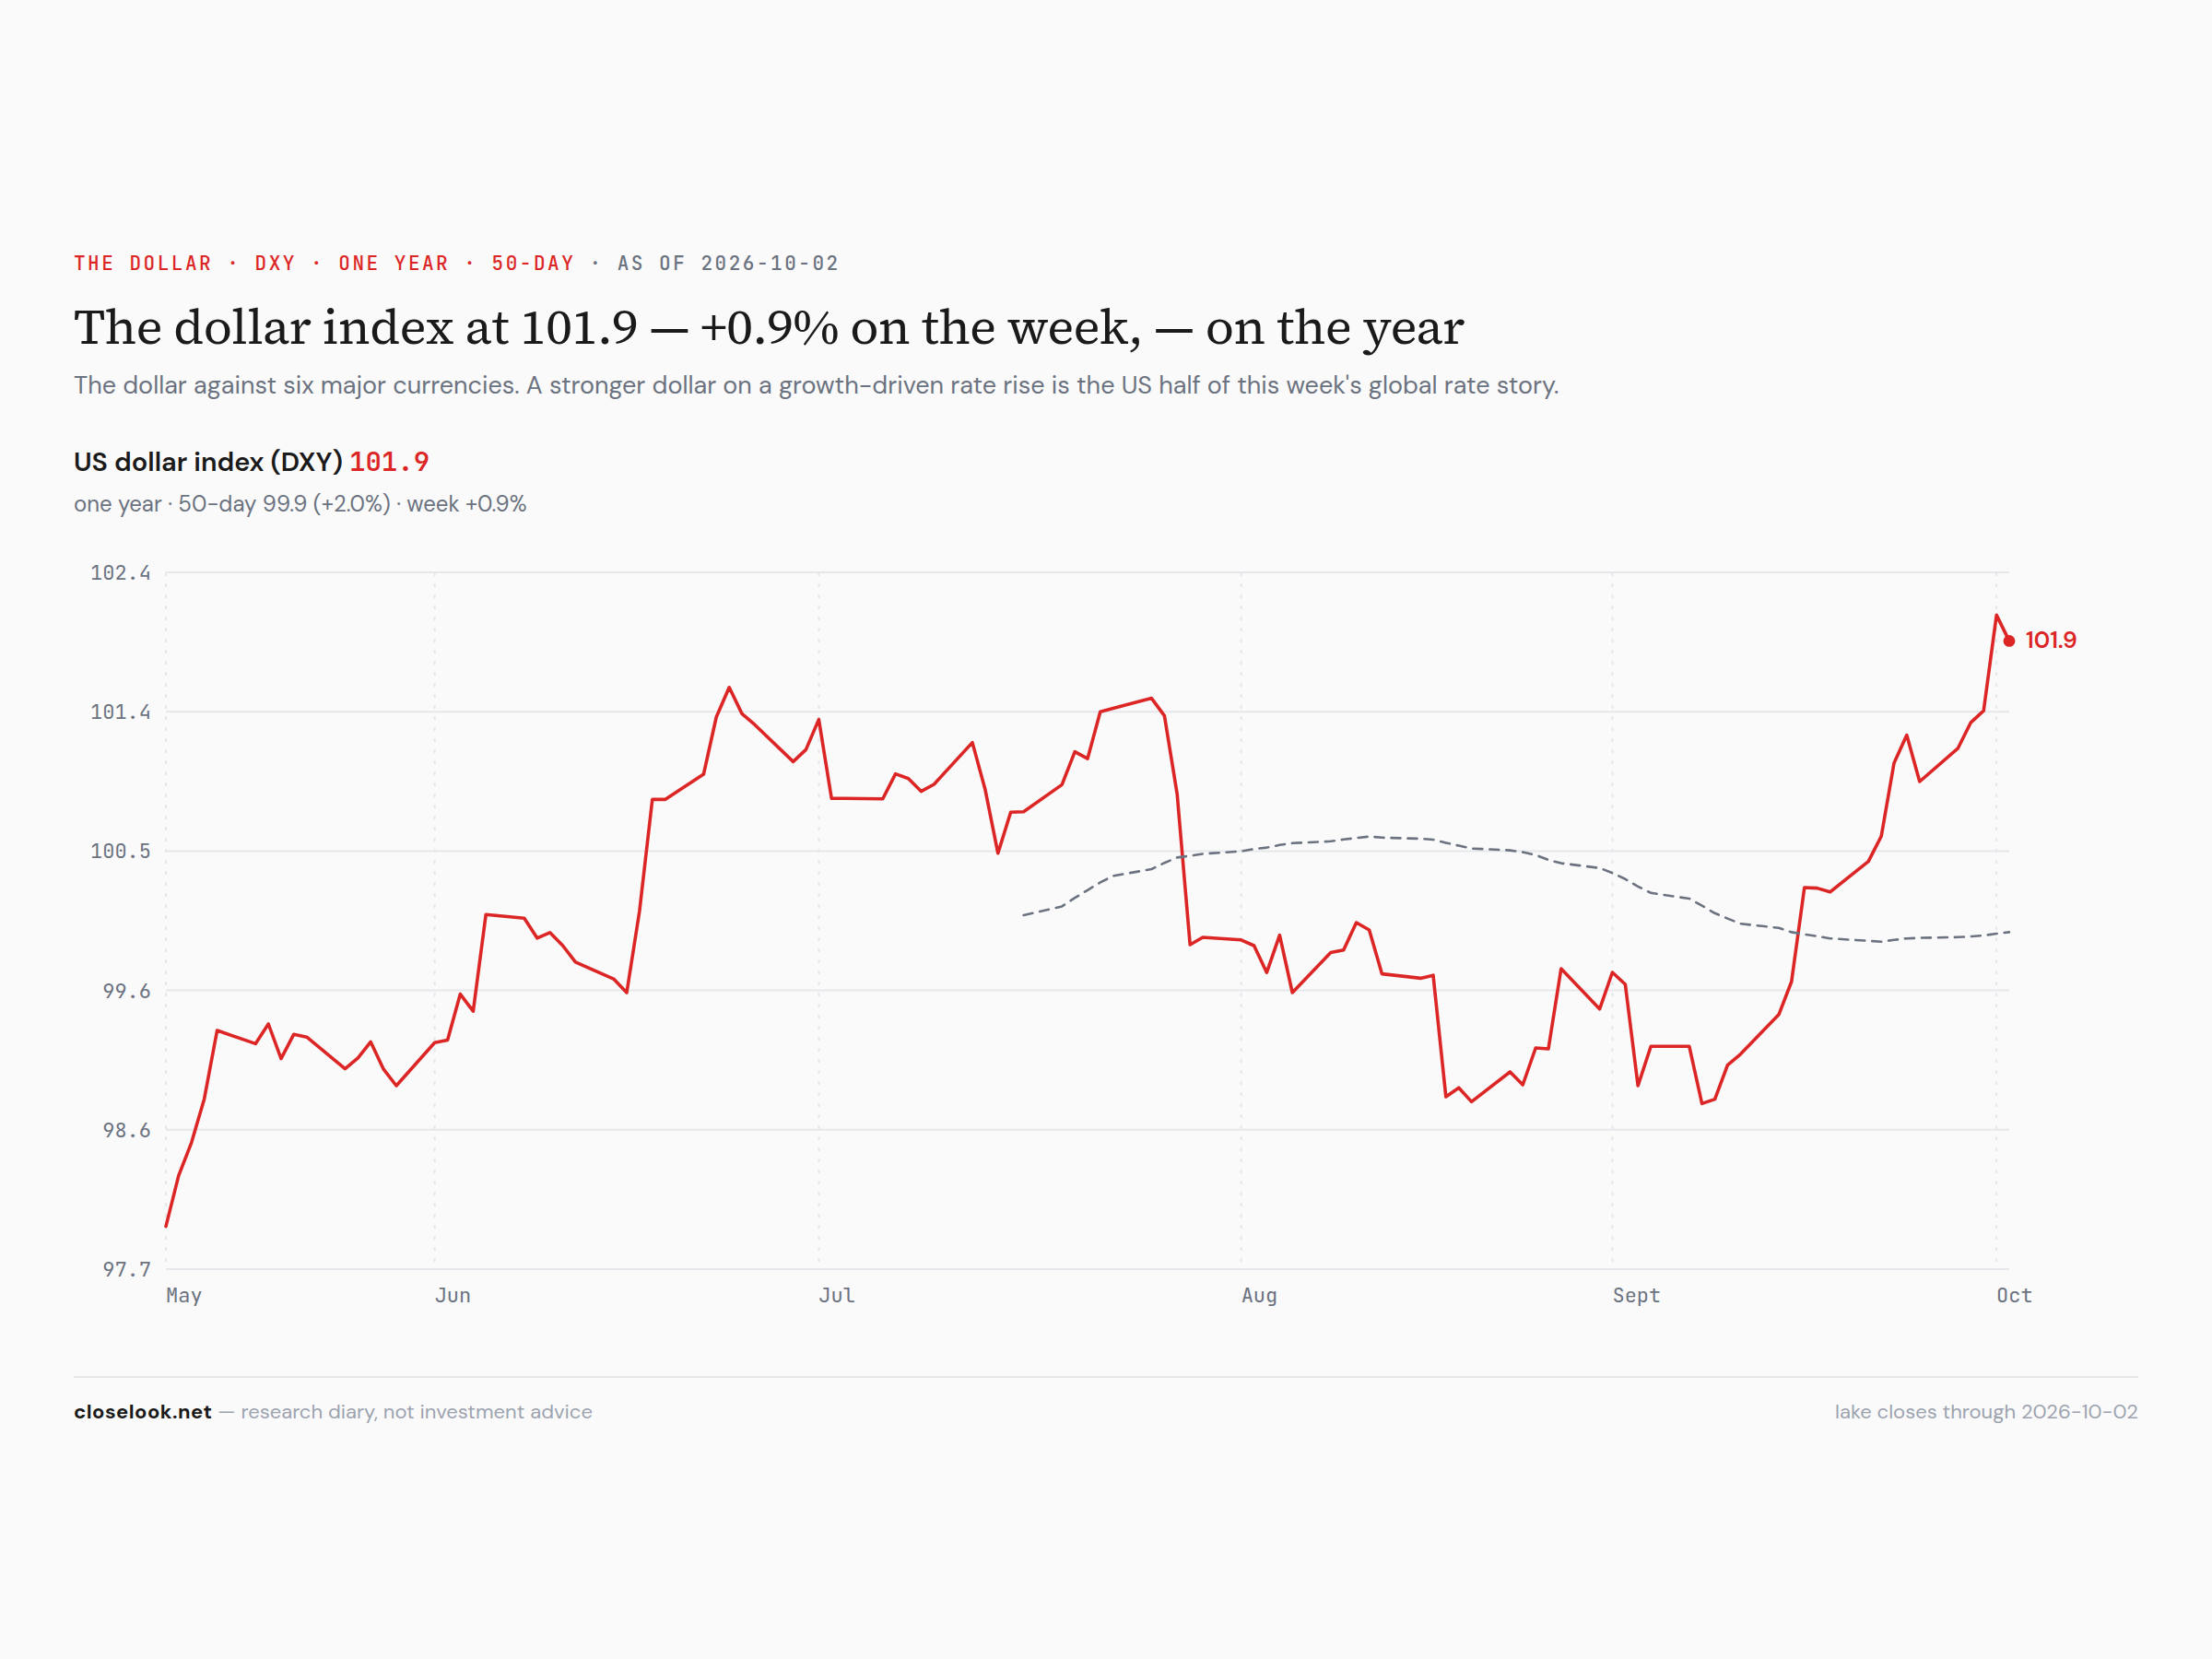
The dollar fund made its high of the year on Thursday. The fund closed 28.89, +0.94%, after 28.96 on Thursday — its highest close of 2026; the dollar index closed at 101.92. The euro fell to its lowest close of the year. A weak jobs report did not weaken the dollar: the market is ranking economies, and America's ranks first on growth. Saturday's Global letter has the geography.