Heresy · 08:30 NY
Don't Buy Global Stocks — Closelook Heresy II
Why the next $30 trillion of equity wealth will be created by fewer than 1,500 companies — and what that means for everyone holding the other 62,000.
Why the next $30 trillion of equity wealth will be created by fewer than 1,500 companies — and what that means for everyone holding the other 62,000.
A while ago we wrote that you should not buy US stocks. We meant it then, and we mean it now. But that piece was incomplete. It implied — without quite saying so — that the answer was to step out of the US and into "the world." Buy emerging markets. Buy Europe. Buy what the consensus calls "broad."
It isn't. And there is now a paper that closes the case.
Stock markets are rising. The S&P just printed another high. ETF inflows are at multi-year peaks. Sentiment is the strongest it has been since 2021. This is exactly the moment when you should hear something inconvenient.
So here it is: don't buy global stocks either. The data is now unambiguous, and the implication for how long-term wealth actually compounds is the opposite of what the consensus is selling.
The first heresy, briefly
The first heresy was anchored in Bessembinder (2018), the now-famous study of US common stocks from 1926 to 2016. The finding was brutal: a tiny minority — around 4% of US-listed stocks — accounted for the entire net wealth created by the US stock market over ninety years. The other 96% collectively just matched the return on one-month US Treasury bills.
The standard rebuttal we kept hearing was: "fine, US markets are exceptionally winner-take-all. The rest of the world is more democratic. Diversify globally, the math improves." We never believed that argument. But until two years ago, there was no rigorous global counterpart. There is now.
The new evidence
In March 2023, Hendrik Bessembinder (Arizona State), Te-Feng Chen and K.C. John Wei (Hong Kong Polytechnic) and Goeun Choi (then at Loyola Marymount, now Tulane) published Long-Term Shareholder Returns: Evidence from 64,000 Global Stocks in the Financial Analysts Journal, Vol. 79, No. 3, pp. 33–63. SSRN ID 3710251.
The sample is the cleanest global stock dataset that exists for this kind of question:
- 64,738 individual common stocks issued by 63,785 firms.
- 43 markets — 26 developed, 16 emerging, plus a 43rd category for "homeless" US-listed ADRs that never traded on a local exchange (Baidu, BioNTech, and similar).
- January 1990 to December 2020. 31 years.
- Covering roughly 88% of global stock-market capitalization as of end-2020.
- All returns converted to US dollars, all compared against a common benchmark: the one-month US Treasury bill.
This is the global version of the 2018 paper. The verdict is, if anything, worse.
The four numbers that should end the debate
One. 55.2% of US stocks and 57.4% of non-US stocks underperformed one-month US Treasury bills over their full sample lives. The majority of individual stocks, on every continent, lost to cash.
Two. Of the 46,723 non-US stocks in the sample, only 42.6% generated a buy-and-hold return that beat T-bills. The median non-US stock returned −7.6% over its entire lifetime in the database.
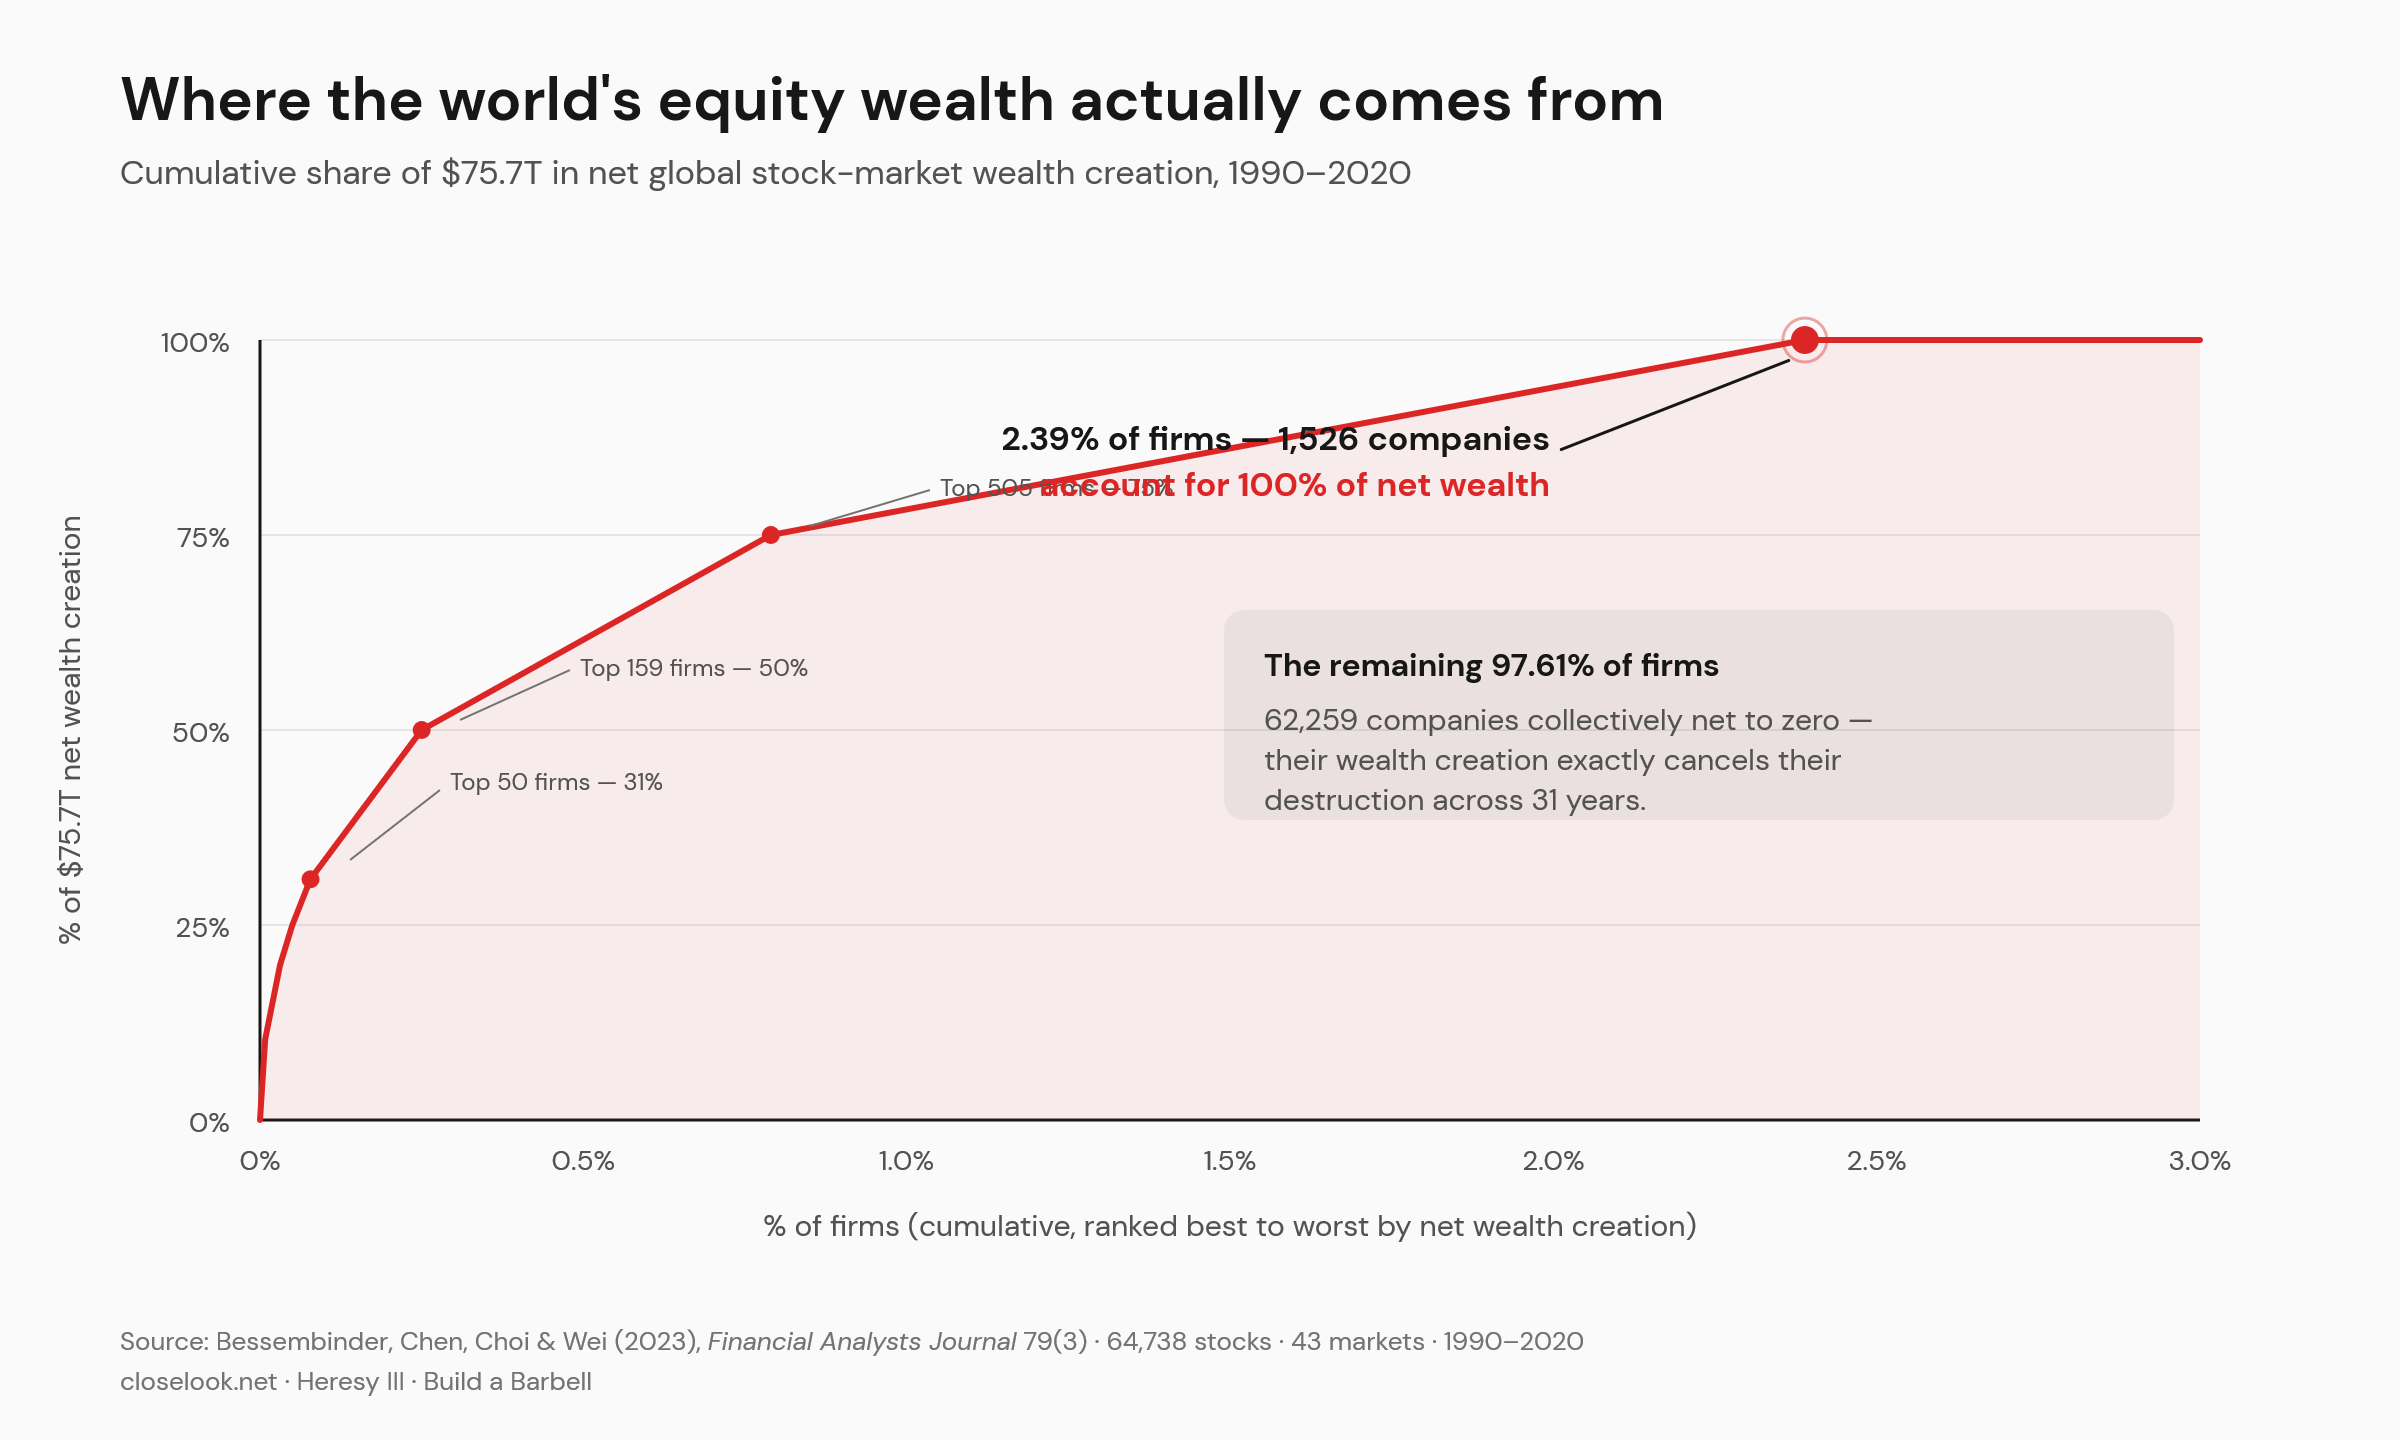
Three. Globally, the top 1,526 firms — 2.39% of the sample — accounted for 100% of the $75.66 trillion in net wealth creation. The remaining 97.6% collectively matched T-bills. Outside the US, the concentration is even sharper: just 1.41% of non-US firms account for all $30.7 trillion of non-US net wealth creation.
Four. The top five firms in the global sample — Apple, Microsoft, Amazon, Alphabet, Tencent — together comprise 0.008% of all firms and account for 10.3% of all global net wealth created in three decades.
This is not a US anomaly. It is a stock-market property. Compound returns are positively skewed by construction. Skewness means the long tail does the work. Over thirty years, the long tail does almost all of it.
Where it gets ugly
The headline numbers obscure how bad the picture is in individual markets. Median lifetime buy-and-hold returns, full sample, US dollars:
- Greece: −70.0%
- Nigeria: −70.6%
- Australia: −43.2%
- Poland: −41.3%
- Indonesia: −38.8%
- India: −33.6%
- South Africa: −33.4%
- Germany: −31.9%
- Russia: −31.6%
Read that German number again. The median listed German common stock, across the three decades from 1990 to 2020, destroyed roughly a third of investor capital relative to a buy-and-hold benchmark. Not a bad decade. Not a bad sector. The median.
The Japanese stock market, taken in aggregate across 3,983 sample firms, destroyed $2.22 trillion of net wealth between 1990 and 2020. Greece, Japan and Nigeria are the three markets in the sample where the aggregate national wealth-creation number is negative across the full thirty-one years.
And stock picking is structurally worse at the national level, not better. In 41 of the 43 markets, fewer than half of individual stocks outperform the value-weighted market over their lifetimes. The percentages that do outperform the local market: Greece 16.8%, Nigeria 17.3%, Japan 17.7%, Indonesia 18.7%, Poland 19.0%, Hong Kong 21.1%, China 23.9%, Germany 25.5%, the UK 26.2%.
In the German market, three out of four listed stocks underperformed the German market they were drawn from. Stock picking, in most major markets, is mathematically a losing strategy. Not a hard truth. A property of compounding.
The bootstrap mirror
The authors run an experiment to make sure nothing about sample length is hiding the result. Each month from January 1990 to December 2020, pick one stock at random from the universe of available global stocks. Hold it that month. Pick another at random next month. Compound for 31 years. Repeat the whole exercise 1,000 times.
This is the experience of a notional "lucky random stock-picker" over an entire investing lifetime. Outcomes for the global sample, full 31 years:
- Only 37.2% of these single-stock strategies have a positive return.
- Only 28.4% beat one-month T-bills.
- Only 15.2% beat the value-weighted market.
If you handed an investor a coin and told them to pick a single stock at random every month for 31 years, the most likely outcome — by a wide margin — is that they lose money in real terms. They have a 72% chance of underperforming a savings account.
Now scale up. Pick 100 random stocks each month instead of one. Non-US sample. Full 31 years:
- 89.0% beat T-bills.
- Only 45.4% beat the value-weighted market.
A diversified portfolio of 100 random non-US stocks — a portfolio bigger than what most retail investors will ever hold — still has a coin-flip chance of beating the cap-weighted market it was drawn from. Even aggressive diversification doesn't solve the underlying problem. It just reduces it.
So what is left?
The Bessembinder paper can be read two ways.
The first reading is the consensus one: "individual stocks are unreliable. Buy the broad cap-weighted market index. Capture the winners. Accept that you'll drag along the losers." This is the case for passive global market-cap indexing — MSCI World, MSCI ACWI, FTSE All-World. It is not wrong. The math says the index, by definition, contains the 1,526 winners.
But this reading leaves something obvious on the table. Bessembinder himself flags it, in the paper, in plain language: the result highlights "the magnitude of the potential gains to a long-horizon investor with a comparative advantage in identifying ex ante those stocks that will generate large long-run returns."
In other words: someone who can pre-select the winning buckets — not the individual tickers, but the structural categories — captures the skewness more efficiently than someone who buys everything.
The cap-weighted MSCI World works by owning every stock in proportion to its size today. That means it does own the 1,526 firms that will produce all the net wealth. It also owns the 62,000 that won't. You are holding the winning lottery ticket — but you are also holding 41 losing tickets for each winning one. The drag is real. It is not catastrophic — the winners are big enough to carry it — but it is a structural inefficiency that compounds over decades.
The second reading is the one we have been building Closelook around: own a curated reference portfolio. A thesis-driven basket that explicitly over-weights the structural buckets where the next $30 trillion of equity wealth creation is most likely to concentrate, and under-weights or excludes the rest.
This is not stock picking. Stock picking, as the data above shows, is structurally a losing trade. This is index design — building the reference portfolio at the sector, capability and structural level, where the comparative advantage Bessembinder is talking about can actually be exercised.
The Closelook reference portfolios
Every Closelook index is built as a transparent, thesis-driven reference portfolio. Methodology published, constituents published, rebalance dates published, base date fixed, live performance visible. Skin in the game. No black box.
Rubin Build-Out 100. One hundred stocks, eighteen sectors, six layers of the NVIDIA Rubin generation buildout: optical and photonics, memory and HBM, advanced packaging, power, storage, and the network and platform layer. Capped at 10% per name and 40% per top-five under UCITS rules. Quarterly rebalance. Base 1,000 from October 2022.
HALO Growth 100. Twelve sectors of physical-world compounders. The structural opposite of the AI buildout — companies whose long-run economics survive because they own physical reality: real estate, industrials, infrastructure, consumer-staples capacity, healthcare delivery.
Euro-AI Sovereign 50. Europe's domestic AI infrastructure thesis. The fifty European-listed companies that benefit if the continent — for sovereignty, regulatory and data-residency reasons — decides to build, host, train and govern its AI capacity within its own borders.
AW25 Agentic Winners 25. Seven sectors of agentic winners. A tactical seismograph rather than a long-only basket — designed to read the rotation between cybersecurity, SaaS exposure, vertical agents and infrastructure as the agentic stack matures.
These are not "globally diversified equity portfolios." They are reference portfolios with an explicit thesis. If the thesis is wrong, the indices will tell us within months — the live performance is public. If the thesis is right, the indices will compound, and the compounding will be visible long before anyone needs to commit a single euro.
The story picker — close out the noise
Some readers will want, alongside the curated reference portfolios, a small concentrated exposure to individual story stocks. That is legitimate. Within a properly built portfolio the tactical sleeve can hold individual names, not only thematic baskets. But it demands a discipline that almost no retail and very little institutional money actually applies.
The discipline is simple to state and brutally hard to execute: close out the noise.
Do not listen to financial journalists. Their incentive is engagement, not signal — and Bessembinder's data shows that the stocks getting the most column inches are usually the ones already deep into their compounding cycle, where the wealth has been created, not the ones at the start of it.
Do not listen to sell-side analysts. Their job is to generate trading commissions and investment-banking relationships. Decades of academic research have shown that their target prices and Buy / Hold / Sell ratings have close to zero predictive power on the timescale that matters for skewness capture.
Do not listen to buy-side analysts presenting at conferences. They are talking their own book by definition — the position is already on, and what you hear is the rationalization, not the entry.
Do not listen to asset managers with proven disaster track records — and the industry is full of them. The 60/40 advocates who told you to load up on long-duration treasuries in 2021. The Value managers who underweighted the structural compounders through 2014–2020. The Emerging Markets enthusiasts who anchored portfolios in MSCI EM through fifteen years of underperformance. The Japan bulls of every generation since 1990. These are not bad people. They are people whose framework is broken in a Bessembinder world — and frameworks that are broken at the foundation do not get fixed by trying harder.
Listen instead to the very small number of authorities in the market who may genuinely know more than the consensus. The operators at the structural center of the wave — the CEOs who control the capital allocation of the firms that are the Wealth-Creator distribution. The supply-chain principals who see the next two years of orders before they hit the tape. The handful of investors whose public records survive scrutiny across multiple regime changes.
These are very few people. But they exist. And listening to them — systematically, with method, with explicit signal extraction from their public statements — is the only form of story-stock selection consistent with the Bessembinder reality. Everything else is noise dressed up as analysis.
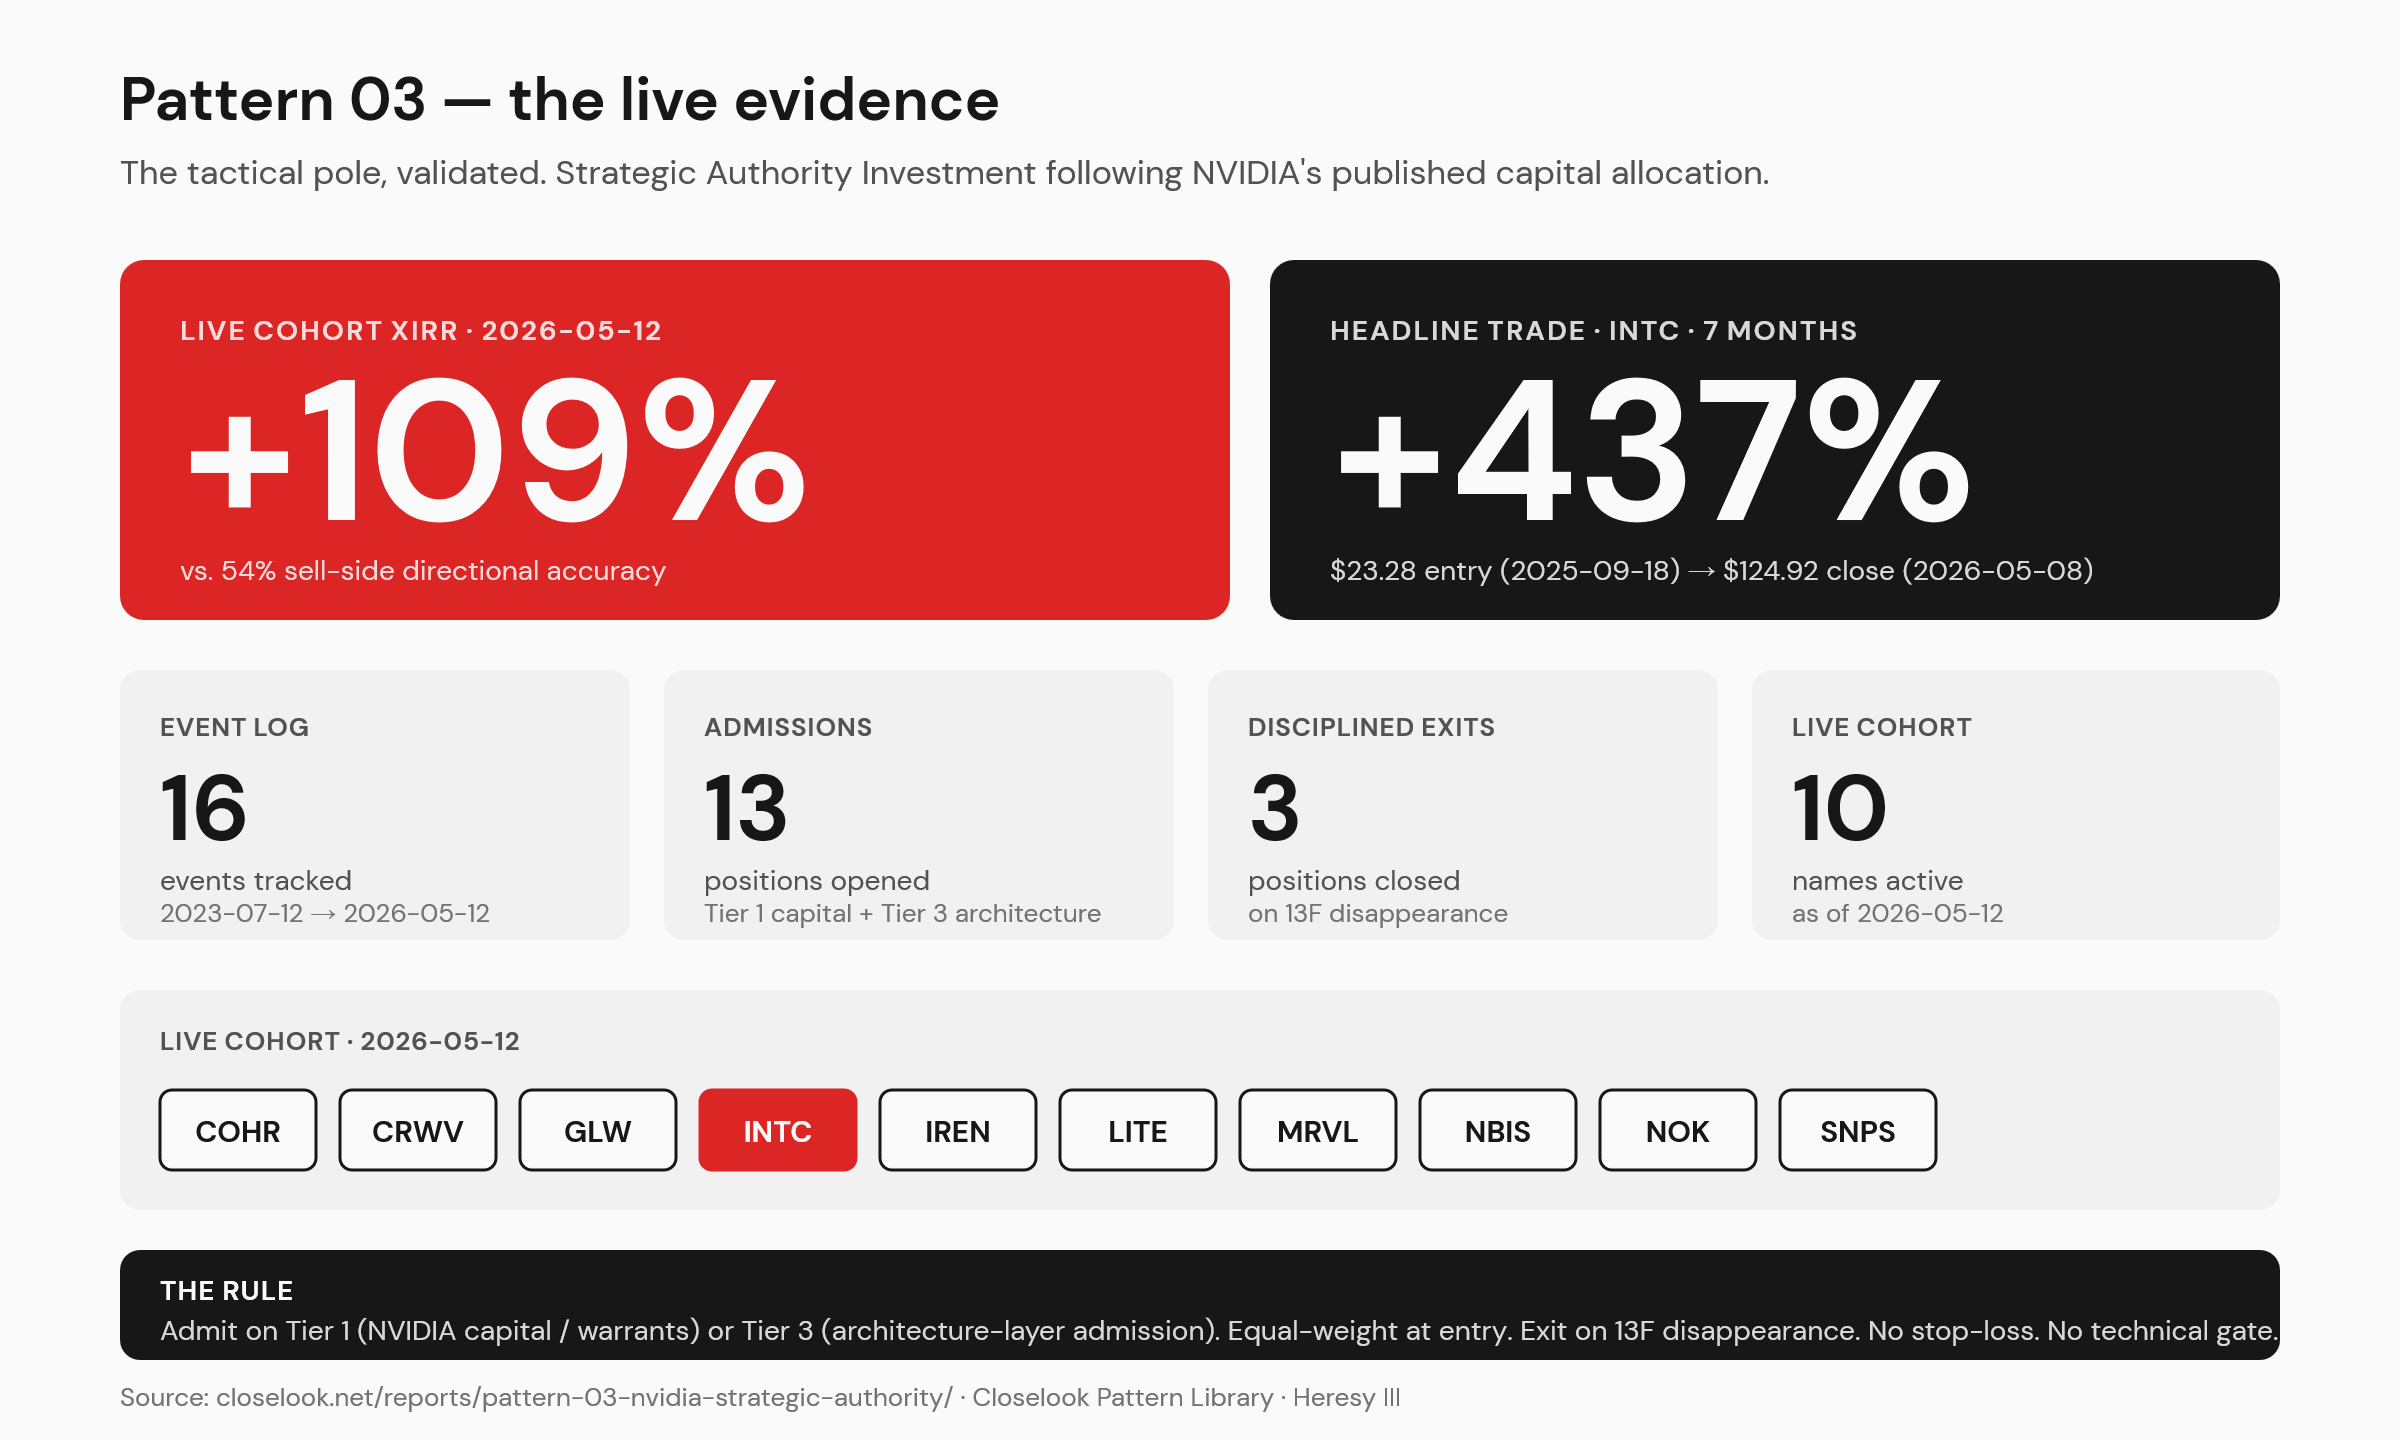
In the next Closelook piece we will lay out a fully transparent, easy-to-follow tactical strategy built on exactly this principle. It systematically follows the public constraint language of one specific operator at the structural center of the largest equity wealth-creation cycle of the last five years — Jensen Huang of NVIDIA — and converts those statements into a concrete, time-stamped equity portfolio. The strategy has produced more than 100% return on the relevant window. It is publishable in a single newsletter. You will be able to read the rule, see the trades, and follow it yourself.
Bottom line — and the next heresy
Stocks are at highs. Inflows are at highs. The consensus advice is to buy the global market.
The data — 64,738 stocks, 43 markets, 31 years, $75.7 trillion in net wealth — says the consensus is leaving structural wealth on the table. Most individual stocks lose to cash. Most individual markets concentrate their wealth creation in fewer than 2% of their listed firms. Most diversified portfolios still underperform the cap-weighted index they were drawn from.
But the inconvenient truth runs deeper than "the consensus is leaving wealth on the table." It is that the entire orthodox toolkit of the asset-management industry — Mean-Variance Optimization, the Sharpe Ratio, Risk Parity, Value Investing, Dividend Aristocrats, Defensive Equity tilts — was designed for a world of symmetric returns where mean and variance describe the investment. Bessembinder's data shows we do not live in that world. We live in a world where Wealth Creation is structurally concentrated in the tails, where the median outcome is negative in 21 of 43 major markets, and where any framework that optimizes the center of the distribution is optimizing the wrong object.
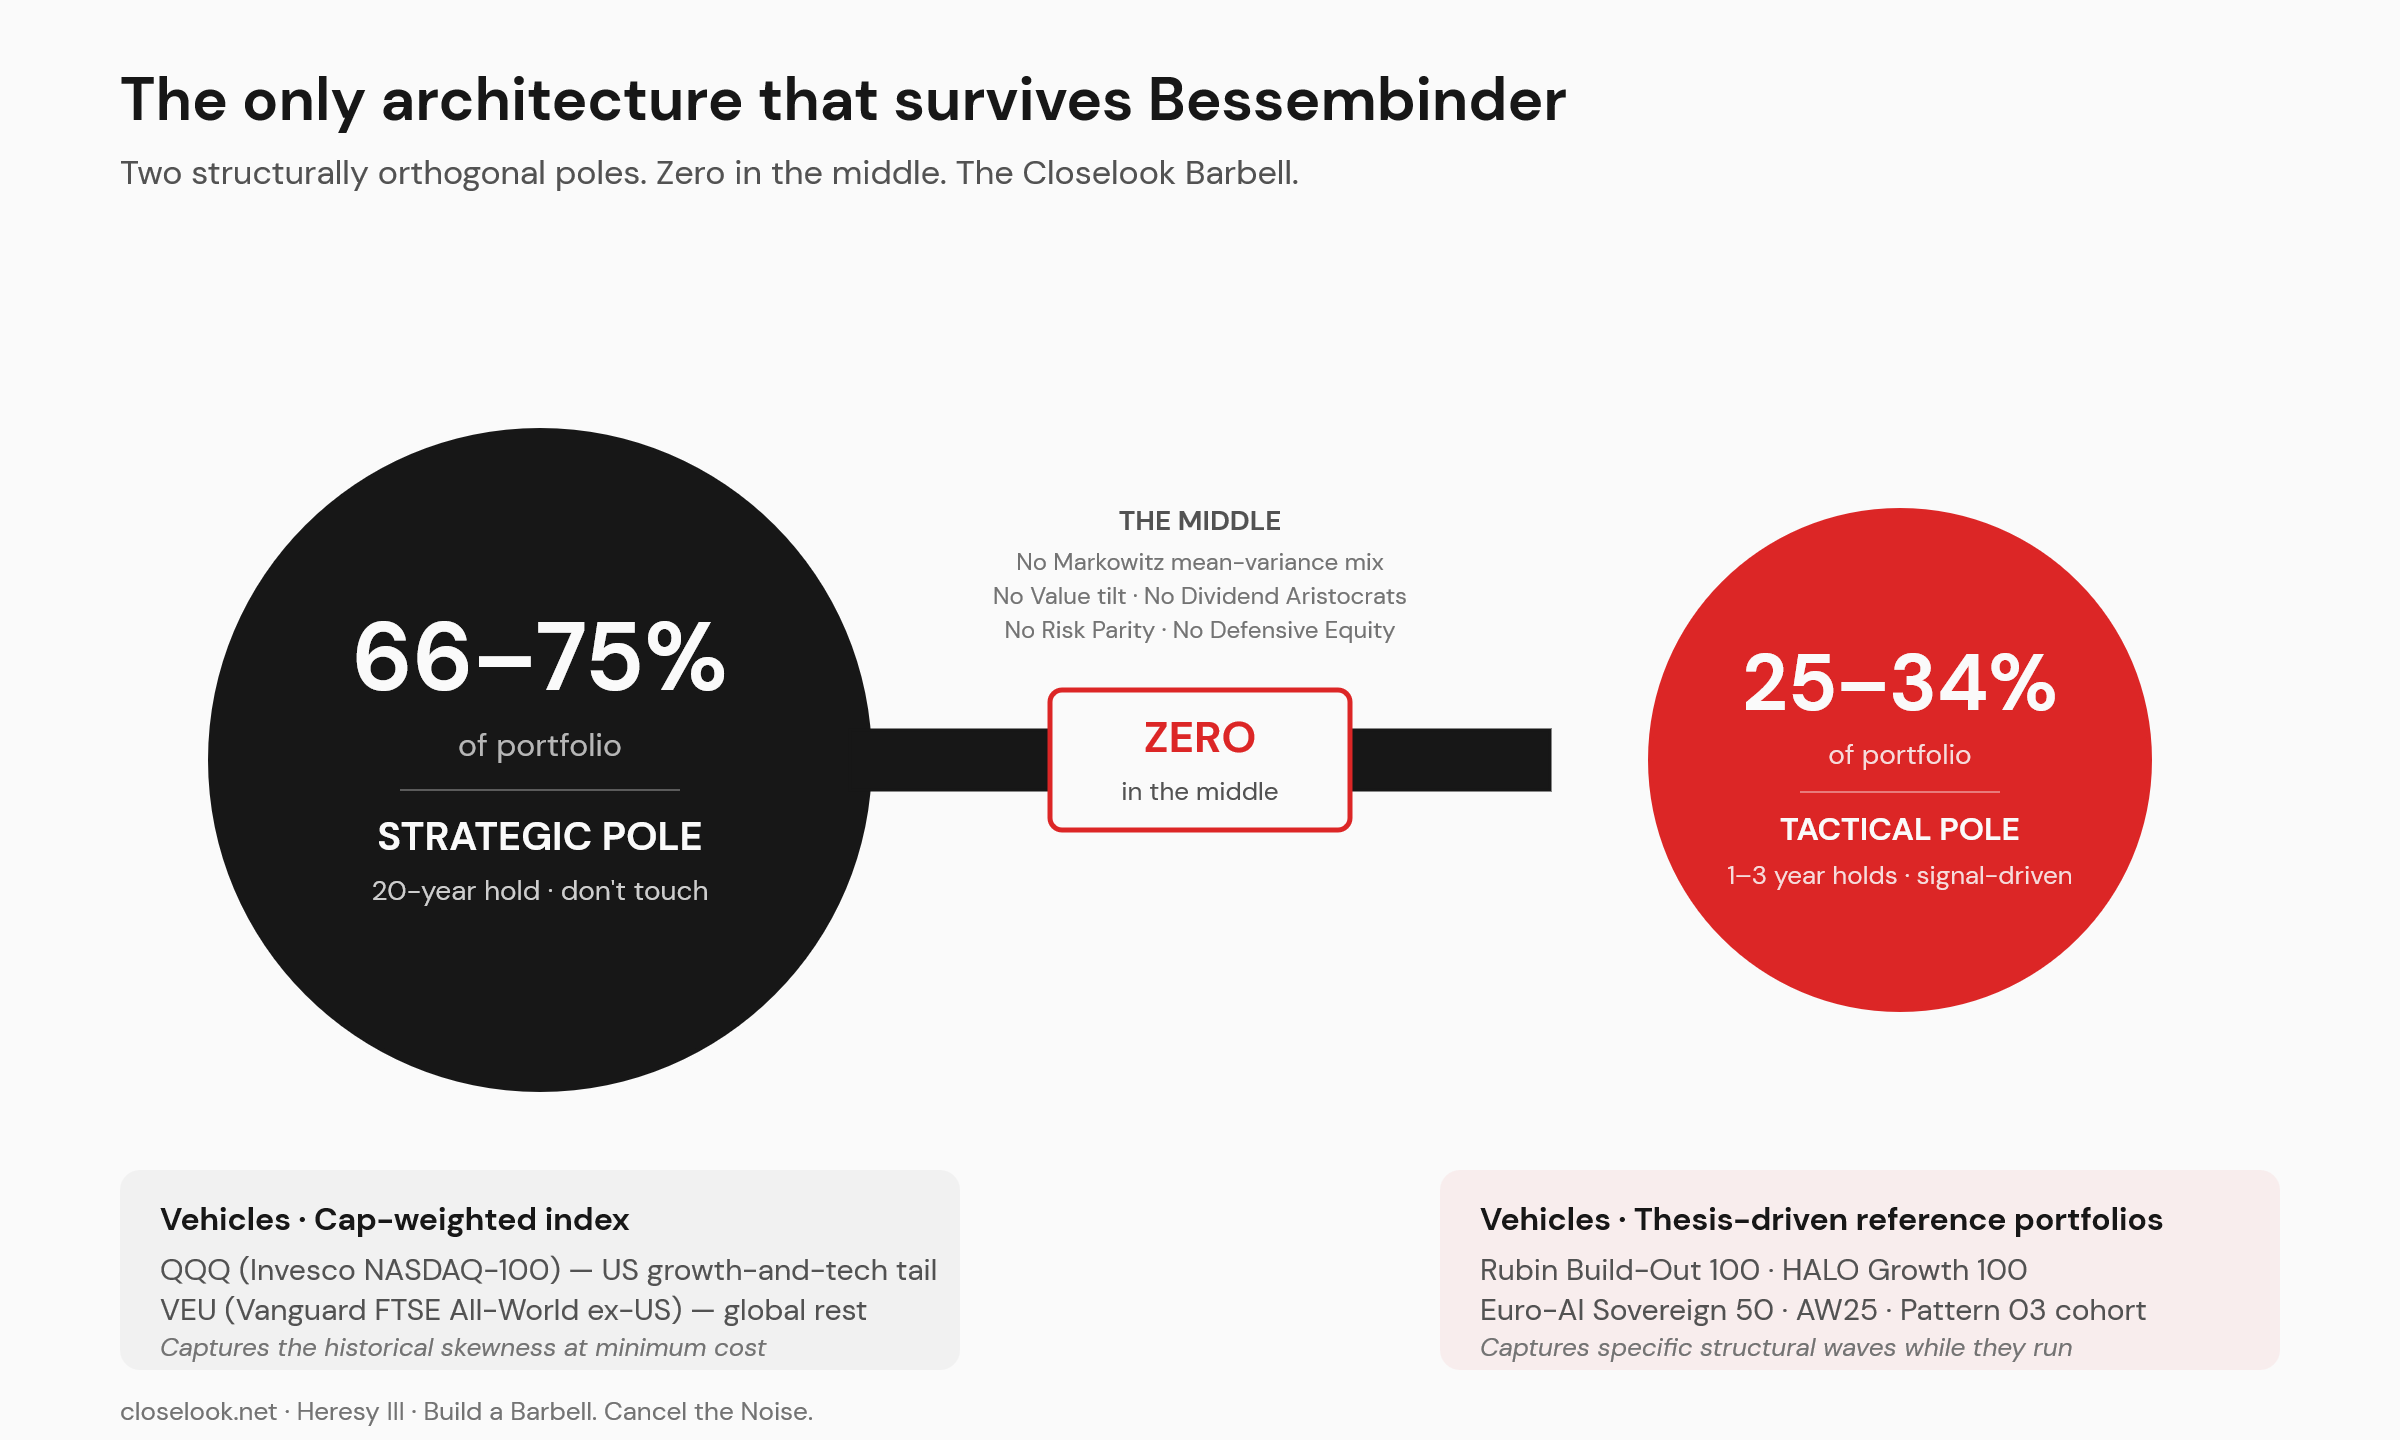
The next Closelook heresy — Heresy III — spells out the only portfolio architecture internally consistent with this reality: a Barbell.
- 66 to 75% of the portfolio in the broadest, cheapest, most liquid cap-weighted index vehicles available. QQQ (Invesco NASDAQ-100) for the US growth and tech tail where global skewness has historically concentrated most heavily. VEU (Vanguard FTSE All-World ex-US) for the global rest. Together they cover the worldwide Wealth-Creator distribution at minimum cost. Buy and hold. Twenty-year horizon. Don't touch it.
- 25 to 34% in tactical sector and thematic positions, with a one-to-three-year holding period — explicitly not buy-and-hold. Driven by signal: Generation Rotation, the Weekly Signal framework, structural-authority extraction. Entered when the wave is in Dawn or Early Ramp, exited when the wave matures into Sunset. This is the sleeve the Closelook reference portfolios — Rubin Build-Out 100, HALO Growth 100, Euro-AI Sovereign 50, AW25 — were designed to fill.
- Zero in the middle of the distribution. No Mid-Cap-Value tilt. No Dividend Aristocrats. No Risk Parity. No Markowitz-optimized mean-variance mix. The whole middle is where Bessembinder's 62,000 non-creators live, and a portfolio that allocates capital there is funding decay, not compounding.
And inside the tactical sleeve, the discipline above: close out the noise, follow the small number of authorities whose words are leading indicators of capital deployment, and exit when the signal flips.
Don't just buy a portfolio of US stocks. Don't just buy global stocks the same way either. Build a Barbell: a very few passive indices for the long pole, structural-authority signals and a couple of story stocks for the short one. Cancel the noise in between. And in the next post, we show one way the short pole works in practice — with a strategy that has returned more than 100% in a very short time, a single named authority, no meme stocks, no small caps — a portfolio you can replicate from your kitchen table.
Sources: Bessembinder, H., Chen, T.-F., Choi, G. and Wei, K.C.J. (2023). "Long-Term Shareholder Returns: Evidence from 64,000 Global Stocks." Financial Analysts Journal 79 (3): 33–63. DOI 10.1080/0015198X.2023.2188870. SSRN abstract 3710251. All figures cited above are from the published paper or its Internet Data Appendix; all dollar figures in US dollars, all returns compared to one-month US Treasury bill returns over matched horizons.