Heresy · 10:00 NY
Build a Barbell — Closelook Heresy III
Why the orthodox toolkit of the asset management industry is structurally broken — what replaces it — and the only worked example we know that delivers a live XIRR of +109%.

Why the orthodox toolkit of the asset management industry is structurally broken — what replaces it — and the only worked example we know that delivers a live XIRR of +109%.
In Heresy I we said don't buy US stocks. The standard rebuttal was: "fine, diversify globally."
In Heresy II we showed why that rebuttal fails — Bessembinder, Chen, Choi and Wei (2023) prove the same skewness across 43 markets and 64,738 stocks. Most individual stocks lose to cash. Most major markets concentrate their wealth in fewer than 2% of their listed firms. The median listed German stock destroyed nearly a third of investor capital over thirty years. Japan in aggregate destroyed $2.22 trillion. Don't buy global stocks either.
So what does survive?
A Barbell. Built on two structurally orthogonal exposures with an explicit refusal of the middle. This is Heresy III — and it is also where almost everything the asset management industry sells you breaks.
What Bessembinder actually breaks
Most readers will accept the first-order conclusion of Heresy II — most individual stocks underperform cash. The second-order conclusion takes longer to digest: every standard tool of orthodox portfolio management was designed for a world in which Bessembinder's data could not exist.
Markowitz (1952) and the entire Mean-Variance Optimization framework — together with everything that builds on it: the Sharpe Ratio, the Capital Asset Pricing Model, every "efficient frontier" your private bank shows you, Risk Parity, Black-Litterman — assume the return distribution is adequately described by its first two moments. Mean and variance. In a symmetric world, that assumption is reasonable. In a Bessembinder world, it is empirically false.
- The mean lifetime buy-and-hold return for non-US stocks in the 1990–2020 sample is +322%. The median is −7.6%. The mean is an artifact of a tiny number of extreme winners. Almost no actual investor will ever experience anything close to it.
- The standardized skewness coefficient for lifetime returns reaches 39 in Hong Kong and 40 in India. These are not "slightly skewed" distributions. They are a different distributional family altogether.
- The Sharpe Ratio penalizes volatility symmetrically. But positive skewness — the asymmetry that drives long-term wealth creation — requires short-horizon volatility. Punishing volatility is punishing the mechanism.
- Mean-Variance Optimization, applied to a world like this, produces "optimal" portfolios that are optimal for an investor who does not exist — namely, one whose horizon and utility function make mean and variance sufficient statistics.
Value Investing has a sharper, more specific problem. Every classical Value screen — low P/E, low P/B, high dividend yield, high free-cash-flow yield, low growth at stable margins — is by construction backward-looking. And Bessembinder's data shows that the firms which produced the world's equity wealth, during the phases when they produced it, violated every classical Value screen at once. Apple in 2009 was "expensive" by P/E. Amazon for fifteen straight years had no Value buyer in the room. Tesla, Nvidia, ASML, Novo Nordisk, LVMH, Kweichow Moutai — all "expensive" through their entire compounding decade.
Meanwhile the firms that screen "cheap" on a classical Value framework are, far more often than not, exactly the firms in the lower half of Bessembinder's distribution. PetroChina was the single largest wealth-destroyer in the global sample. Nine of the eleven worst-performing firms globally were Japanese banks and utilities — every one of them a textbook Value candidate at the time. WorldCom, Lucent, Wachovia were Value-screen darlings before they imploded. The structural Value Trap is not a market anomaly. It is the design output of using a screening rule that systematically selects from the part of the distribution that produces no wealth.
Value Investing, on the Bessembinder evidence, leads you into the centre of long-term decay.
This is not a marginal critique. It says that the dominant frameworks of the orthodox asset management industry — used by trillions of dollars under management — are working on the wrong object. They optimize the centre of the distribution. The centre is where wealth does not happen.
What the industry actually delivers
The empirical record confirms the theoretical critique.
The S&P Dow Jones SPIVA Scorecard — the industry-standard twenty-year benchmark of active versus passive performance — reports that over the period 2005–2024:
- 94.1% of US domestic actively-managed funds underperformed the S&P Composite 1500.
- 97.3% underperformed on a risk-adjusted basis.
- Only 48.5% of those funds even survived the full twenty-year window.
In the first half of 2025, 79% of actively managed US large-cap equity funds underperformed the S&P 500 — a fourteen-percentage-point worsening over the prior year.
Sell-side analysts — the source the financial press most often quotes when it tells you what to buy — have a measurable problem. Multi-dimensional studies of analyst twelve-month price targets find a mean absolute prediction error of 39.1%. And, more damning, only 54% of target prices correctly predict the future direction of the price. Direction. Not magnitude. Coin-flip plus four percentage points.
This is the empirical baseline against which any tactical equity strategy must be evaluated. If a transparent rule cannot beat 54% directional accuracy, it is not a strategy. It is paid market beta with extra steps.
The only architecture that survives
If most stocks lose, if most markets concentrate, if most active funds underperform, and if the framework that pretends to optimize for risk-adjusted return is working on the wrong object — what is left?
A Barbell. Two structurally orthogonal exposures. No middle.
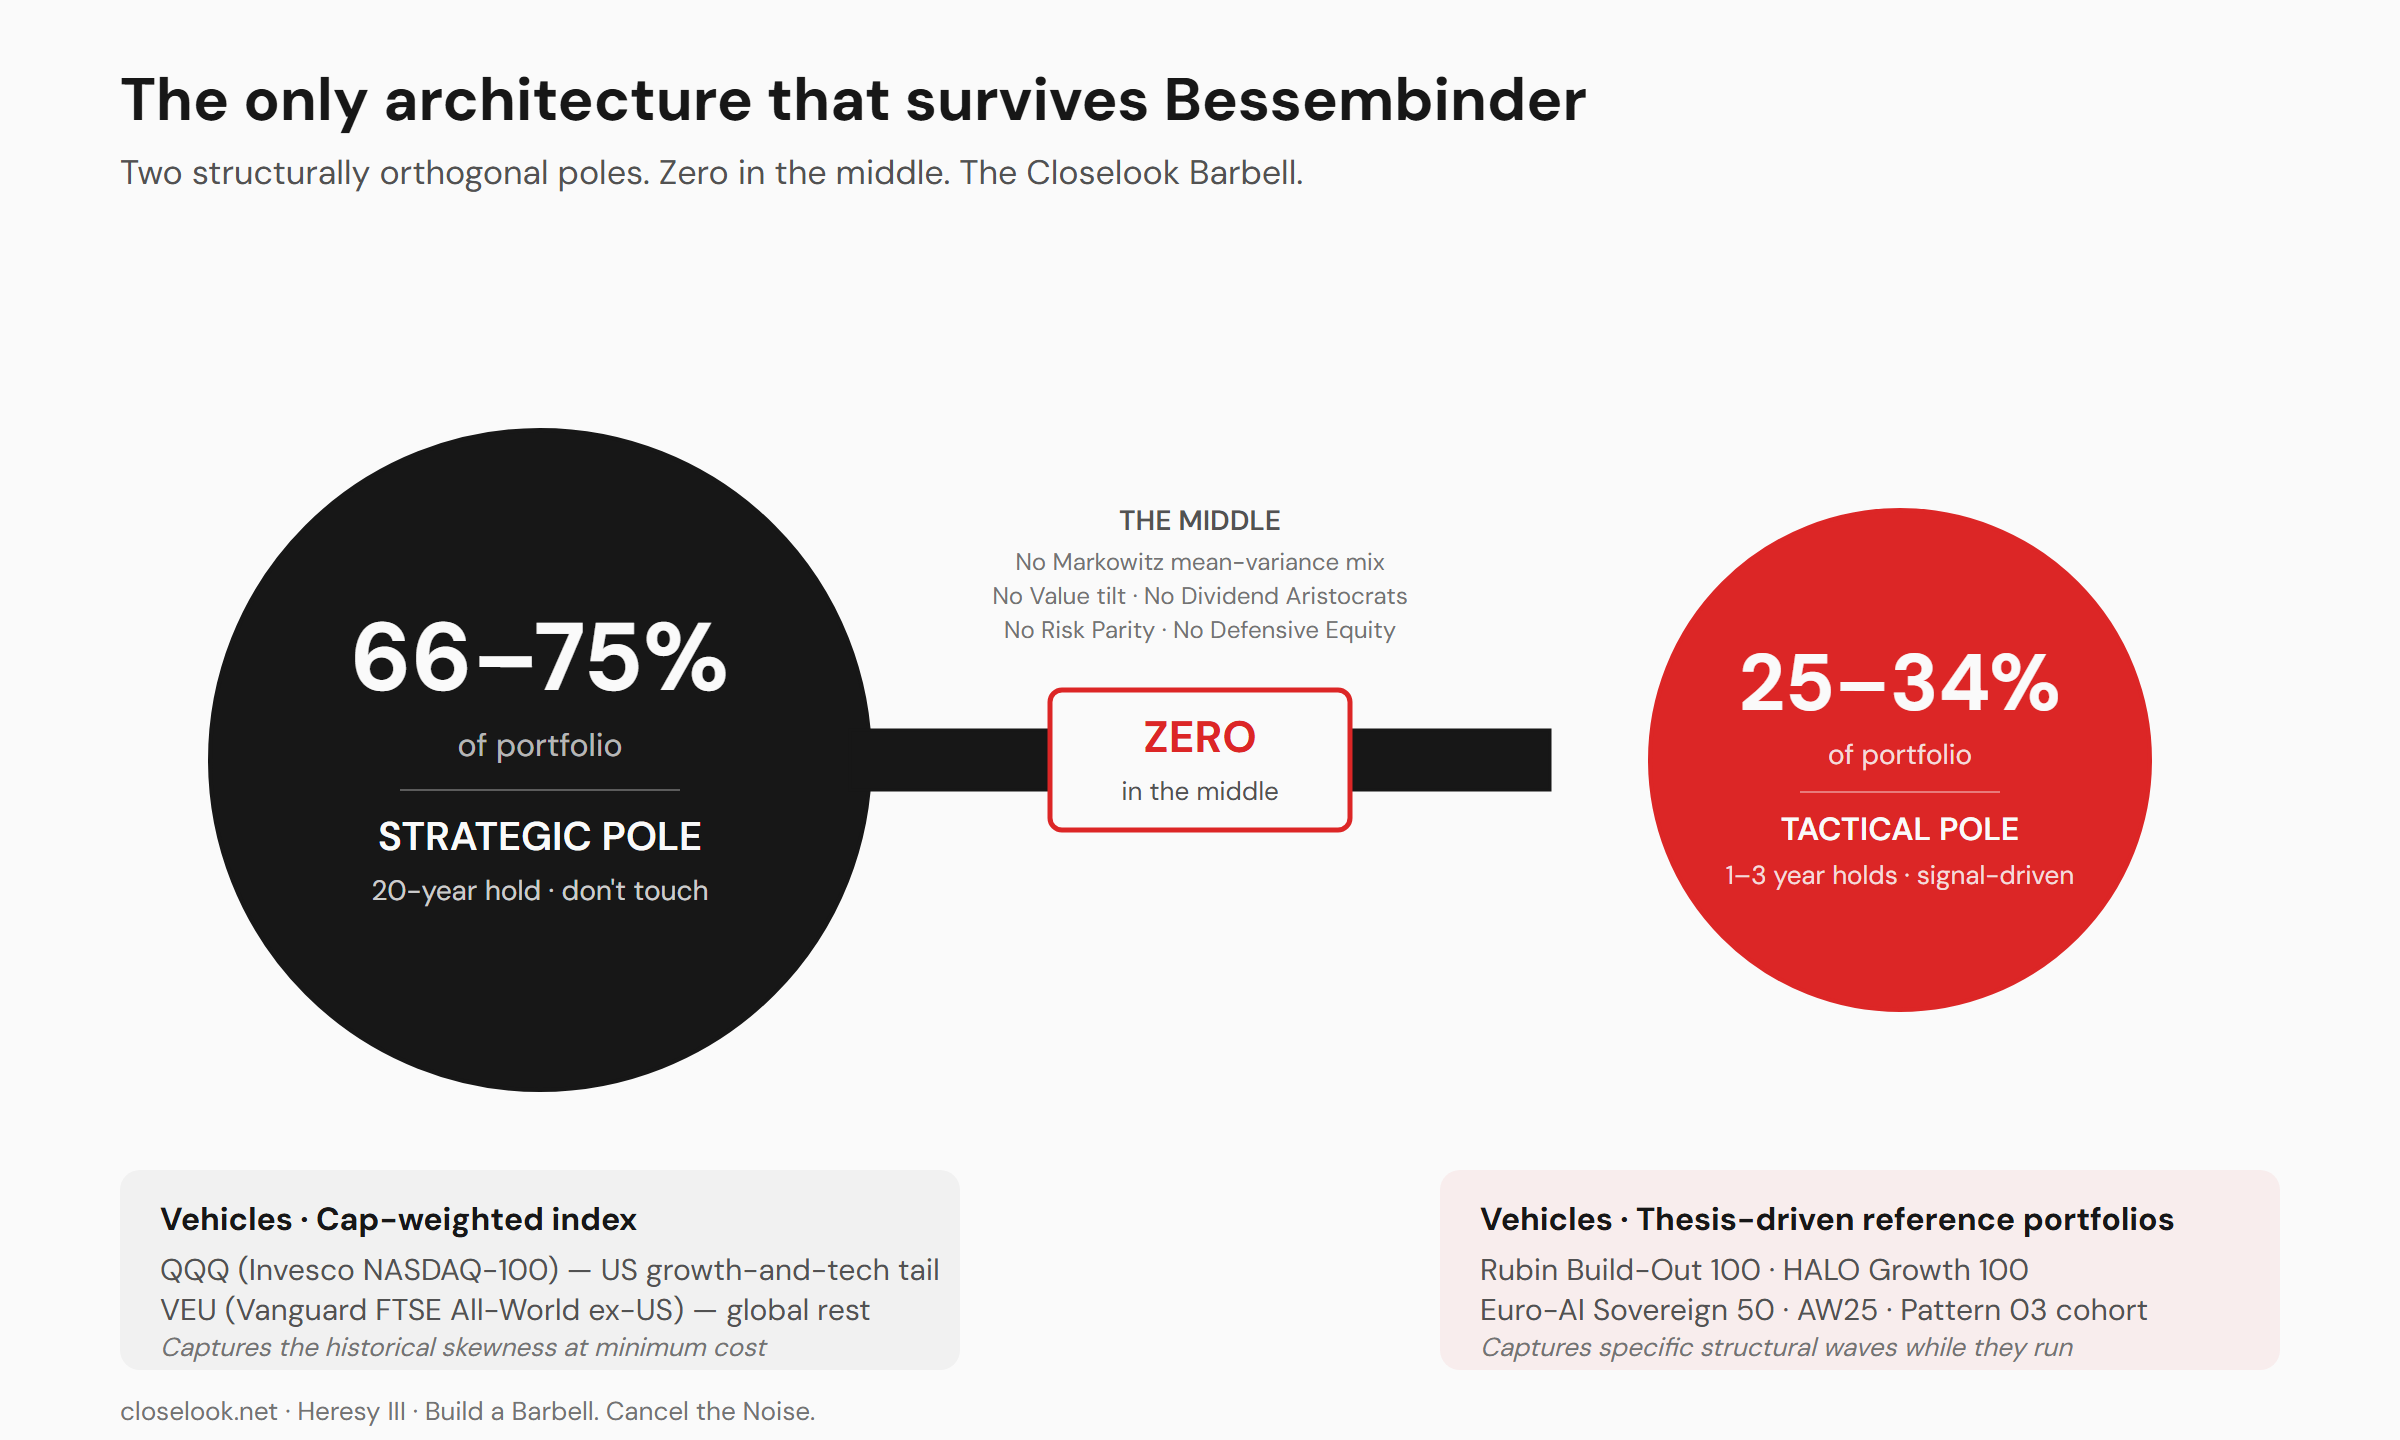
The strategic pole — 66 to 75% of the portfolio
The broadest, cheapest, most liquid cap-weighted index vehicles available. Two are enough:
QQQ (Invesco NASDAQ-100) — the US growth-and-tech tail, where historical skewness has concentrated most heavily. Apple, Microsoft, Amazon, Alphabet, Nvidia, Tesla, Meta — every US wealth creator of the last twenty years sat inside this index long before any of them were big enough to dominate broad MSCI ACWI weights. QQQ is, in passive form, the cheapest way to be concentrated where the skewness has been.
VEU (Vanguard FTSE All-World ex-US) — cap-weighted, roughly 3,700 names, the global rest. This is where Tencent, ASML, TSMC, Novo Nordisk, LVMH, Saudi Aramco sit. The non-US 1.41% of firms that captured all $30.7 trillion of non-US net wealth creation.
Together they cover the worldwide Wealth-Creator distribution at minimum cost. Buy and hold. Twenty-year horizon. Don't touch. No tactical adjustment. No defensive shift. No "the market is overvalued so we de-risk." This is the part of the portfolio that does the long-pole work of compounding — the part that does not need to be smart, only patient.
The tactical pole — 25 to 34% of the portfolio
A concentrated sleeve with an explicit one-to-three-year holding period. Not buy-and-hold. Driven by signal. Exited when the signal flips.
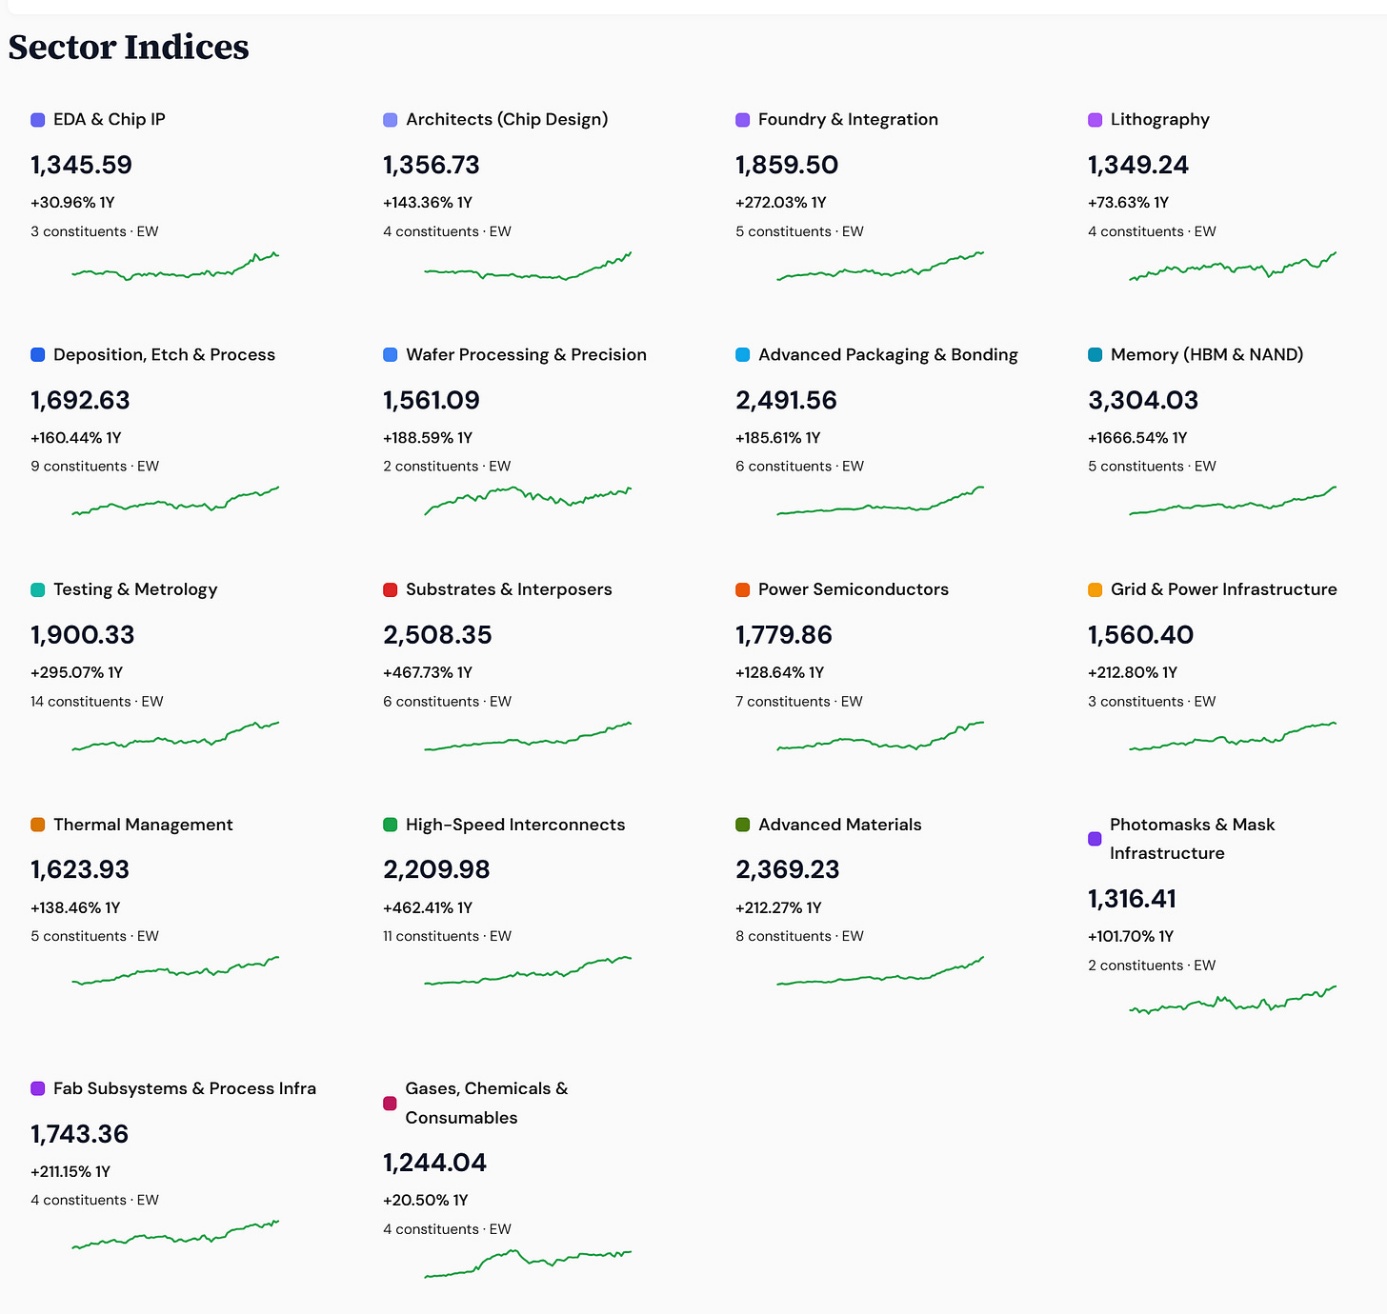
This is the sleeve in which the Closelook reference portfolios live: Rubin Build-Out 100 for the AI infrastructure wave, HALO Growth 100 for physical-world compounders, Euro-AI Sovereign 50 for the European sovereignty thesis, AW25 for tactical agentic exposure. Each is a thesis-driven cap-allocation onto a specific structural wave. Each is entered when the wave is in Dawn or Early-Ramp phase under the Generation Rotation Framework, and exited when the wave matures into Sunset. The Rubin Build-Out 100 is currently +87.56% YTD on its Equal-Weight basis — the structural compounding of an AI infrastructure cycle that is, on the framework's read, still in Early Ramp.
Within this sleeve, individual story stocks can also be held — but only when guided by a method that survives Bessembinder. Picking individual names against the consensus of sell-side analysts (54% directional accuracy) or active managers (94% twenty-year underperformance) is not a strategy. It is a slow loss with extra commissions.
The middle — zero
No Mid-Cap-Value tilt. No Dividend Aristocrats. No Risk Parity. No Markowitz mean-variance mix. No Defensive Equity sleeve. No "bond ladder ballast" for a forty-year-old portfolio.
The whole middle is where Bessembinder's 62,000 non-creators live. Capital allocated there does not reduce portfolio risk on the relevant timescale. It funds decay.
The noise problem
Inside the tactical pole, the operating question becomes: which signals do you actually listen to?
The obvious sources are bad sources.
Financial journalists produce news, not signal. Their incentive is engagement. A reporter writing about a $5 billion equity injection has the same headline word count as one writing about a routine product launch. Two events with radically different consequences. The headline does not distinguish them. Daily output is the job description; edge identification is not.
Sell-side analysts — 54% directional accuracy. Their job is to generate trading commissions and investment-banking relationships. Their target prices are loud, frequent and barely better than random on the direction that matters.
Buy-side analysts at conferences are talking their book by definition. You are hearing the rationalization, not the entry.
Active managers with proven disaster track records — the industry is full of them. The 60/40 advocates who loaded long-duration treasuries in 2021. The Value managers who underweighted the FAANGs through 2014–2020. The Emerging Markets enthusiasts who anchored portfolios in MSCI EM through fifteen years of underperformance. The Japan bulls of every generation since 1990. The problem is not effort. The problem is that their framework was built for a symmetric-return world that does not exist, and you cannot fix a broken foundation by trying harder.
Close out the noise.
The valid alternative is the operator at the structural centre of the wave — the actor whose published capital allocation is itself the signal, because it is binding, because it leaves a paper trail, and because its directional accuracy inside its own domain is materially better than 54%.
There are very few such operators. Inside the AI infrastructure stack — and only there — one of them is named Jensen Huang, and his vehicle is NVIDIA.
The worked example: Pattern 03
Pattern 03 — NVIDIA Strategic Authority Investment is the Closelook formal methodology that converts NVIDIA's public capital allocation into a replicable equity strategy. The full dossier, the four-tier signal hierarchy, the 16-event timeline, the Rubin Build-Out sector overlay and the forward calendar are published at /reports/pattern-03-nvidia-strategic-authority/. The summary that matters here:
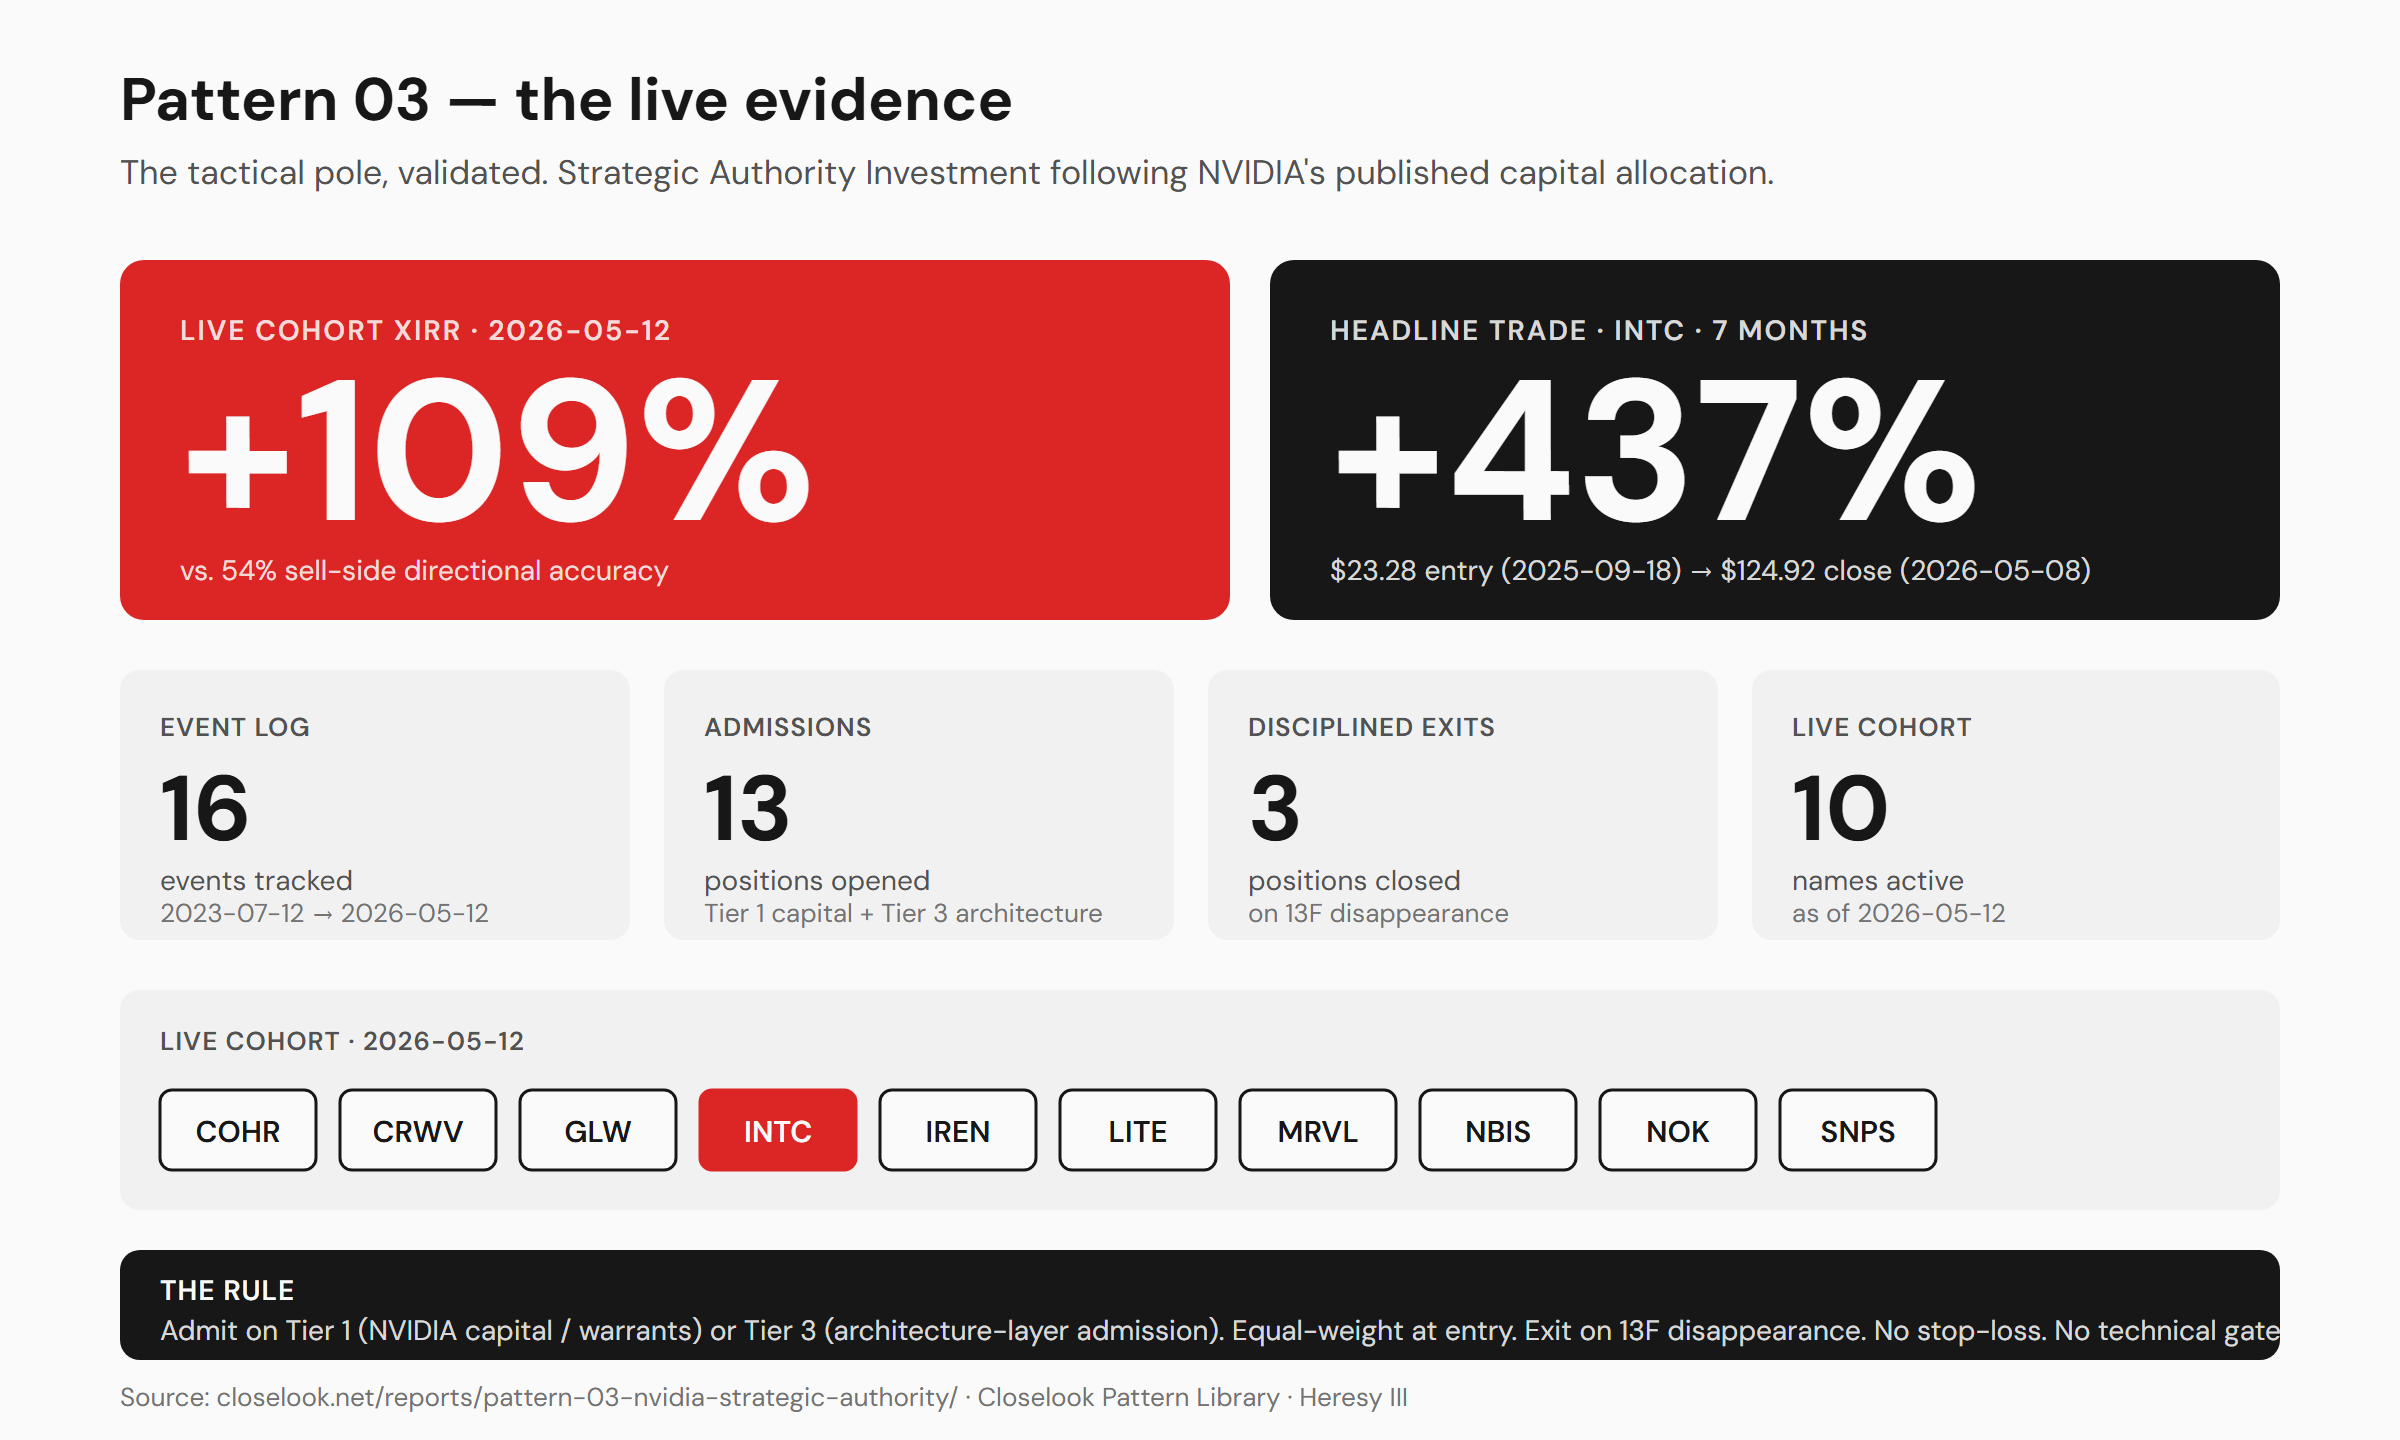
The rule. Admit a public-equity ticker to the cohort when NVIDIA discloses (a) a corporate equity stake or warrants (Tier 1 — Capital, the hardest and most reliable signal) or (b) admits the company to a named NVIDIA architecture layer such as NVLink Fusion, Spectrum-X, DSX or AI-RAN (Tier 3 — Architecture integration). Equal weight at entry. The position rebalances to 1/(N+1) on each new admission. No stop-loss. No technical-indicator gate. No time-based exit. Exit when NVIDIA divests (13F disappearance), displaces (contradicting partnership), or the security delists.
The popular meme conflates Tier 4 — Language (Jensen says something on a podcast) with Tier 1 — Capital (NVIDIA writes a check). Pattern 03 explicitly does not. Tier 4 is the noise floor. Capital is the quietest signal and the most reliable one.
The data. 16-event log from 2023-07-12 through 2026-05-12. 13 admissions, 1 skip, 3 closes. Live cohort as of May 2026: COHR · CRWV · GLW · INTC · IREN · LITE · MRVL · NBIS · NOK · SNPS.
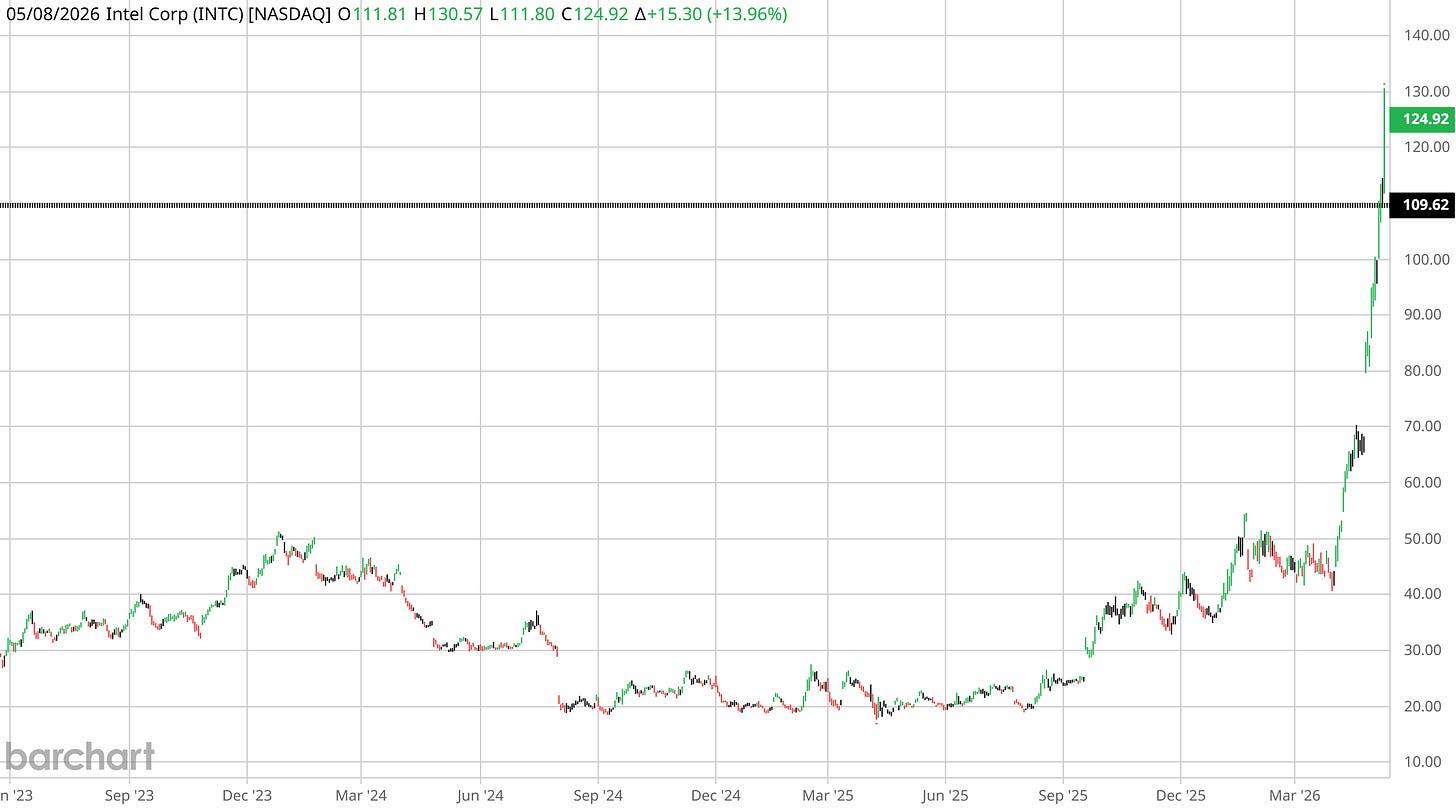
The headline trade. NVIDIA bought INTC common stock at $23.28 on 2025-09-18 — a $5 billion direct equity investment paired with x86 / RTX / data-center co-design under NVLink. INTC closed at $124.92 on 2026-05-08. +437% in seven months. The announcement gap-up captured roughly +22%. The remaining roughly +415% accrued to whoever held the position through the seven months that followed. Jensen speaks, stocks follow captures the +22%. Pattern 03 captures the +415%.
The aggregate. Live cohort XIRR as of 2026-05-12: +109%.
The exit discipline. Applied Digital (APLD) was admitted in September 2024 on a $160 million NVIDIA equity placement plus an AI-cloud GPU hosting partnership — every NVIDIA bottleneck keyword in a single press release. The position appeared in three consecutive 13Fs. Then it disappeared. Pattern 03 closed APLD on 2026-02-17, the filing date of the 13F that showed no position. APLD traded materially lower in the months that followed. The rule does not assume NVIDIA's conviction is permanent. A scanner without an exit rule is a graveyard.
Why it works. NVIDIA writes checks into sectors that (a) can lead the rotation, (b) have not yet led to their full extent, and (c) sit on top of a bottleneck NVIDIA needs to harden before its next product cycle ships. NVIDIA's directional accuracy on structural calls inside AI infrastructure has been demonstrably higher than the 54% baseline of sell-side analysts and the ~6% twenty-year alpha-survival rate of active managers. The Bessembinder world says you cannot reliably outperform by listening to most sources. Pattern 03 says: when one source has demonstrably better information, the simplest move is to listen to that one.
Of two equally good solutions, the less complex one is better. Of two solutions where one is meaningfully better, the choice is not aesthetic.
What you do tomorrow
If you accept the Bessembinder data, the Markowitz critique, the SPIVA evidence and the noise problem, the operational consequences are concrete:
One. Build the strategic pole. 66 to 75% of the portfolio split between QQQ (US growth-and-tech tail) and VEU (global rest). Cap-weighted. Lowest fees you can find. Buy and forget for twenty years.
Two. Build the tactical pole. 25 to 34% of the portfolio in thesis-driven exposures with one-to-three-year holding periods. The Closelook reference portfolios are designed for this slot: Rubin Build-Out 100 for the AI infrastructure wave, HALO Growth 100 for physical-world compounders, Euro-AI Sovereign 50 for the European sovereignty thesis, AW25 for tactical agentic exposure.
Three. Inside the tactical pole, follow operator authority. Pattern 03 is the worked example for the AI infrastructure stack — full methodology, 16-event log, live cohort, forward calendar, and exit history all published. Live XIRR +109%. Replicable from any brokerage account that lets you buy common stock.
Four. Cancel the middle. No defensive equity sleeve. No Mid-Cap-Value tilt. No "balanced" Risk Parity. No Markowitz-optimized mean-variance mix. No Dividend Aristocrats. No bond ladder ballast on a forty-year horizon.
Five. Cancel the noise. No financial press as a signal source. No sell-side targets. No buy-side conference takes. No fund manager whose framework was built for a 1980s symmetric-return world.
Bottom line
The three-part Heresy series ends here.
Heresy I — Don't buy US stocks. (4% of stocks accounted for 100% of US net wealth creation from 1926 to 2016.)
Heresy II — Don't buy global stocks either. (1.41% of non-US firms accounted for 100% of $30.7 trillion in non-US net wealth from 1990 to 2020. Most major markets median-destroy capital over decades.)
Heresy III — Build a Barbell. Index for the long pole. Operator authority for the short one. Zero in the middle. Cancel the noise.
The Bessembinder data is uncontestable. The asset management industry has not caught up. The operational consequences for how you actually build a portfolio are concrete, replicable, and — judging by the live record — measurable.
The Wise Men of the orthodox industry built a framework for a world that does not exist. The actual Wise Man, sitting inside the largest equity wealth-creation cycle of the last five years, publishes his capital allocation in 8-K filings every few months. Follow the wise man whose track record clears 54%. Cancel the rest. And rebuild your portfolio around the only architecture the data supports.
Follow the wise men.
Sources and methodology: Bessembinder, H., Chen, T.-F., Choi, G. and Wei, K.C.J. (2023). "Long-Term Shareholder Returns: Evidence from 64,000 Global Stocks." Financial Analysts Journal 79 (3): 33–63. DOI 10.1080/0015198X.2023.2188870. SSRN 3710251. S&P Dow Jones Indices SPIVA Scorecard, 20-Year Persistence Report (2005–2024). Closelook Pattern 03 — NVIDIA Strategic Authority Investment methodology paper: /reports/pattern-03-nvidia-strategic-authority/. Closelook Rubin Build-Out 100 index methodology and live performance: /indices/rubin/. Companion Heresies: Heresy I (Don't Buy US Stocks) and Heresy II (Don't Buy Global Stocks).