Daily Pulse · · 08:30 CET · market · GLD
Not necessarily the secular story. But the hot momentum phase in GLD looks finished, or at least paused.
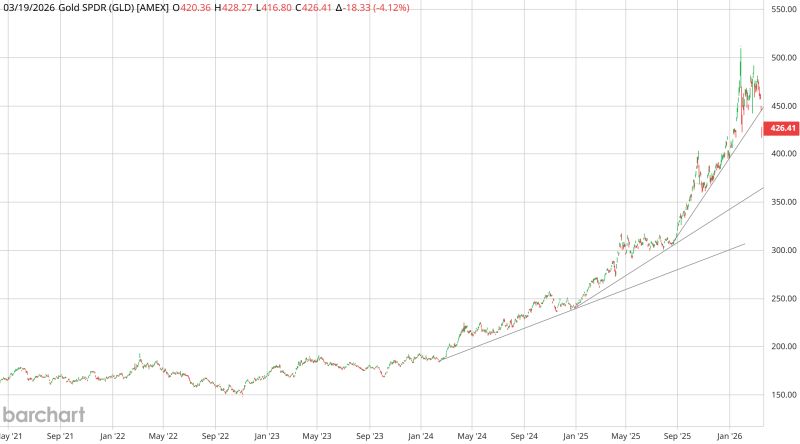
Three things stand out on the chart. The secular bull produced three progressively steeper rising trendlines. The third and steepest has now been broken — typical when the most speculative phase is over. Price shows double-top behavior around $500. Failed breakouts after a parabolic move, in a positive macro environment, may mark exhaustion rather than continuation.
Most importantly, gold failed to make a new all-time high despite a very supportive macro backdrop: geopolitical escalation around Iran and persistent US inflation concerns. When an asset cannot make new highs on bullish news, that is a warning sign.
The base case: a medium-term trend change may be underway. After a steep drop, GLD will probably attempt to recover. But $450 looks like strong resistance. If GLD fails to reclaim that level, the next phase could accelerate to the downside. On the downside, $400 appears plausible in what could become a standard ABC correction.
Gold has been an extremely crowded trade since mid-2025. Unless held for a long-term strategic reason, this is probably not the time to chase. Rallies look more like selling opportunities than invitations to add exposure. The secular bull may still be alive, but the best part of the party looks over.