Read · · 30 min read

A Closelook Lab Read — why a 50-year-old anomaly still leaks alpha and how the Pattern Engine scans for it

(1) Executive Summary
Post-Earnings Announcement Drift is the oldest and most-replicated anomaly in modern market microstructure. The mechanic is simple: when a company reports earnings, the market reacts immediately, but it underreacts. Over the following sixty trading days, the stock continues to drift in the direction of the original surprise. Beats keep working. Misses keep failing. Half a century of academic literature, hundreds of published replications, real-money strategies running this pattern continuously — and the drift still shows up in the data.
This Lab Read explains why the anomaly exists, why it has not been arbitraged away despite being public knowledge since 1968, and how the Closelook Pattern Engine scans for it weekly across the Rubin, HALO, Euro-AI, and AW40 universes. We walk through three historical cases drawn from the SaaS and cybersecurity universe in 2024–2025: Rubrik in December 2024 as the Mid-Cap pure-form drift, CrowdStrike in November 2024 as the Reversal-PEAD case after the Falcon outage, and Salesforce in May 2024 as the Large-Cap narrative-shift drift. We close with where PEAD fails, how it combines with other patterns in the Closelook stack, and how to read the live scanner output without confusing decision support for decision making.
(2) Why PEAD Matters For Closelook Readers
For investors who already follow earnings closely, PEAD is the formalization of an intuition many have but few systematize. You see a stock pop ten percent on a beat, and you wonder whether the move is done or whether there is more to come. You see another stock collapse on a miss, and you ask whether the worst is priced in or whether the supply is still being distributed. PEAD does not give you certainty. It gives you a base rate: a probabilistic read on which of those two reactions is statistically still leaking, and how long the leak typically lasts.
The Closelook Pattern Engine takes this from intuition to scan. Every week, after the major reporting clusters, the engine measures the three-day cumulative abnormal return for every name in the covered universes, ranks them by surprise magnitude, and isolates the top and bottom quintiles as candidate drift setups. The hierarchy matters: the engine does not act on the surprise alone. It checks the regime layer first (is the market in a state where drift typically works?), then the trend layer (is the individual name in a context that supports continuation?), then the pattern layer (is the surprise large enough to qualify?). PEAD becomes one signal in a multi-layer architecture, not a standalone trading system.
This Lab Read is the methodology behind that architecture. It is the theory. The Pattern Engine is where you see it work in real time.
(3) The Anomaly — Ball, Brown, Bernard, Thomas
In 1968, two accounting researchers named Ray Ball and Philip Brown published a paper that quietly became one of the foundational documents of modern empirical finance. They asked a simple question: when companies report earnings, does the stock market react fully on the day of the announcement, or does information continue to be incorporated over time? Their finding, replicated continuously since: the market underreacts. Stocks with positive earnings surprises continue to outperform for sixty days after the announcement. Stocks with negative surprises continue to underperform. The reaction is not instantaneous. It bleeds.
This finding sat in the academic literature for two decades, treated as a curiosity rather than an exploitable phenomenon. Then, in 1989 and 1990, Victor Bernard and Jacob Thomas published two papers that turned the curiosity into a recognized anomaly. They demonstrated three things. First, the drift was robust across decades, sample selections, and methodologies. Second, the magnitude was economically meaningful: the top quintile of earnings surprises outperformed the bottom quintile by roughly thirteen percent annualized. Third, and most importantly, the drift could not be explained away by risk-based factor models. It was not compensation for systematic risk. It was a real, persistent, and mispriced phenomenon.
The Bernard-Thomas papers triggered a cascade. Hundreds of follow-up studies confirmed the basic finding across markets, time periods, and methodological variants. Researchers tested whether it was concentrated in small caps (it is, but it works in large caps too), whether it required earnings announcements specifically (similar drifts appear after analyst revisions and dividend announcements), whether it could be replicated outside the United States (yes, in essentially every developed market with sufficient earnings calendar transparency), and whether it had been arbitraged away over time (it has weakened, particularly in mega caps, but it has not disappeared).
By the early 2000s, PEAD was no longer a curiosity. It was textbook material, included in every empirical asset pricing course, referenced as the canonical example of a behavioral anomaly that survives despite being widely known. Quantitative funds traded variants of it. Academic researchers proposed dozens of mechanisms to explain why it persisted. And yet, twenty-five years after Bernard and Thomas formalized it, the drift still shows up in modern data — slightly weaker than it was in the 1980s, concentrated more heavily in mid and small caps than in mega caps, but unmistakably alive.
The persistence is the puzzle. Markets are supposed to learn. Anomalies, once identified, are supposed to be arbitraged away as capital flows toward the mispricing and competes the excess return down to zero. PEAD has been public knowledge since the year before the Berlin Wall fell. Why does it still work?
(4) Why It Still Works After 50 Years

The persistence of PEAD is not an accident. It is the result of four reinforcing mechanisms, each of which has structural reasons to remain in place rather than dissolve over time. Together they form what behavioral finance calls a robust limit to arbitrage: a mispricing that exists not because nobody knows about it, but because the conditions that allow capital to correct it are themselves persistently constrained.
The four mechanisms
The first mechanism is anchoring and underreaction. When a company reports earnings that materially differ from expectations, market participants do not immediately re-anchor to the new information. They partially adjust. The price moves on the day, but the move is calibrated against the prior consensus rather than the new reality. Over the following weeks, as analysts revise their estimates, as institutional research desks update their models, and as the news cycle keeps the story alive, the price drifts to incorporate what was actually a step-change in fundamentals. This is the original Bernard-Thomas explanation, and it remains the most parsimonious. Humans anchor. Anchoring is slow to dissolve. Markets aggregate human decisions. Therefore markets anchor, and re-anchor slowly.
The second mechanism is analyst revision lag. When earnings come in dramatically above or below consensus, sell-side analysts do not all update their estimates on the same day. They update over a period of weeks, sometimes months, with each revision triggering a new round of institutional buy or sell flows. A company that beats by twenty percent on a Thursday morning may see twenty separate analyst revisions over the following six weeks, each of which produces a small pulse of mechanical buying as long-only funds rebalance toward the new consensus. The revision itself is not the cause of the drift, but the staggered pace of revisions creates a natural extension of the price move that compounds with the anchoring effect.
The third mechanism is limits to arbitrage, particularly in the mid- and small-cap segments where PEAD effects are strongest. Even if a hedge fund identifies a clean drift setup in a $2 billion market cap name, the practical capital it can deploy is limited by float, by volume, and by the impact cost of building a position in a name that does not trade hundreds of millions of dollars per day. The arbitrage exists, but the arbitrageurs cannot scale it. As soon as a fund tries to take a meaningful position in a small-cap drift setup, its own buying pushes the price, the apparent edge compresses, and the marginal trade becomes uneconomic. This means the drift remains exploitable for sized-appropriate participants but cannot be fully eliminated by the largest pools of capital. It is an anomaly that fits in spaces where capital is constrained.
The fourth mechanism is retail inertia and news-cycle delay. A meaningful share of equity market activity comes from retail flows, which respond to news on a delayed timeline. The earnings happen Tuesday after the close. The financial press writes about it Wednesday morning. The newsletters cover it Wednesday evening. The retail investor reads about it on the weekend. The retail buying then pulses into the market on Monday and Tuesday of the following week, and continues at a decaying pace for the next several weeks as the story works through different layers of media coverage and word-of-mouth. This is not a bug in retail behavior; it is simply a structural feature of how information propagates through non-institutional channels. The pulse is real, it is measurable, and it provides part of the demand that sustains the drift.
These four mechanisms do not work independently. They reinforce each other. Anchoring slows the initial reaction; analyst revisions extend the move; arbitrage limits prevent fast money from compressing the edge; retail inertia provides ongoing demand. The result is a phenomenon that survives despite being one of the most widely documented anomalies in finance — because each of the underlying mechanisms is structural, behavioral, or architectural, and none of them are subject to elimination by the simple act of publicizing the pattern.
There is a final point worth making explicitly. PEAD has weakened over time. Bernard and Thomas measured a thirteen percent annualized spread between top and bottom quintiles in the 1970s and 1980s. Modern replications, particularly post-2010, find spreads closer to six or seven percent, with the effect concentrated more heavily in the smaller end of the cap spectrum. This weakening is real, and any honest treatment of the pattern must acknowledge it. But weakening is not vanishing. The edge has compressed; it has not disappeared. For a research platform that scans systematically across mid- and small-cap-tilted universes, six to seven percent annualized spread between long and short legs remains economically significant, particularly when combined with other patterns in a multi-signal stack.
(5) The Mechanic — How The Pattern Engine Scans For PEAD

The Closelook Pattern Engine implements PEAD as a four-step pipeline: trigger detection, abnormal return measurement, classification by quintile, and integration into the hierarchical Pattern Engine architecture. Each step is fully deterministic, reproducible from the data, and free of subjective judgment. This is not a discretionary process. It is a scan.
Step one is trigger detection. Every trading day, the engine pulls the earnings calendar from EODHD for the next two weeks and the past four weeks across the covered universes. Each calendar entry contains the announcement date, the time of release (before or after market hours), the consensus estimate, and the actual reported figure once available. Names that have not yet reported are queued. Names that reported within the last five trading days but have not yet reached the T+3 measurement window are also queued. Names that have reached T+3 are processed.
Step two is abnormal return measurement. For each name that has reached T+3, the engine calculates the cumulative abnormal return over the three trading days following the announcement. The formula is straightforward: take the percentage price change from the close before the announcement to the close three trading days after, and subtract the equivalent percentage change in a reference index over the same window. The reference index is chosen to match the name's primary sector and market cap segment. For Rubin universe names, the engine uses CL-RUBIN-EW as the reference. For HALO names, CL-HALO. For Euro-AI, CL-EURO-AI. For AW40, CL-AW40. The choice of reference matters because PEAD is fundamentally about idiosyncratic surprise, not about market-wide moves; subtracting the index isolates the name-specific component.
Step three is classification by quintile. Once the engine has computed CARs for all names that reported in the relevant window, it ranks them by magnitude and isolates the top quintile (typically the highest twenty percent of positive CARs in the window) and the bottom quintile (the lowest twenty percent). Top-quintile names become Long Setups. Bottom-quintile names become Short Setups. The middle three quintiles produce no signal. The threshold for inclusion in either tail is dynamic: it adjusts to the dispersion of the current week's surprises rather than using a fixed percentage cutoff. In a quiet earnings week with small surprises across the board, the threshold compresses; in a noisy week with several large beats and misses, it widens. This dynamic threshold prevents the engine from generating spurious signals during low-information periods.
Step four is integration into the layered architecture. The Pattern Engine is hierarchical: regime first, then trend, then pattern. The PEAD signals from step three are passed through two upstream filters before becoming live alerts. The regime filter checks whether the current market state is consistent with PEAD effects working — historically, drift patterns are weaker during high-volatility regime transitions and stronger during stable trending regimes. The trend filter checks whether the individual name is in a trend context that supports continuation: a positive CAR in a name already in a strong uptrend is more likely to drift than the same CAR in a name fighting a sustained downtrend. Names that pass both filters become live PEAD alerts in the Pattern Engine output. Names that fail either filter are flagged in the engine but do not appear as actionable signals.
The output is a weekly signal list, published every Friday after the US close, containing the Long Setups and Short Setups that survived all three layers of the architecture. Each signal includes the name, the CAR magnitude, the announcement date, the reference index used, the regime state at signal generation, the trend context, and the expected hold horizon of sixty-three trading days. The list is not a buy list. It is a candidate list — names where the statistical base rate of continuation is favorable enough to warrant deeper review. What you do with that list is a function of your portfolio construction, position sizing, and risk preferences. The engine generates the candidates. The decisions remain yours.
(1) Executive Summary
Post-Earnings Announcement Drift is the oldest and most-replicated anomaly in modern market microstructure. The mechanic is simple: when a company reports earnings, the market reacts immediately, but it underreacts. Over the following sixty trading days, the stock continues to drift in the direction of the original surprise. Beats keep working. Misses keep failing. Half a century of academic literature, hundreds of published replications, real-money strategies running this pattern continuously — and the drift still shows up in the data.
This Lab Read explains why the anomaly exists, why it has not been arbitraged away despite being public knowledge since 1968, and how the Closelook Pattern Engine scans for it weekly across the Rubin, HALO, Euro-AI, and AW40 universes. We walk through three historical cases drawn from the SaaS and cybersecurity universe in 2024–2025: Rubrik in December 2024 as the Mid-Cap pure-form drift, CrowdStrike in November 2024 as the Reversal-PEAD case after the Falcon outage, and Salesforce in May 2024 as the Large-Cap narrative-shift drift. We close with where PEAD fails, how it combines with other patterns in the Closelook stack, and how to read the live scanner output without confusing decision support for decision making.
(2) Why PEAD Matters For Closelook Readers
For investors who already follow earnings closely, PEAD is the formalization of an intuition many have but few systematize. You see a stock pop ten percent on a beat, and you wonder whether the move is done or whether there is more to come. You see another stock collapse on a miss, and you ask whether the worst is priced in or whether the supply is still being distributed. PEAD does not give you certainty. It gives you a base rate: a probabilistic read on which of those two reactions is statistically still leaking, and how long the leak typically lasts.
The Closelook Pattern Engine takes this from intuition to scan. Every week, after the major reporting clusters, the engine measures the three-day cumulative abnormal return for every name in the covered universes, ranks them by surprise magnitude, and isolates the top and bottom quintiles as candidate drift setups. The hierarchy matters: the engine does not act on the surprise alone. It checks the regime layer first (is the market in a state where drift typically works?), then the trend layer (is the individual name in a context that supports continuation?), then the pattern layer (is the surprise large enough to qualify?). PEAD becomes one signal in a multi-layer architecture, not a standalone trading system.
This Lab Read is the methodology behind that architecture. It is the theory. The Pattern Engine is where you see it work in real time.
(3) The Anomaly — Ball, Brown, Bernard, Thomas
In 1968, two accounting researchers named Ray Ball and Philip Brown published a paper that quietly became one of the foundational documents of modern empirical finance. They asked a simple question: when companies report earnings, does the stock market react fully on the day of the announcement, or does information continue to be incorporated over time? Their finding, replicated continuously since: the market underreacts. Stocks with positive earnings surprises continue to outperform for sixty days after the announcement. Stocks with negative surprises continue to underperform. The reaction is not instantaneous. It bleeds.
This finding sat in the academic literature for two decades, treated as a curiosity rather than an exploitable phenomenon. Then, in 1989 and 1990, Victor Bernard and Jacob Thomas published two papers that turned the curiosity into a recognized anomaly. They demonstrated three things. First, the drift was robust across decades, sample selections, and methodologies. Second, the magnitude was economically meaningful: the top quintile of earnings surprises outperformed the bottom quintile by roughly thirteen percent annualized. Third, and most importantly, the drift could not be explained away by risk-based factor models. It was not compensation for systematic risk. It was a real, persistent, and mispriced phenomenon.
The Bernard-Thomas papers triggered a cascade. Hundreds of follow-up studies confirmed the basic finding across markets, time periods, and methodological variants. Researchers tested whether it was concentrated in small caps (it is, but it works in large caps too), whether it required earnings announcements specifically (similar drifts appear after analyst revisions and dividend announcements), whether it could be replicated outside the United States (yes, in essentially every developed market with sufficient earnings calendar transparency), and whether it had been arbitraged away over time (it has weakened, particularly in mega caps, but it has not disappeared).
By the early 2000s, PEAD was no longer a curiosity. It was textbook material, included in every empirical asset pricing course, referenced as the canonical example of a behavioral anomaly that survives despite being widely known. Quantitative funds traded variants of it. Academic researchers proposed dozens of mechanisms to explain why it persisted. And yet, twenty-five years after Bernard and Thomas formalized it, the drift still shows up in modern data — slightly weaker than it was in the 1980s, concentrated more heavily in mid and small caps than in mega caps, but unmistakably alive.
The persistence is the puzzle. Markets are supposed to learn. Anomalies, once identified, are supposed to be arbitraged away as capital flows toward the mispricing and competes the excess return down to zero. PEAD has been public knowledge since the year before the Berlin Wall fell. Why does it still work?
(4) Why It Still Works After 50 Years
The persistence of PEAD is not an accident. It is the result of four reinforcing mechanisms, each of which has structural reasons to remain in place rather than dissolve over time. Together they form what behavioral finance calls a robust limit to arbitrage: a mispricing that exists not because nobody knows about it, but because the conditions that allow capital to correct it are themselves persistently constrained.
The four mechanisms
The first mechanism is anchoring and underreaction. When a company reports earnings that materially differ from expectations, market participants do not immediately re-anchor to the new information. They partially adjust. The price moves on the day, but the move is calibrated against the prior consensus rather than the new reality. Over the following weeks, as analysts revise their estimates, as institutional research desks update their models, and as the news cycle keeps the story alive, the price drifts to incorporate what was actually a step-change in fundamentals. This is the original Bernard-Thomas explanation, and it remains the most parsimonious. Humans anchor. Anchoring is slow to dissolve. Markets aggregate human decisions. Therefore markets anchor, and re-anchor slowly.
The second mechanism is analyst revision lag. When earnings come in dramatically above or below consensus, sell-side analysts do not all update their estimates on the same day. They update over a period of weeks, sometimes months, with each revision triggering a new round of institutional buy or sell flows. A company that beats by twenty percent on a Thursday morning may see twenty separate analyst revisions over the following six weeks, each of which produces a small pulse of mechanical buying as long-only funds rebalance toward the new consensus. The revision itself is not the cause of the drift, but the staggered pace of revisions creates a natural extension of the price move that compounds with the anchoring effect.
The third mechanism is limits to arbitrage, particularly in the mid- and small-cap segments where PEAD effects are strongest. Even if a hedge fund identifies a clean drift setup in a $2 billion market cap name, the practical capital it can deploy is limited by float, by volume, and by the impact cost of building a position in a name that does not trade hundreds of millions of dollars per day. The arbitrage exists, but the arbitrageurs cannot scale it. As soon as a fund tries to take a meaningful position in a small-cap drift setup, its own buying pushes the price, the apparent edge compresses, and the marginal trade becomes uneconomic. This means the drift remains exploitable for sized-appropriate participants but cannot be fully eliminated by the largest pools of capital. It is an anomaly that fits in spaces where capital is constrained.
The fourth mechanism is retail inertia and news-cycle delay. A meaningful share of equity market activity comes from retail flows, which respond to news on a delayed timeline. The earnings happen Tuesday after the close. The financial press writes about it Wednesday morning. The newsletters cover it Wednesday evening. The retail investor reads about it on the weekend. The retail buying then pulses into the market on Monday and Tuesday of the following week, and continues at a decaying pace for the next several weeks as the story works through different layers of media coverage and word-of-mouth. This is not a bug in retail behavior; it is simply a structural feature of how information propagates through non-institutional channels. The pulse is real, it is measurable, and it provides part of the demand that sustains the drift.
These four mechanisms do not work independently. They reinforce each other. Anchoring slows the initial reaction; analyst revisions extend the move; arbitrage limits prevent fast money from compressing the edge; retail inertia provides ongoing demand. The result is a phenomenon that survives despite being one of the most widely documented anomalies in finance — because each of the underlying mechanisms is structural, behavioral, or architectural, and none of them are subject to elimination by the simple act of publicizing the pattern.
There is a final point worth making explicitly. PEAD has weakened over time. Bernard and Thomas measured a thirteen percent annualized spread between top and bottom quintiles in the 1970s and 1980s. Modern replications, particularly post-2010, find spreads closer to six or seven percent, with the effect concentrated more heavily in the smaller end of the cap spectrum. This weakening is real, and any honest treatment of the pattern must acknowledge it. But weakening is not vanishing. The edge has compressed; it has not disappeared. For a research platform that scans systematically across mid- and small-cap-tilted universes, six to seven percent annualized spread between long and short legs remains economically significant, particularly when combined with other patterns in a multi-signal stack.
(5) The Mechanic — How The Pattern Engine Scans For PEAD
The Closelook Pattern Engine implements PEAD as a four-step pipeline: trigger detection, abnormal return measurement, classification by quintile, and integration into the hierarchical Pattern Engine architecture. Each step is fully deterministic, reproducible from the data, and free of subjective judgment. This is not a discretionary process. It is a scan.
Step one is trigger detection. Every trading day, the engine pulls the earnings calendar from EODHD for the next two weeks and the past four weeks across the covered universes. Each calendar entry contains the announcement date, the time of release (before or after market hours), the consensus estimate, and the actual reported figure once available. Names that have not yet reported are queued. Names that reported within the last five trading days but have not yet reached the T+3 measurement window are also queued. Names that have reached T+3 are processed.
Step two is abnormal return measurement. For each name that has reached T+3, the engine calculates the cumulative abnormal return over the three trading days following the announcement. The formula is straightforward: take the percentage price change from the close before the announcement to the close three trading days after, and subtract the equivalent percentage change in a reference index over the same window. The reference index is chosen to match the name's primary sector and market cap segment. For Rubin universe names, the engine uses CL-RUBIN-EW as the reference. For HALO names, CL-HALO. For Euro-AI, CL-EURO-AI. For AW40, CL-AW40. The choice of reference matters because PEAD is fundamentally about idiosyncratic surprise, not about market-wide moves; subtracting the index isolates the name-specific component.
Step three is classification by quintile. Once the engine has computed CARs for all names that reported in the relevant window, it ranks them by magnitude and isolates the top quintile (typically the highest twenty percent of positive CARs in the window) and the bottom quintile (the lowest twenty percent). Top-quintile names become Long Setups. Bottom-quintile names become Short Setups. The middle three quintiles produce no signal. The threshold for inclusion in either tail is dynamic: it adjusts to the dispersion of the current week's surprises rather than using a fixed percentage cutoff. In a quiet earnings week with small surprises across the board, the threshold compresses; in a noisy week with several large beats and misses, it widens. This dynamic threshold prevents the engine from generating spurious signals during low-information periods.
Step four is integration into the layered architecture. The Pattern Engine is hierarchical: regime first, then trend, then pattern. The PEAD signals from step three are passed through two upstream filters before becoming live alerts. The regime filter checks whether the current market state is consistent with PEAD effects working — historically, drift patterns are weaker during high-volatility regime transitions and stronger during stable trending regimes. The trend filter checks whether the individual name is in a trend context that supports continuation: a positive CAR in a name already in a strong uptrend is more likely to drift than the same CAR in a name fighting a sustained downtrend. Names that pass both filters become live PEAD alerts in the Pattern Engine output. Names that fail either filter are flagged in the engine but do not appear as actionable signals.
The output is a weekly signal list, published every Friday after the US close, containing the Long Setups and Short Setups that survived all three layers of the architecture. Each signal includes the name, the CAR magnitude, the announcement date, the reference index used, the regime state at signal generation, the trend context, and the expected hold horizon of sixty-three trading days. The list is not a buy list. It is a candidate list — names where the statistical base rate of continuation is favorable enough to warrant deeper review. What you do with that list is a function of your portfolio construction, position sizing, and risk preferences. The engine generates the candidates. The decisions remain yours.
(6) Worked Example One — Rubrik (RBRK), December 2024
The Mid-Cap Pure-Form Drift
Rubrik is the cleanest mid-cap PEAD case in recent memory because every one of the four structural mechanisms that sustain the anomaly was operating at full intensity. The company had IPO'd in April 2024 — eight months before the earnings event in question — which meant analyst coverage was thin, float was constrained by lock-up dynamics, and retail attention was uneven. When Rubrik delivered its Q3 FY2025 result on December 5, 2024, the market had to reprice a young public company in real time, and the structural conditions for a clean drift were as good as they get.
The headline numbers from the December 5 print:
- Revenue $236.2M, against consensus of approximately $218M — a beat of roughly 8%
- Subscription ARR crossed $1B for the first time, growing 38% year-over-year
- Adjusted EPS of −$0.21, materially better than the consensus loss of −$0.40
- Full-year FY2025 revenue guidance raised from a midpoint near $1.20B to a new midpoint of $1.281B
The market reaction was immediate and substantial. Rubrik gapped higher on the December 6 open and continued through the session. The three-day window from December 4 close to December 9 close (T-1 to T+3) captured the bulk of the immediate repricing.
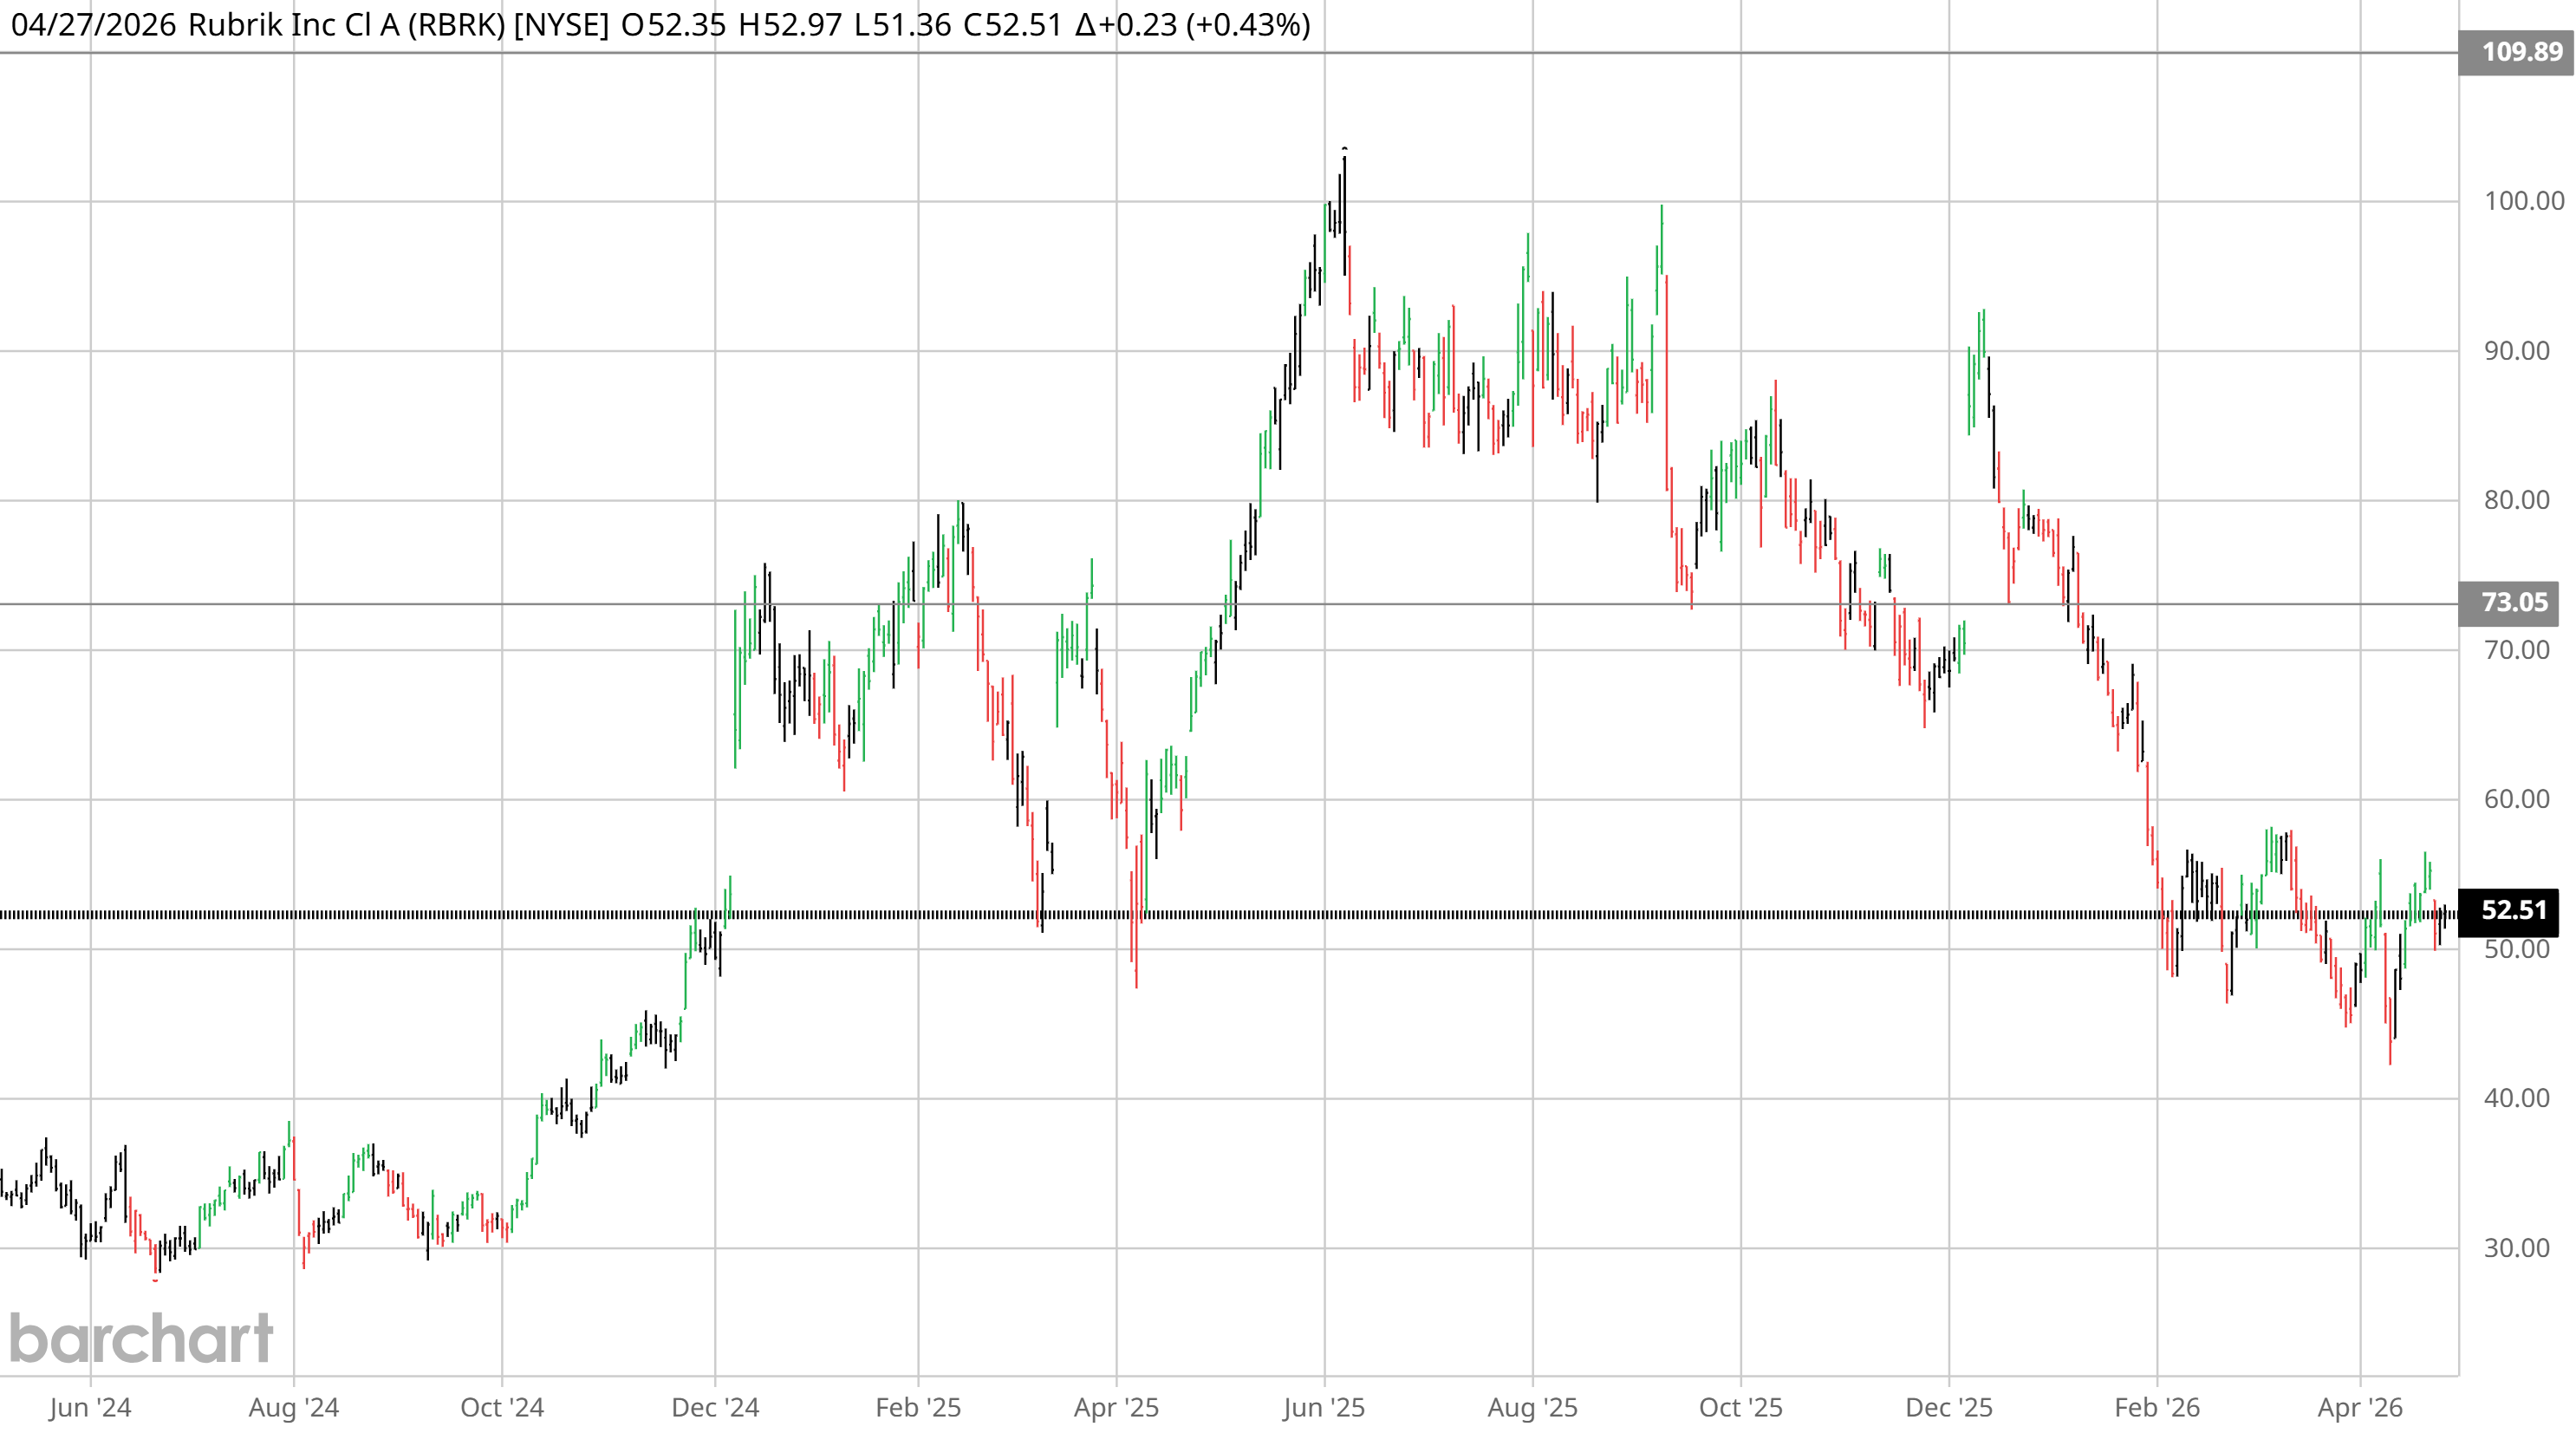
| Window | RBRK Close | QQQ | RBRK Move | QQQ Move | CAR |
|---|---|---|---|---|---|
| T-1 (2024-12-04) | $52.62 | $523.26 | — | — | — |
| T+3 (2024-12-09) | $69.79 | $522.38 | +32.63% | −0.17% | +32.80% |
| T+63 (2025-03-07) | $57.35 | $491.79 | +8.99% | −6.01% | +15.00% |
Benchmark: QQQ (Appendix F substitution; CL-AW40 historical pre-2026 not yet ingested). The +32.80% T+3 CAR puts RBRK in the deepest corner of the long-quintile distribution; the drift continued to deliver +15.00% CAR through T+63 even as QQQ itself declined 6%. Textbook mid-cap pure-form drift.
The case is methodologically clean for three reasons.
First, the surprise was multidimensional. Rubrik did not just beat on revenue. It beat on revenue, beat on adjusted EPS by a wide margin, raised full-year guidance, and crossed a psychologically important ARR milestone in the same release. Every separate dimension forced its own analyst-revision cycle, and those revisions trickled out independently over the following weeks. This is exactly the kind of multi-vector surprise that produces the strongest PEAD effects: it is not one number that needs to be re-anchored, but a complete model rebuild.
Second, the float dynamics were textbook restrictive. Rubrik had IPO'd in April 2024, which placed the December 2024 earnings event in the period between the standard 180-day lock-up expiration (October 2024) and the broader institutional adoption that typically follows in the months after a clean post-lock-up trading period. Analyst coverage was building but still thin compared to mature SaaS names. Float was meaningful but not deep. Both conditions amplify the limits-to-arbitrage component of PEAD: even if a quantitative fund correctly identified the setup, the practical position size was constrained by the available liquidity.
Third, the cybersecurity narrative was supportive at the regime level. The broader cyber tape was strong through Q4 2024, with peer names like CRWD recovering from the July outage and the CL-AW40 cyber sub-component trending. The Pattern Engine's regime layer would have classified the period as supportive for continuation patterns, and the trend layer would have confirmed that RBRK itself was in an established uptrend coming into the earnings event. All three architectural layers — regime, trend, pattern — agreed.
For Closelook readers, the Rubrik case is the answer to the question "does PEAD still work in modern markets?" The answer is yes, and Rubrik in December 2024 is what it looks like when it works: a clean multi-week drift in a mid-cap name with a multi-dimensional surprise, supported by structural float constraints and a favorable regime backdrop. The four academic mechanisms were all operating; the architectural layers all agreed; the result was the kind of trajectory that the textbook predicts.
(7) Worked Example Two — CrowdStrike (CRWD), November 2024
The Reversal PEAD After The Falcon Outage
CrowdStrike's Q3 FY2025 earnings, reported after the close on November 26, 2024, are the most analytically interesting PEAD case of the recent cycle, because the surprise was not "better than expected growth." It was "the crisis is not as bad as feared." This distinction matters because it illustrates a sub-form of PEAD that does not appear in the simplest textbook framing: the Reversal PEAD, where the drift is generated by the gap between deeply negative prior expectations and a merely-okay actual result.
The context is essential. On July 19, 2024, a faulty configuration update to CrowdStrike's Falcon sensor caused widespread Windows system crashes affecting an estimated 8.5 million machines globally — the single largest IT outage in history. The stock collapsed from approximately $390 in mid-July to a low of approximately $200 by early August, a decline of roughly 49%. Through August, September, and October, the question dominating analyst commentary was not "how fast will CrowdStrike grow?" It was "how much customer churn will the outage cause?" Sentiment was uniformly cautious. Analyst estimates were cut. Customer-retention concerns dominated every research note.
When CrowdStrike reported Q3 FY2025 on November 26, 2024, the actual result undershot the worst fears. Net new ARR of $153M was below the year-ago comparable but above the reduced consensus expectations. Total ARR crossed the $4B milestone — the fastest pure-play cybersecurity company to reach that level. Customer retention metrics, while showing some impact from the outage, did not reflect the catastrophic churn that bears had feared. Q4 guidance was raised modestly. The release was not a blowout. It was, in the context of post-outage expectations, a relief.
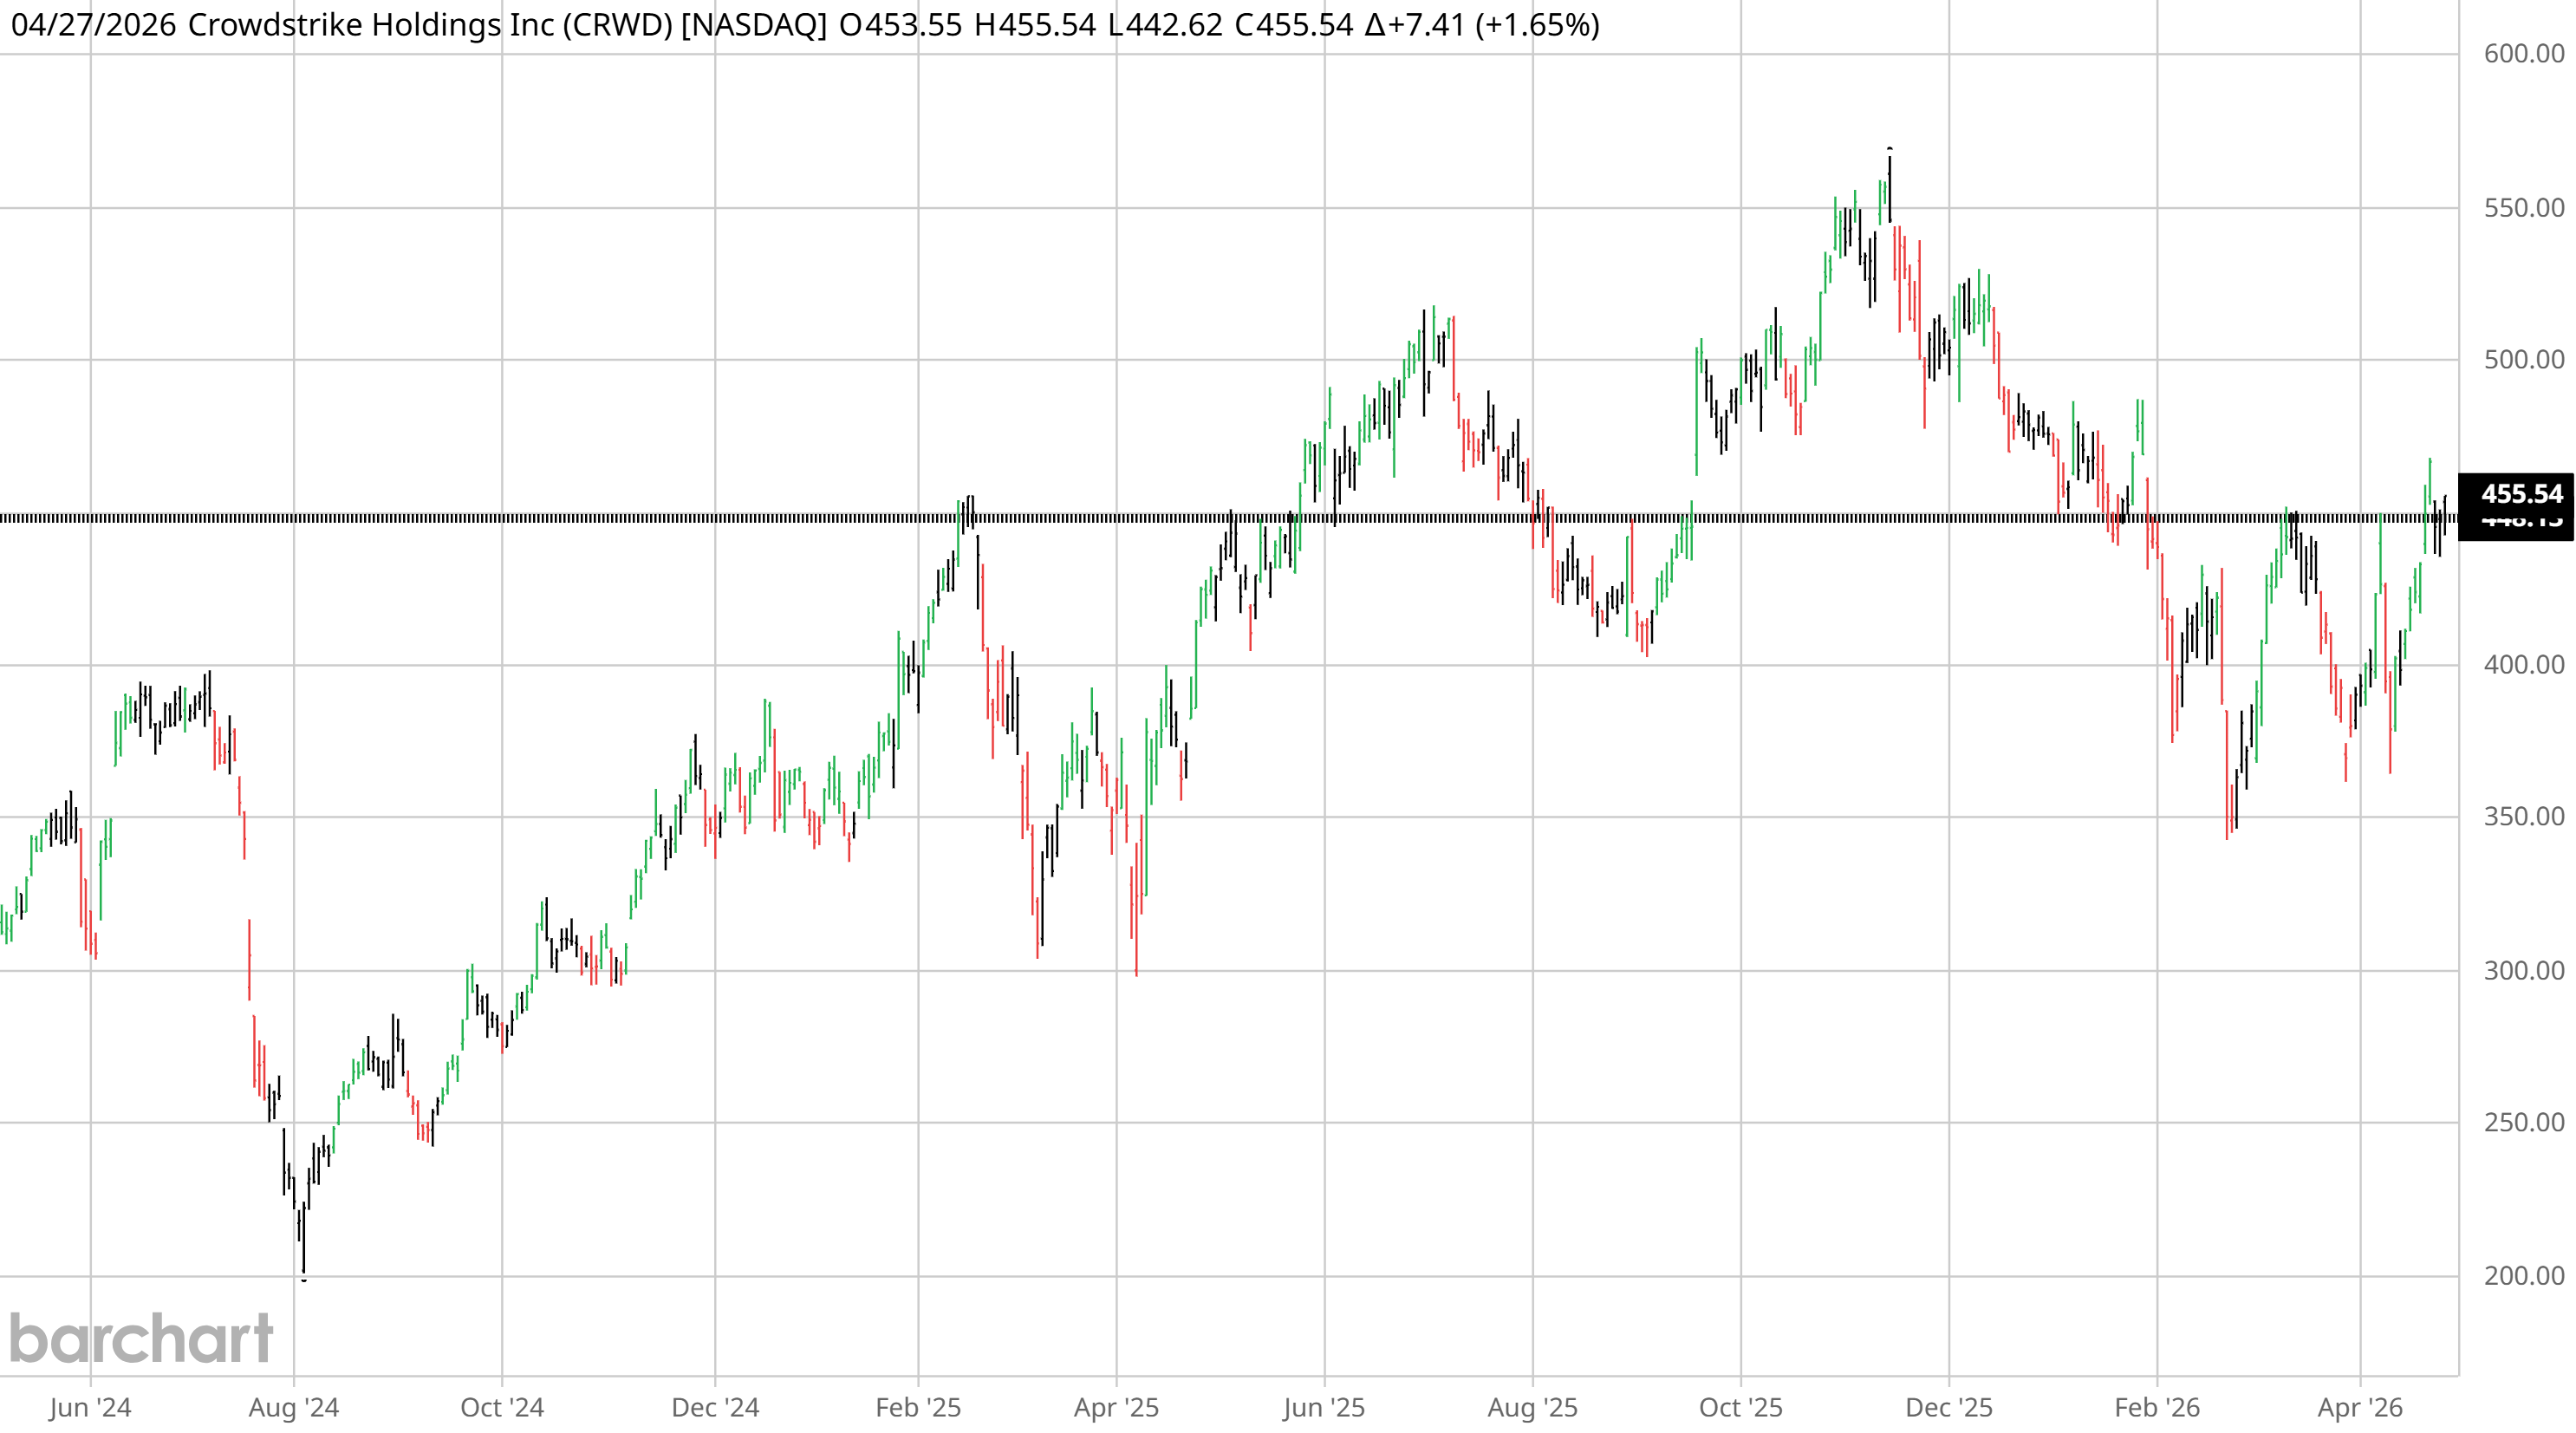
| Window | CRWD Close | QQQ | CRWD Move | QQQ Move | CAR |
|---|---|---|---|---|---|
| Pre-outage (2024-07-18) | $343.05 | $479.49 | — | — | — |
| Outage trough (2024-08-05) | $222.05 | $435.37 | −35.27% | −9.20% | −26.07% |
| T-1 (2024-11-25) | $363.68 | $506.59 | — | — | — |
| T+3 (2024-12-02) | $346.80 | $515.29 | −4.64% | +1.72% | −6.36% |
| T+63 (2025-02-28) | $389.66 | $508.17 | +7.14% | +0.31% | +6.83% |
Benchmark: QQQ (Appendix F substitution). Note the structure: by T+1 close above the pre-outage low and back to $363, the relief was already partially priced — initial 3-day reaction CAR was actually mildly negative (−6.36%). The drift component (T+3 → T+63) added ~13 percentage points as analysts revised estimates back up. This is the Reversal-PEAD signature: the long edge lives in the multi-week analyst-revision pulse, not the immediate post-print reaction.
The Reversal PEAD is structurally distinct from the Pure-Form PEAD illustrated by Rubrik. In the Pure-Form case, the surprise is "better than the prior consensus expected." In the Reversal case, the surprise is "less bad than the prior negative narrative implied." Both produce drifts, but the underlying mechanism is different. In the Pure-Form case, anchoring effects pull the price up toward the new fundamentals. In the Reversal case, the dominant mechanic is fear unwinding — short positions covering, capitulation buyers re-entering, and analysts who had cut estimates aggressively now revising back upward as the operational damage proves containable.
This sub-form is methodologically important for three reasons.
First, Reversal PEAD signals are easy to miss with simple consensus-beat scanning. CrowdStrike's reported numbers were not extraordinary in absolute terms; they were extraordinary relative to a heavily depressed expectation set. A simple "beat percentage" filter would have classified the Q3 FY2025 print as a moderate beat, not a top-quintile event. The Pattern Engine's CAR-based classification correctly captured the reaction magnitude because it measures price response rather than fundamental surprise. The market told the story; the engine read what the market was saying.
Second, the analyst-revision cycle was particularly extended in this case. Sell-side desks had cut estimates aggressively in August through October. Following the November 26 result, the revisions started flowing back in the other direction — and because they had been cut deeper than the actual operational impact warranted, the upward revisions had more room to run. Each revision pulse provided a fresh catalyst for the drift, and the cycle continued through the entire post-earnings period.
Third, the Reversal PEAD case carries asymmetric upside relative to position sizing. The Pure-Form case (Rubrik) is bullish if it works, neutral if it doesn't. The Reversal case (CrowdStrike) is bullish if it works, with the additional asymmetry that the worst-case scenario — continued post-outage damage — was already substantially priced in before the trigger event. This is why Reversal PEAD setups, when they pass the regime and trend filters, can produce particularly favorable risk-reward profiles for sized-appropriate participants.
For Closelook readers familiar with the ABR Framework, the CrowdStrike case has a second-layer interpretation. The Falcon outage was a structural event that briefly shifted CRWD from a Natural Position archetype toward a Volatile archetype (heightened narrative risk, uncertain trajectory). The November 2024 Reversal PEAD signal was the market's preliminary verdict that the structural shift was not durable — that CRWD remained Natural Position once the outage was operationally resolved. This is the kind of cross-pattern integration that the Closelook stack is designed to surface: a pattern signal at one layer (PEAD) confirming a thesis at another layer (ABR archetype stability).
(8) Worked Example Three — Salesforce (CRM), May 2024
The Large-Cap Narrative-Shift Bear Drift
The third case is the one that distinguishes PEAD from a long-only earnings strategy. PEAD is symmetric: beats produce upside drifts; misses produce downside drifts; both effects are statistically significant in the academic literature. Salesforce's Q1 FY2025 earnings, reported after the close on May 29, 2024, is the canonical large-cap bear-drift case of the modern SaaS cycle, and it carries the additional teaching value of demonstrating that PEAD effects are not confined to mid- and small-cap names when the surprise is large enough and the narrative implications are deep enough.
The headline numbers from the May 29 print:
- Revenue of $9.13B, missing consensus of approximately $9.17B — Salesforce's first revenue miss since 2006
- Adjusted EPS of $2.44, beating consensus of $2.38 — but the EPS beat was overshadowed entirely by the revenue miss
- Q2 FY2025 guidance of $9.20B–$9.25B revenue, well below the $9.37B consensus
- Full-year subscription growth guidance lowered to "slightly below 10% Y/Y" from prior guidance of approximately 10%
The market reaction was severe. Salesforce dropped as much as 17% in extended trading on May 29, and the next-day open on May 30 confirmed the gap. The decline continued through the three-day measurement window and beyond.
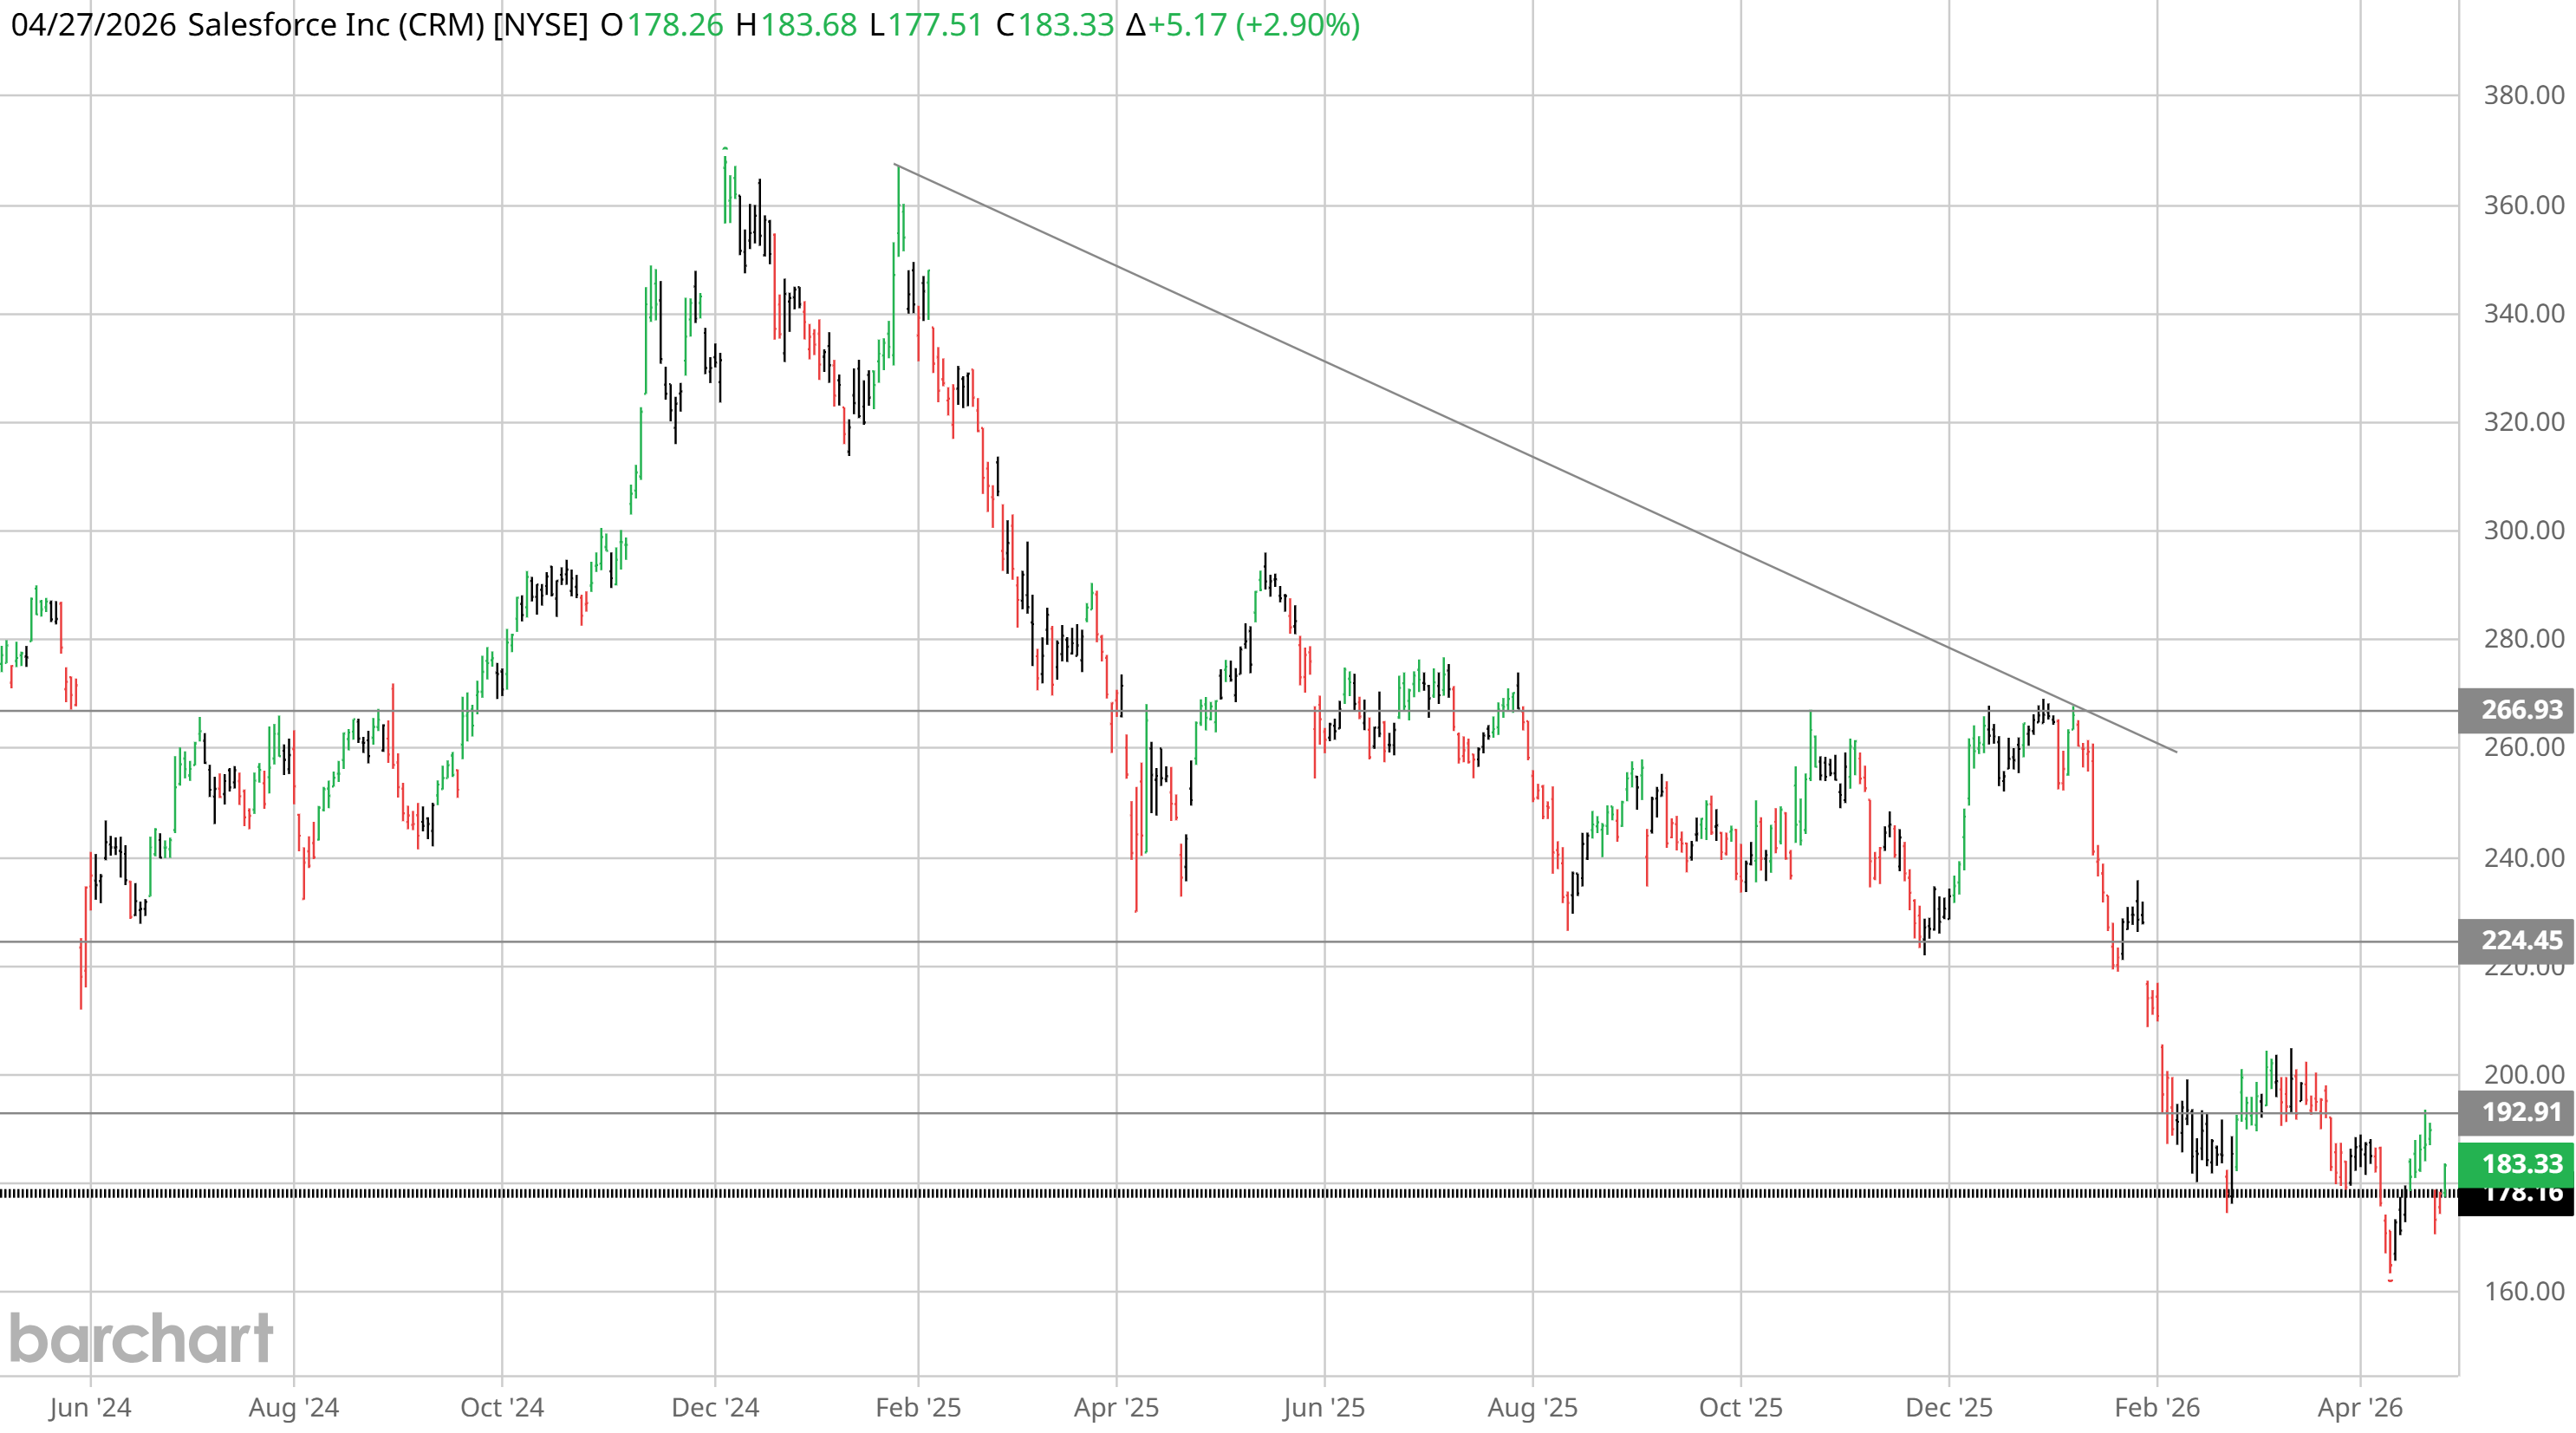
| Window | CRM Close | SPY | CRM Move | SPY Move | CAR |
|---|---|---|---|---|---|
| T-1 (2024-05-29) | $271.62 | $526.10 | — | — | — |
| T+3 (2024-06-04) | $234.86 | $528.39 | −13.53% | +0.44% | −13.97% |
| T+63 (2024-08-30) | $252.90 | $563.68 | −6.89% | +7.14% | −14.03% |
Benchmark: SPY (Appendix F substitution for large-cap broad benchmark). The CAR was almost identical at T+3 (−13.97%) and T+63 (−14.03%) — but the underlying mechanic differed: T+3 was the immediate gap-down reaction; T+63 was the SPY rally (+7.14%) that CRM didn't participate in (−6.89% absolute). The bear-drift held against a strong tape; the underperformance came from missing the rally, not from continued absolute decline. This is the institutional-position-reduction mechanic Section 8 describes.
The case is methodologically critical for three reasons.
First, it demonstrates that PEAD is symmetric. Many readers approach PEAD with a long-only intuition, scanning for beats they can buy. This is half the pattern. The short side of PEAD is, in many cases, cleaner than the long side, because short-selling constraints in the market mean that negative information takes longer to be fully incorporated than positive information. When a stock misses and gaps down, the absence of natural buyers — other than dip-buyers, who are by construction trading against the drift — means the supply continues to weigh on the price for weeks. Salesforce in May 2024 illustrates this dynamic at scale: institutional investors with mandates to hold the largest enterprise SaaS names were forced to gradually reduce position sizes as the analyst-revision cycle absorbed the implications of the first revenue miss in eighteen years.
Second, the case illustrates the role of narrative-shift as an amplifier of large-cap drift. Salesforce was not having a one-quarter operational hiccup. The Q1 FY2025 result was a reaffirmation of a multi-year narrative shift: the legacy enterprise SaaS growth model was decelerating into a single-digit-growth steady state, while the AI-disruption narrative threatened the medium-term moat in unpredictable ways. PEAD effects are strongest when the surprise is consistent with a longer-term narrative shift, because the analyst-revision cycle then incorporates not just the quarterly numbers but a rebuild of the multi-year forecast. CRM analyst revisions over the sixty days following the announcement were uniformly downward, providing a sustained pulse of mechanical selling that drove the drift through the full hold window.
Third, the case demonstrates the discipline required to monitor short-side PEAD signals in large caps. Short positions in declining large-cap names carry asymmetric risk: borrow costs accumulate, dividend obligations pass through, index-rebalance flows can produce sharp counter-trend rallies, and earnings-cycle reversals can compress shorts violently. The Pattern Engine flags the signal. It does not provide the execution framework. That is the user's responsibility, and it is materially harder on the short side than on the long side, particularly in mega-cap names where index mechanics complicate the trade.
For a complete treatment of PEAD, the Salesforce case is essential. It establishes the symmetry of the pattern, illustrates the structural amplifiers of the negative-side drift in large caps, and surfaces the practical limits of trading short-side anomalies in real-world conditions. Readers who skip the short side are studying half the pattern.
There is a final cross-reference worth making for Closelook readers. The Salesforce case is the canonical PEAD manifestation of what later became the broader SaaS narrative-shift theme that the Closelook coverage has tracked through 2024–2026: the legacy enterprise SaaS multiple compression, the gradual acceptance of single-digit-growth steady states, and the emergence of the agentic-software disruption thesis. PEAD captured the first wave of this rerating in real time, in a single name, in five days. The longer-arc thesis took eighteen months to play out across the broader sector. The signal preceded the narrative.
(9) Where PEAD Fails — An Honest Limitations Section
This section is the part of every Lab Read that matters most, because it is the part most other research providers leave out. PEAD does not always work. The pattern has well-documented failure modes, and any responsible deployment of the signal must understand them before treating the engine output as actionable.
Context failures: regime and sector
The first failure mode is regime sensitivity. PEAD is a continuation pattern, and continuation patterns work best in stable trending markets. During regime transitions — sharp shifts from low-volatility uptrends to high-volatility corrections, or vice versa — the underlying behavioral mechanics that sustain the drift are disrupted. Anchoring effects weaken because every market participant is re-anchoring simultaneously to a new macro regime. Analyst revision cycles compress because the news cycle dominates the earnings narrative. Retail inertia is replaced by retail panic or retail enthusiasm, which moves on a timescale of days rather than weeks. The result is that PEAD signals generated during regime transitions have a substantially lower base rate of working than signals generated during stable periods. The Pattern Engine architecture addresses this directly through its regime filter, which suppresses PEAD signals during identified transition states. But the suppression is probabilistic, not absolute, and a regime transition can begin between the signal generation and the end of the sixty-day hold window. This risk cannot be eliminated; it can only be acknowledged.
The second failure mode is sector-wide drift contamination. PEAD is calibrated against a sector reference index because the goal is to isolate name-specific surprise from market-wide moves. But sector references can themselves drift. If a positive CAR is generated in a name within a sector that is already in a strong uptrend driven by a thematic narrative — say, a cybersecurity name reporting during a broad cyber rally — part of the apparent name-specific surprise may actually reflect sector momentum rather than idiosyncratic information. In these cases, the subsequent drift in the name may be driven less by the company's own fundamentals and more by the continued momentum of the sector. When the sector turns, the drift turns with it, often before the sixty-day hold window is complete. Multi-factor models can adjust for this, but the simple two-step CAR calculation cannot. Readers should treat PEAD signals in already-extended sectors with additional skepticism.
Structural failures: clustering, decay, and combined signals
The third failure mode is earnings-season clustering. PEAD as a strategy assumes that signals can be diversified across many independent earnings events. In reality, earnings cluster heavily in two or three week windows after each quarter end. During these clustered windows, dozens of PEAD signals fire simultaneously, and their performance is not independent: they share exposure to the same macro factors, the same sector rotations, the same overall risk-on or risk-off tape. A long-short PEAD strategy that builds a portfolio of ten long setups and ten short setups during the same week is taking on substantially more correlated risk than the academic literature's idealized version suggests. The Pattern Engine surfaces this directly by including a clustering indicator in the weekly output, but the user must size positions accordingly.
The fourth failure mode is the post-2010 weakening. The strongest empirical PEAD effects in the academic literature are measured on data from the 1970s and 1980s, with progressively weaker effects through the 1990s and 2000s, and noticeably compressed effects post-2010 — particularly in mega-cap names with extensive analyst coverage. This is the rational consequence of decades of capital flowing into systematic strategies that target the pattern. The Pattern Engine remains useful in the modern environment because it concentrates on universes with mid-cap exposure (Rubin, HALO, AW40 all carry meaningful mid-cap weightings), but readers expecting the thirteen percent annualized spreads documented by Bernard and Thomas in the 1980s will be disappointed. Modern PEAD effects in the universes Closelook covers are more in the range of six to nine percent annualized spread between top and bottom quintiles, and even this estimate carries substantial uncertainty.
The fifth failure mode is the combined-signal trap. There is a strong empirical case that PEAD performs better when combined with other patterns — analyst revision momentum, short-interest changes, technical trend confirmation. The Closelook Pattern Engine architecture is designed precisely to enable this combination: PEAD becomes one of multiple Layer-3 patterns that can fire simultaneously on the same name. But combined signals carry combined assumptions, and combined assumptions require combined validation. A PEAD-plus-trend signal that worked in 2018-2022 may perform very differently in 2024-2026 if the underlying market microstructure has shifted. The Pattern Engine output reports each pattern independently and notes when multiple patterns fire on the same name; it does not currently publish a combined-signal score, because such a score would imply a level of statistical confidence that the underlying data does not yet support. This is a feature, not a limitation. Combined signals are useful for prioritization, not for replacing independent judgment.
The honest summary: PEAD is a real, persistent, statistically significant anomaly that has survived fifty years of public knowledge because its underlying mechanics are structural and behavioral. It is not a guaranteed source of returns. It is a probabilistic edge that requires careful treatment of regime context, sector dynamics, clustering, and the modern compression of the effect. The Pattern Engine surfaces the candidates. The user's job is to apply judgment to which candidates fit their portfolio construction.
(10) PEAD In The Closelook Pattern Stack — And Where To Watch It Live

PEAD is the first pattern Closelook formalizes for the Pattern Engine. It is not the last. The full pattern roster, currently in various stages of specification and deployment, includes Sector Relative Strength (the rotational rankings of the eleven SPDR sectors against the broader index), Regime Signature analysis (the quantitative distinction between Grind-Up and Drift-Down behavioral textures), Support Confluence at Regression Channels (the deterministic identification of high-probability support clusters), and several additional patterns drawn from established quantitative literature. Each pattern will receive its own Lab Read in this format, explaining the academic foundation, the implementation in the engine, and the worked examples that illustrate when it works and when it fails.
The stack is hierarchical by design. Regime sits at the top: every pattern below operates against an explicit regime classification, and most patterns are suppressed during regime transitions. Trend sits in the middle: the trend context for each name is established before any pattern signal is allowed to fire. Pattern signals like PEAD sit at the third layer: they are deterministic, mechanical, and designed to be combined with the upstream context to produce candidate signals rather than standalone trade recommendations.
The Pattern Engine generates its weekly output every Friday after the US close. PEAD signals are tagged distinctly from other pattern types, with each signal carrying its CAR magnitude, its regime context, its trend status, the universe it was sourced from, and the expected sixty-three day hold horizon. The output is published to the Pattern Engine page and is updated continuously as new earnings releases pass through the T+3 measurement window. Names appearing in the engine's weekly list are not buy recommendations; they are systematic candidates that have passed all three architectural layers and warrant further review.
For readers who have followed this Lab Read to its conclusion, the next step is to see how the theory translates into live output.
Where to watch PEAD live on Closelook
Lab — methodology summary: closelook.net/lab/patterns/pead/ — formula, universes, failure modes
Tape — chronological feed: closelook.net/tape/category/pead/ — every PEAD card as it fires
Pattern Engine — PEAD live: closelook.net/signals/scanner/pead/ — current Long Setups + Short Setups
The Lab explains the why. The Engine shows you the now. Together they form the complete loop: a quantitative research framework with deep methodological foundations, deployed as a live operational tool, published continuously, and explained openly enough that readers can understand exactly what the engine is doing and exactly where it can fail. This is the standard Closelook holds itself to across all of its research products, and the Pattern Engine is its most recent expression.
(11) Risk Disclosure & Methodology Notes
This Lab Read is a methodological dossier published for educational and research purposes by Closelook. It does not constitute investment advice, a solicitation to buy or sell securities, or a recommendation regarding any specific trading strategy. The Pattern Engine generates systematic candidate signals based on the methodology described above; the decision to act on any signal, the position sizing, the risk management, and the portfolio construction context are entirely the responsibility of the reader.
Past performance, including the historical worked examples discussed in this dossier (Rubrik December 2024, CrowdStrike November 2024, Salesforce May 2024), is not indicative of future results. The PEAD anomaly has weakened materially since its original documentation in the 1980s and may continue to weaken or behave differently in future market regimes. Short positions, in particular, carry asymmetric risks including borrow costs, squeeze potential, and execution complexity that are not addressed by the statistical edge of the signal alone.
The Pattern Engine architecture, including the regime filter, the trend filter, and the CAR-quintile classification methodology, is subject to ongoing refinement. The methodology described in this Lab Read reflects the engine state as of publication and may evolve as additional data, additional patterns, and additional academic research are incorporated. All updates to the methodology will be published openly on the Pattern Lab hub.
Closelook publications are intended for sophisticated investors who understand quantitative pattern analysis and can independently assess the limitations of any systematic signal. Readers requiring personalized investment advice should consult a licensed financial advisor.
Closelook — Systematic Market Intelligence for global tech investing
Editor: Thomas Look · Closelook Venture GmbH
A Closelook Lab Read · Published as part of the Pattern Engine methodology series